


Historical Drought Characterization in Awash River Basin, Ethiopia
Marta Gebreyesus1*, Abirham Cherint1, Moges Molla1, Tefera Ashine2 and Goitom Kelem3
1Ethiopian Environment and Forest Research Institute, Ethiopia
2Agriteam Canada Consulting Ltd, Ethiopia
3National Meteorological Agency Agency of Ethiopia, Ethiopia
Submission: October 02, 2020 Published: October 27, 2020
*Corresponding author: Marta Gebreyesus, Ethiopian Environment and Forest Research Institute, Addis Ababa, Ethiopia
How to cite this article: Marta G, Abirham C, Moges M, Tefera A, Goitom K. Historical Drought Characterization in Awash River Basin, Ethiopia. Int J Environ Sci Nat Res. 2020; 26(3): 556186. DOI:10.19080/IJESNR.2020.26.556186
Abstract
This research is intended to characterize drought intensity, duration, and areal extent of meteorological drought in the Awash River basin. Using rainfall data and evapotranspiration data is useful to determine the spatial distribution and characteristics of drought and understanding the characteristics is important for monitoring and establishing an early warning system. Reconnaissance Drought Index (RDI) was used for the identification of drought conditions, Mann-Kendall test is used for determining the trend, and ArcGIS is used to analyze the areal extent of drought in the Awash River Basin.
The basin is affected by mild, moderate, severe, and extreme drought in different years. The duration of dry months ranges between 1- 4 months. Severity is increasing in the upper and middle Awash basin. There is also an aerial shift of extreme drought from the lower basin to the upper and middle part of the basin. The worst drought in recorded in 2015 by its intensity, duration, and areal extent.
Keywords:Drought; Meteorological drought; Precipitation; Evapotranspiration
Abbreviations: RDI: Reconnaissance Drought Index; RDIn: Normalized Reconnaissance Drought Index; RDI: RDIst Standardized Reconnaissance Drought; P: Precipitation; PET: Potential Evapotranspiration; SPI: Standardize Precipitation Index
Introduction
Drought is nothing but a natural disaster that prevails due to scarcity of water or moisture [1]. Droughts can be considered as multidimensional hazardous phenomena characterized by their severity, duration, and areal extent [2]. Ethiopia is affected by recurrent drought events and suffers a severe drought in different years. . The causes are different either natural or manmade or both. The primary cause is the fluctuation of the general atmospheric circulation and human interferences are also one cause such as deforestation, overgrazing, and over-cultivation and enhance the severity and prolongation of drought recurrences [3]. The agriculture and livestock sectors are highly impacted by droughts in many parts of Ethiopia. For instance, the 1984 drought in Wollo led to a 61% and 94% decline in the yield of teff and sorghum, respectively [4]. According to the survey conducted in 2006 drought occurs every two years in the upper part of the Awash basin. Larger farmers are dependent on rain-fed agriculture only a few farmers are engaged in smallholder irrigation in the Basin.
There are four different types of droughts meteorological drought, agricultural drought, hydrological drought, and socio-economic drought. All drought types are originated due to deficiency of precipitation or meteorological drought. The other types of drought are cascaded from deficiency of precipitation. Agricultural drought is linked with a deficit of soil moisture, hydrological drought is associated with a shortage of surface and subsurface supply, and socioeconomic drought is associated with the supply and demand of goods and occurred when the demand exceeds the supply.
The meteorological drought which we will see in detail in this document is based on the degree of dryness (in comparison to some normal or average amount) and the duration of the dry period of an area. This paper is devoted to the identification and assessment of meteorological drought in the Awash River Basin. Meteorological drought is a simple deficit of rainfall from the normal [5].
Materials and Methods
Description of the study area
The Awash River Basin is found in the central-east part of Ethiopia between 8° 5’ and 12° N and 38° and 42° E. It covers a total area of 110,000km2. The largest part of the Awash River Basin is located in the arid lowlands of the Afar Region in the northeastern part of Ethiopia. The total length of the main course is about 1200km drainage of the basin covering parts of the Oromia, Somali, Amhara, and Afar region (Koriche 2012) (Figure 1).

Methodology
Monthly precipitation data of 18 meteorological stations were taken from the National Meteorological Agency for a maximum period of 35 years from 1981 to 2015. The reconnaissance Drought Index (RDI) was used in this study for drought classifications. This method used both precipitation and evapotranspiration data which is more representative of the deficient water balance conditions than an index based only on precipitation. Evapotranspiration and standardizes RDI is calculated using a newly developed DrinC software package. Mann-Kendall test was used to analyze the trend and to generate the spatial extents of drought ArcGis was used.
The Reconnaissance Drought Index (RDI) can be characterized as a general meteorological index for drought assessment [2]. The RDI can be expressed with three forms: the initial value αk, the normalized RDI (RDIn), and the standardized RDI (RDIst). In this paper, we will focus on RDIst. The Standardized RDI (RDIst) is computed following a similar procedure to the one that is used for the calculation of the SPI: The expression for the Standardized RDI is:
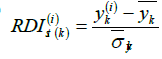
In which yi is the ln (𝛼0(𝑖)), yk is its arithmetic mean and 𝛼̅𝑦𝑘 is its standard deviation. The Reconnaissance Drought Index (RDI) was developed to approach the water deficit more accurately, as a sort of balance between input and output in a water system. It is based both on cumulative precipitation and potential evapotranspiration, which is one measured (P) and one calculated (PET) determinant. Positive values of RDIst indicate wet periods, while negative values indicate dry periods compared with the normal conditions of the area (Table 1).

Mann-Kendall Test is used to determine the trend of the drought occurred in the basin
The Mann-Kendall statistic S is given as
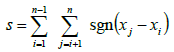
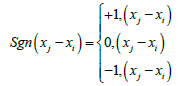
The application of the trend test is done to a time series xi that is ranked from i = 1, 2 …n-1, and xj, which is ranked from j = i+1, 2 ….n. Each of the data points xi is taken as a reference point which is compared with the rest of the data point’s xj so that
It has been documented that when n ≥ 8, the statistic S is approximately normally distributed with the mean. E(S) = 0 The variance statistic is given as

Where ti as considered the number of ties up to sample i. The test statistics Zc is computed as
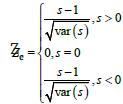
Here follows a standard normal distribution. A positive (negative) value of Zc signifies an upward (downward) trend. The significance level, or a Type I error, α, is the probability of rejecting the null hypothesis when it is true. A significance level α is also utilized for testing either an upward or downward monotonic trend. If Zc appears greater than Zα/2 where α depicts the significance level, then the trend is considered as significant. Significance levels are normally set quite low at values of 0.01, 0.05, or 0.10. The smaller the valve of α, the more is the confidence there is that the null hypothesis is false when it has been identified as such. From the relationship among power, the slope of trend, and sample size for the given significance level of 0.05 and coefficient of variation CV = 0.5, the power of the test is an increasing function of both the absolute slope and the sample size. In other words, as the sample size increases, the power of the test increases leading to an increased ability to discern the existence of a trend (Yue S, et al. 2002). In this study significance level (α) of 0.05 i.e. confidence level (1-α) of 95% as per Mann- Kendall is used for drought trend analysis over the Upper Krishna basin in Maharashtra.
Sen’s Slope Estimator Test: The magnitude of the trend is predicted by Sen’s estimator (Sen, 1968). Here, the slope (Ti) of all data pairs is computed as

Where xj and xk are considered as data values at time j and k (j>k) correspondingly. The median of these N values of Ti is represented as Sen’s estimator of slope which is given as:
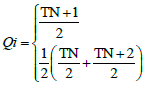
Sen’s estimator is computed as
Qmed=T (N+1)/2 if N appears odd, and it is considered as
Qmed= [TN/2+T (N+2)/2]/2 if N appears even.
In the end, Qmed is computed by a two-sided test at 100 (1-α) % confidence interval and then a true slope can be obtained by the non-parametric test. The positive value of Qi indicates an upward or increasing trend and a negative value of Qi gives a downward or decreasing trend in the time series.
Result and Discussion
Drought characterization
Drought characterization mainly focuses on the analysis of the historical drought conditions of an area. 12-month RDI values were estimated during the period 1981 - 2015 to provide an overview of drought occurrences. The result of RDIst12 shows that there were 146 (23.2%) drought events occurred in the basin and the rest 76.8% were normal conditions (Figure 2).

Drought frequency
From 1981 to 2015, 146 times drought events occurred within 18 stations in the basin, and from these 20.5 % was extreme, 11% was severe and 27.4% was moderate droughts occurred. Most drought events recorded in station Ataye (Middle Awash) 11 times and extreme drought events recorded in station Abomsa (Upper Awash) 4 times within these 35 years (Figure 3).

Duration and intensity
The results of RDI showed the duration ranges between 1- 4 months. The longest drought was recorded in 6 stations and it’s about 4 months duration in 1999-2000, 2002-03, 2014-15, and 2015-16. The maximum number of dray months recorded in station Kimoye (Middle Awash) in 2015-16 and reached 6 months. Results from RDI12 calculation show that severe drought was recorded in all stations of the basin and the highest severity and extremely dry condition was recorded in Dubti meteorological station with index value of -3.64 (Lower Awash) during 1985.
Drought periods
The RDI12 results showed that extreme drought occurred in 1984-85, 1985-86, 1997-98, 2002-03, 20014-15, and 2015-16 in the basin (Figure 4-6).


Areal extent of drought
Works of the literature revealed that the 1984 drought period of Ethiopia was very severe and extreme especially half of the northeastern rift valley of the country was severe in the. In line with this Degefu [6] indicates the driest areas for 3 consecutive years which include the Central Highlands the Northeastern Highlands, Northeastern Rift Valley, and Central part of Ethiopia.
A finding shows that in 1984 about 99% of the total area of the basin was affected by drought and 62.4% of the area was covered by extreme drought. The highest meteorological drought occurred in 2015 which 100 % of the total areas of the basin covered by drought and 73.4% were extreme and the highest meteorological drought occurred in 2015 which 100 % of the total areas of the basin covered by drought and 73.4% were extreme. In 1984 the extreme drought was in the lower Awash Basin but in 2015 the extreme was in the upper, middle, and some parts of lower (Figure 7).

In 1984 extreme drought occurred in the lower awash basin and some parts of middle awash was affected by extreme drought mild, moderate and severe droughts occurred in upper and some part of the middle awash basin while in 2015 the extremity and severity of the drought is very high in the upper part of Awash and moderate level drought is occurred in the lower part of the basin. While extreme droughts occurred in the upper and middle part of the Awash basin, severe and moderate droughts occurred in the lower part of the Awash basin (Figure 8 & 9).
According to Singh et al. [7], there was a large-scale oceanatmosphere climate interaction linked to periodic warming in sea surface temperatures across the central and east-central Equatorial Pacific in March 2015. In Ethiopia, these events lead to drier conditions mainly in northwestern regions, especially affecting the rainy season that occurs from June through September. Overall, 2015 was a very dry year in large parts of Ethiopia, as represented by rainfall anomalies from the Climate Hazards Group Infrared Precipitation with Stations (CHIRPS; Funk et al. 2015c) data. Over 90 % of the basin area was affected by moderate and severe level drought in the year 2015-2016 and 78% of the area was affected by extreme drought events (Figure 3). As compare to 1984/85 drought period the basin was highly encountered by extreme drought in 2015. According to the UN (2015) report and Sjoukje et al. (2017), it was the worst drought in decades and the impact was aggravated in the northern and central part of Ethiopia, which leads hundreds of thousands of farmer’s crop production to be failed and loss of their livestock’s [8-20].


Trend
Using the Mann-Kendall test most of the stations showed an increasing trend of drought severity during the autumn, winter, and spring season’s only one station showed a decreasing trend of severity during the Autumn & Summer seasons (Table 2).

Conclusion
The analysis of drought using RDI from rainfall data and evapotranspiration is useful to determine the spatial distribution and characteristics of drought. RDI12 showed recurrent drought events that occurred within 35 years from 1981-2015 and its intensity includes mild, moderate, severe, and extreme. Extreme drought occurred in the years 1984-85, 1985-86, 1997-98, 2002- 03, 20014-15, and 2015-16 and the maximum RDI12 value (extreme drought) occurs in station Dubti in the year 1984. In 1984 about 99% of the total area of the basin was affected by drought and 62.4% of the area was covered by extreme drought. The highest meteorological drought occurred in 2015 which 100 % of the total areas of the basin covered by drought and 73.4% were extreme. In 1984 the extreme drought was in the lower Awash Basin but in 2015 the extreme was in the upper, middle, and some parts of lower.
In general recurrent droughts occurred in the basin due to below-average precipitation. Severity is increasing in the upper and middle Awash basin and the spatial coverage of drought & intensity is increasing in the basin in different years. There is also an aerial shift of extreme drought from the lower basin to the upper and middle part of the basin. The worst drought is 2015 by its intensity, duration, and areal extent. Developing efficient and properly functioning drought early warning systems specific to the extreme drought-prone areas and short and long term adaptation plan, Water harvesting technologies, integration of drought-risk management approaches into long-term development measures, and involving investors around the basin in different adaptation practice and intervention practice are highly recommended to minimize the risk of drought in the basin.
References
- Mamun AA, Rahman NF, Aziz A, QayumA, Hossain I, et al. (2018) Meteorological Drought(3).
- Tsakiris G, Vangelis H (2005) Establishing a Drought Index Incorporating Evapotranspiration. European Water (9/10): 3-11.
- Haile T (1988) Causes and Characteristics of Drought in Ethiopia.
- Desalegn Ch E, Babel MS, Das Gupta A, Seleshi BA, Merrey D (2006) Farmers’ perception about water management under drought conditions in the Awash River Basin. International Journal of Water Resource Development 22(4): 589-602.
- Shah R, Manekar VL, Christian RA, Mistry NJ ( 2013) Estimation of Reconnaissance Drought Index (RDI) for Bhavnagar District, Gujarat, India.
- Degefu W (1987) Some aspects of meteorological drought in Ethiopia. In Drought and hunger in Africa. Denying famine a future.
- Singh R, Worku M, Bogale S, Cullis A, Adem A, et al. (2016) Reality of resilience: Perspectives of the 2015–16 drought in Ethiopia. BRACED Resilience Intel, No. 6.
- Malakiya AD, Suryanarayana TMV (2015) Assessment of Drought Using Standardized Precipitation Index (SPI) and Reconnaissance Drought Index (RDI): A Case Study of Amreli District.International Journal of Science and Research.
- Edossa DC, Babel MS, Gupta AD (2009) Drought Analysis in the Awash River Basin, Ethiopia. Water Resources Management 24: 1441-1460.
- Tigkas D (2008) Drought Characterization and Monitoring in Regions of Greece. European Water 23/24: 29-39.
- Tigkas D, Vangelis H, Tsakiris G (2013) The RDI as a composite climatic index.European Water 41: 17-22.
- Mahajan DR, Dodamani BM (2015) Trend Analysis of Drought Events Over Upper Krishna Basin in Maharashtra.Aquatic Procedia 4: 1250-1257.
- Tigkas D, Vangelis H, Tsakiris G (2014) DrinC: software for drought analysis based on drought indices.Earth Science Informatics 8: 697-709.
- Azam M, Maeng SJ, Kim HS, Lee SW, Lee JE (2018) Spatial and Temporal Trend Analysis of Precipitation and Drought in South Korea. Water 10(6): 765.
- Segele ZT, Lamb PJ (2005) Characterization and variability of Kiremt rainy season over Ethiopia. Meteorology and Atmospheric Physics 89(1): 153-180.
- Shanko D, Camberlin P (1998) The effects of the Southwest Indian Ocean tropical cyclones on Ethiopian drought. International Journal of Climatology 18(12): 1373-1388.
- Shaban A (2009) Indicators and aspects of hydrological drought in Lebanon. Water Resource Management 23: 1875-1891.
- Nazahiyah S, Niranjali J, Muhammed B (2012) Trend analysis of drought using Standardized Precipitation Index (SPI) in Victoria, Australia.
- Webb P, Braun JV, et al. (1992) Famine in Ethiopia: Policy implications of coping failure at national and household levels. Research Reports. G. Desai. Washington, D.C., International Food Policy Research Institute. p. 92.
- Wilhite DA, Glantz MH (1985) Understanding the drought phenomenon: the role of definitions. Water Int 10(3): 111-120.


