


Estimation of Farm Level Biomass and Carbon Stock in Enset (Enset ventricosum) Growing Area and its Implication to Climate Change Mitigation: A Case Study from Mount Damota Area in Wolaita, Ethiopia
Takele Ashebo*
Samara University, Ethiopia
Submission: July 25, 2020; Published: September 08, 2020
*Corresponding author: Takele Ashebo, Samara University, Samara, Ethiopia
How to cite this article: Takele A. Estimation of Farm Level Biomass and Carbon Stock in Enset (Enset ventricosum) Growing Area and its Implication to Climate Change Mitigation: A Case Study from Mount Damota Area in Wolaita, Ethiopia. Int J Environ Sci Nat Res. 2020; 25(3): 556172. DOI:10.19080/IJESNR.2020.26.556172
Abstract
This study was conducted in Mount Damota area in Wolaita, which is known as a potential area for enset based agriculture. This thesis work aimed at estimating the aboveground and belowground biomass, necromass, and soil organic carbon and thereby understanding the contribution of enset (Ensete ventricosum) plantation to climatic change mitigation via examining the carbon sequestration potential. The biomass and carbon stock of enset were determined by using both destructive and non-destructive methods. The study revealed that the height, DBH and biomass of enset plants generally increase with increasing age and while the number of plants decreasing. The amount of carbon fraction in leaf, pseudostem, corm and root averaged for all three age groups were 5.26, 2.13, 2.98 and 5.63%, respectively. Carbon fraction in body of enset plant increases with increasing age. The aboveground, belowground, necromass and total biomasses of the study area were 408.34, 106.10, 4.44 and 518.6t ha-1 and the carbon stock in aboveground, belowground, necromass and soil were 30.20, 9.12, 2.22 and 24.92t ha-1, respectively. The potential carbon sequestered in living enset plantation among five measured plots was 39.32ton ha-1 respectively. That is, enset plant can sequester about 144.30 CO2-eq atmospheric CO2 in its living above and below ground biomasses in present situation. The estimated total carbon stock for enset plantation farm was about 66.46t ha-1 which is equivalent to 243.91t ha-1 of carbon dioxide. Hence, being one of perennial plant in Ethiopia, enset has high biomass production and carbon stock which reflects it can have great importance to climate change mitigation.
Keywords: Mount Damota area; Ensete ventricosum; Biomass; Carbon stock; Carbon sequestration; Climate change mitigation; Wolaita
Background
World agriculture is currently faced with the challenge of feeding a rapidly increasing global population, predicted to peak at 9.2 billion by 2075 [1], while meeting an obligation to reduce greenhouse gas (GHG) emissions as climate change grows in importance as an international policy issue. Agriculture is a source of three primary GHG, being CO2, CH4 and N2O [2].
On the other hand, Agriculture can help mitigate climate change by either reducing GHG emissions or by sequestering CO2 from the atmosphere in the soil. The application of improved agricultural techniques (e.g. organic agriculture, conservation tillage, agro-forestry) reduces or stops soil erosion and converts carbon losses into gains. Consequently, considerable amounts of CO2 are removed from the atmosphere [3]. Although agricultural GHG fluxes are complex and heterogeneous, appropriate management of agricultural systems provides the opportunity for some mitigation to be achieved [2].
In order to reduce trade-offs among food security, climate change and ecosystem degradation, productive and ecologically sustainable agriculture is crucial [4]. In Ethiopia, four major farming stems are recognized [5-7]: pastoralism; rotation farming; farming based on grain; and farming based on enset. Within the last category four sub-systems can in turn be identified, depending on the degree of dependency on the enset as a key product and on environmental, agronomic and cultural considerations: the intensive area of enset; the area of combined enset; the cerealdominated area; the area dominated by tubers and roots [4]. Enset is environmentally friendly, ecologically sustainable and affect the macro-environment of an area in a positive manner [7].
As Admasu [8], enset clones owing to a high leaf appearance rate (0.18 leaves d-1) during early growth at 300 days after planting, LAI of 4.5m22/m22, intercepted 92-97% of incoming PAR, range of RUE from 1.43-2.67gMJ-1 high DM ‘kocho’ yield potential (17.1-33.8t ha-1y-1). It has high calorie production per unit of an area. This proves that enset plants have high total biomass production capacity. By capturing atmospheric CO2, not only for woody but also for perennial trees and herbaceous plants with extensive root systems, it stores large amounts of organic carbon in above and belowground biomass [9].
Wolaita belongs indeed to the dominant enset growing area in southern Ethiopia and the Enset cropping gives it a striking geographic originality [7]. Wolaita is one of the most densely populated, and nowadays, it is one of disaster-prone and faminestricken areas in southern part of Ethiopia [10]. There was great destruction of vegetation cover and high rate of degradation in the area [11]. Besides, enset area coverage has been declining in the last few eras (FAO, 2010) which led an increasing soil degradation and erosion. Currently there is a serious climate change in the area. As Dechassa (2000), belg rains, which normally commence in February, were delayed by almost 3 months.
Despite its role in providing food and alleviating food security & other multiple uses, research information on enset is generally scarce. The information on its biomass production and its role as carbon sink were not so far studied. This study, therefore, attempted to generate information on the aforementioned knowledge gap via field measurement and lab analysis.
Objectives
The general objective of this study is to estimate the farm level biomass production and carbon stock of enset plantation and its role in climate change mitigation. Also, the followings are the specific objectives:
a) To estimate the above and below ground biomass production of enset plantation.
b) To estimate total carbon stock in enset plantation including Necromass and soil and
c) To evaluate the role of enset plantation in climate change mitigation.
Materials and Methods
Description of study area
The study area is found between 6.4 - 6.90N latitude and 37.4-37.80E longitude. The area lies about 390km south of Addis Ababa (Figure 1). The mean annual temperature varies from 16 to 19.90C. Annual monthly temperature varies from 16 to 19.70C. The mean annual rainfall is around 1375mm (Damot Gale Woreda of Agriculture Office, 2008). The major soil types found in the area are Nitosols, Haplic Yermosols, Eutric Cambisols, Orthic Andisols and Calcaric Fluvisols (ONCCP/ RPOSE, 1985). Nitosols are the dominant soils covering around two third of the total area (Belay, 1992). The geology of the whole Wolaita plateau is made up of volcanic rocks of the Magdala group consisting of ignimbrites, rhyolites, trachytes and trachytic and rhyolitic tuffs of the Miocene and Pleistocene periods. As Ashebir (2008), there are open woodland, riparian vegetation, scrub (10.79% in 1984). The new plantation occurred in the eastern and south eastern parts of the mountain covering 2.39% of the area.

The population of Mount Damota was 320,133 in 2007. The average family size for the district is 5.1 (RBFEDW, 2007). The majority of the population earn their livelihood from crop production followed by livestock rearing. The major off-farm employment in the area is trading. As quoted by researcher, enset is considered as ‘’The Bank of Farmers.’’
The study area has a unique farming pattern that creates a beautiful landscape and vegetation cover. It has a unique farming pattern dividing the farmland into Front yard, House yard, garden area-enset field (Darincha), Daruka, Shoka (out-field), grass land (mata gadiya), wood lot (mita gadiya) (Figure 2).

Study site selection criteria
The site was selected as follows: The potential area for growing enset, which uses it as a staple and co-staple food. The presence of dominant clones- six clones selected for the study. The clones are named locally as Argama, Arkiya, Dokuwa, Hadha, Maziya and Sirgiya. Presence of three age groups of enset such as young, medium aged and matured once in the same field.
Experimental design and layout
A total of five plots were delineated and quadrant system was used. The plots are taken from Fate, Woshi Gale, Shasha Gale, Kokate and Gurmo Koysha named as plot A, B, C, D and E, respectively. The size of quadrant was 10m by 10m. Within the quadrant 2m by 2m nested plot was taken to measure the amount of necromass. All layers based on their ages were considered. The plot for destructive measurement was obtained by procuring all enset plant within a quadrant. All leaf, pseudo-stem, root and corm of each age group were considered to estimate CF and from similar age group composite samples were taken (Figure 3).

Measurement of population, height and diameter of enset
The clone varieties based on their age were identified. The population of each clone was recorded by counting the plant in each farm plot. Height and DBH for each age group in each variety were measured by using meter tape and stick. Only, the height up to branched part where the concentric stem ends, and the leaf sheathes start were measured. The age, height of pseudo-stem and DBH were recorded together in one for each type of clone on the basis of their age group.
Estimating farm level enset diversity and evenness This was calculated by using Shannon index (Brower et al. 1998) as [Eq. 3.1].
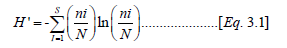
Where n is the number of individuals in the system (or sample) belonging to the ith species, N is the number of observations, S is number of species and ln, in other words, eH’ is the type of weighed number of species present in the sample.
To measure evenness, H’ and H’max were considered as given in [Eq. 3.2]:
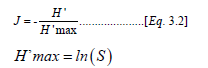
Where J’, H’ and H’max, and S represent species evenness, diversity, maximum possible diversity, and number of species in a given sample
Soil sampling and soil analyses
Soil sampling procedure, sample collection and preparation
To determine SOC, about 15 disturbed composite samples (3 times in each of five plots) were taken by considering their respective depth. The soil depths were divided into three (4- 15cm, 16-27cm, and (28-40cm) and then soils from similar depth of three points of that specific plot were mixed. Coarse fragment was determined by using sieving system (Mehedi, Girouard and Samson, 1998).
Soil lab analyses
The soil organic carbon was determined according to Wakley & Black (1934) methods. Bulk density was determined by using undisturbed soil samples after drying it in an oven for 72 hours at 105ºc (Landon, 1991).
Enset sampling procedures, sample preparation and analysis
Based on the selection criteria, three composite samples from four plant parts, namely leaf, stem corm and root in each age group were collected in a baggage. A total of 12 composite enset samples from plant parts were collected for carbon fraction analysis. Dry ashing method was used to determine the carbon fraction of enset samples according to the Ethiopia Agricultural Research Organization Manual by Sahlemedin & Taye (2000). Analysis was done following Wakely & Black (1934) method, similar with soil carbon analysis.
Total biomass estimation
Above ground biomass
The above ground biomass of each enset plant was determined by using a regression model as described by Arfin (2001), Van Noordwijk [12] and Zemak [13] in [Eq. 3.3].
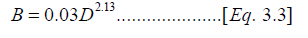
Where D is the diameter at breast height (or at 1.3cm) and B is biomass of an enset plant in one specific age group. The aboveground biomass of all age groups in each quadrant worked out as:
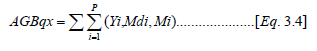
Where is the above ground biomass in a quadrant (qx), P is number of plants in a given specific age group, and Yi, Mdi and Mi Biomass of age groups for young, medium and matured in a quadrant respectively.
The average AGB was calculated using [Eq. 3.5]:
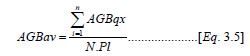
Where AGBav is the average above ground biomass in all quadrants, AGBqx is aboveground biomass of a plot qx., n is the plot number n, and N.Pl represents number of plots.
Below ground biomass
The belowground biomass on each plant estimated from the aboveground biomass by using default value of 0.26. An average root to shoot ratio of 0.26 (0.18-0.30) showed no significant variation with regard to latitude zone, soil texture or tree height (Brown 2002) [Eq. 3.6]
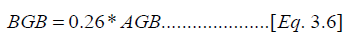
Where BGB = below ground biomass in kg/ha of each enset in a quadrant, AGB is above ground biomass in kg/ha of each enset in a quadrant.
The belowground biomass of each age group in a quadrant was estimated and the total belowground biomass in each quadrant was calculated as [Eq. 3.7].
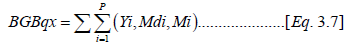
Where BGBqx, is the belowground biomass in a quadrant qx; and Yi, Mdi, and M, young, medium and mature enset age group, respectively.
Necromass
The necromass was collected in a baggage and weighed in kg in dry matter basis. The necromass of the nest was multiplying by area of large quadrant to assume the amount of necromass per a quadrant.
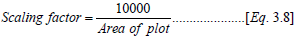
Scaling factor and total biomass
In each plot aboveground biomass, belowground, and necromass were summed up to get total biomass of the plot. By using plot scaling factor, the total biomass of the plot was changed into hectare as [Eq. 3.8]:
Total carbon stocks determination
Above ground carbon stock
This step involves the estimation of carbon stored in leaf and stem of the specific age group from different samples and then multiplied this by the above ground biomass of that age group after carbon fraction would be determined in the laboratory as (Eq. 3.9):

Where AGBi and AGCs represent the aboveground biomass and aboveground carbon stock in a specific quadrant of a give plot; CFst and CFl are sum of the carbon fraction of the stem and leaf in all of the three age groups; Csty, Cstmd and Cstm are carbon fraction in the stem of a young, medium age and matured age groups of enset; and Cly , Clmd and Clm are carbon fraction in leaf of young, medium and mature age group of enset plant in a quadrant of a specific farm, respectively.
Ground carbon stock
The soil below 3cm from the surface was excavated and the root dug out from each age group of the plant and mixed up. The corm and root part were separated. Both corm and roots were brought to the laboratory and washed to determine the carbon fraction. Representative sample from each variety were taken based on their age group. Then, [Eq. 3.10] were used to estimate the belowground carbon stock

Where AGBi is below ground biomass in a specific plot, AGCs is below ground carbon stock; Cy, Cmd and Cm are carbon fraction in corm of young, medium and matured enset plants; CFc represents carbon fraction in corm of all three age groups; CFr represents carbon fraction in roots of all three age groups; and Cry, Crmd, Crm are carbon fraction in roots of young, medium and matured enset plants, respectively.
Total organic carbon in necromass
The carbon stored in necromasses were estimated using the default conversion factor used in IPCC [Eq. 3.11]

Where NCs represents total carbon stock in necromass (kg/ ha) and N represents averaged total necromass (kg/ha).
Soils carbon stock
Soil carbon stock in each plot was estimated following [Eq. 3.12]

Where SCs=Soil carbon stock (kg/ha), m=mass of the soil, SOC= soil organic carbon (%) and Cfr=coarse fragment (%).
Total carbon stock in enset plantation
The total carbon stock of enset enset plantation was determined by summing up all aboveground carbon stock, belowground carbon stock, and necromass and soil carbon stock in each plot as [Eq. 3.13].

Carbon sequestration potential of enset
Estimation of total carbon sequestered
The total carbon sequestration in enset plant was estimated by using the total aboveground and belowground carbon stock which was obtained from the living biomass of the plant in each plot (Eq. 3.14).
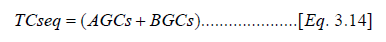
Where, TCseq. represents the total carbon sequestration in enset plant in a specific plot.
By using common expansion factor, it was changed to CO2-e by using a ratio of molecular weight of CO2 to carbon (REDD, 2009).
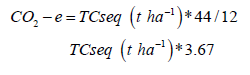
Where CO2-e represents carbon dioxide equivalent. Carbon trading
The range of carbon credit values is wide – from US$1-38 per ton of carbon, though the most common values are in the $2.50- 5.00 range [14]. One tone CO2 costs 4.5 dollar according to the rate the World Bank in CDM (clean development mechanism) projects for carbon trading use and hence, this was the value was used to calculate the costs in this research. Finally, the total carbon was changed to dollar per carbon equivalent with which the role of enset in CDM was accessed.
Statistical analysis
The data was prepared and analyzed with the program Excel 2007. SPSS16 and GMP5 statistical software were used to analyse (ANOVA). Besides, descriptive summary and correlation were also performed using the software.
Results and Discussion
Farm level enset plantation characteristics Age structure and population
About 249 enset plants were included and the lowest and highest age recorded among all the farmlands were 1 and 8 (YAP). As Bush (1996) the number of mature enset were greatly declined since the great famine of 1984. In all sample plots, the height, DBH and biomass of enset increase with increasing age and age groups, while the number of plants in higher age, especially more than six, decreasing (99, 83 and 67, respectively) (Table 1).

The height of plant was significantly different among the age groups within each plots and farm types at alpha 0.05.
The highest variability in height within young, medium and matured age group among five plots is observed in plot C (2.43+1.23), plot E (26+0.42) and plot E (3.67+0.31) and the lowest was observed in plot D (2.30+0.45), plot A (3.18+0.17) and plot C (2.90+0.17), and plot A (3.53+0.12) and B (3.37+0.12) respectively. But this trend is different in DBH that in plot A, plot C and plot E the variability in DBH within young, medium and matured age group is the highest and in plot D, plot D and plot A it was lowest among the five measured plots, respectively (Table 1).
On the other side, there was direct or positive relationship between age, height of pseudo-stem and DBH and hence above and belowground biomass in enset plants (Table 2).

Farm level enset clone diversity and evenness
The diversity index ranges from 1.37 in plot D up to 1.73 in plot E. In other words, the highest and lowest diversity of plants were observed in plot E and plot D, which were 1.73 and 1.37 while the richness is equal. The clones’ evenness, on the other hand, is relatively higher in plot E, which was 0.963 approaching to 1 i.e. perfect even distribution and lower in plot C, which was 0.70.
Farm level biomass production
Farm level aboveground biomass
The mean value of aboveground biomass for all ages in plot A, B, C, D, and E were 143, 64.57, 46.44, 83.51 and 93.35, respectively.
The highest and lowest amount of aboveground biomass in young, medium and mature age group of enset plantation throughout the five plots were 130.7 in plot B and 36.8 t ha-1 in plot C; 173.2 in plot A and 144. 3t ha-1 in plot B; and 270.8 in plot A and 105.9t ha-1 in plot B, respectively. The highest and lowest value of farm level AGB were recorded in plot A (497.7t ha-1) and plot B (380.9t ha-1), respectively. This huge difference in farm level AGB was observed because not the number of plants but the number of mature enset plants in plot A than plot B (Figure 4).

The AGB increases along with the plant age. Besides, the correlation coefficient of age level AGB is 0.93 at 95% confidence interval which means age group and biomass were highly positively correlated. The decreased biomass of mature enset in plot B was because of very fewer number of enset plants (Figure 4). On the other side, the variation in the farm level biomass was significant at P value of 0.05.
With regard to the clone variety and their contribution to the aboveground and belowground biomass in each plot, from six clones, Maziya clone types in plot A, plot B and plot D, Arkiya clone type in plot C, and Sirgiya clone type in plot E contributed the highest above and belowground biomasses. On the other hand, the Argama clone type in plot B, plot C and plot E and Sirgiya clone type in plot D contributed the lowest biomass value in their respective plots. However, the single clone type, which contributed to about 43.8% of the total biomass of the plot, was the Arkiya clone types found in plot C. But a single clone, which contributed only about 0.43% to the total biomass in the plot, was Argama clones found in plot B.
Farm level belowground biomass

The highest and lowest farm level total biomass were obtained from plot A (129413.20kg ha-1) and plot B (99048.04kg ha-1), respectively. On other side, the correlation between age and BGB was significantly positive (about 0.73) at alpha 0.01. From all 99 young plants of 249, the contribution to total belowground biomass was only 16.26% and 83 medium plants was 37.57%; but only 67 mature plants from 249 contributed 46.17% to the total belowground biomass. The averaged BGB for the five plots was 106.10t ha-1 (Figure 5).
The variation in the value of biomass throughout sample plots and clone varieties was related with: Land management effect such as cropping pattern, plant density, amount and type of organic manure used; the distribution and preference of farmers to the specific clone types; farmers frequently use some varieties for feeding purpose, especially for Amicho, over the others and they tend to keep others for some other purposes and hence, they plant the varieties based on these purposes and preference. Also, the clones by themselves were different according to their sensitivity to diseases, edaphic and climatic factors.
Necromass
The highest necromass was recorded in Gurmo koysha (plot E) which was 5575kg ha-1and lowest was in Whoshi Gale (plot C) which was 2875kg ha-1. This difference in necromass was due to pruning activity. This is in conformity with the report made by Admasu (2007) that in a densely populated dry area where forage supply is most limited, leaf pruning to the point of complete defoliation of the plant is practiced. Since enset leaf is the main photosynthetic organ for biomass production, severe leaf pruning could affect biomass production in enset plantation. The average necromass throughout five plots was 4.44t ha-1.
Total biomass in the enset plantation
The biomass production capacity of enset plants could be assumed by using the average of plot level total biomass, which was about 518.60t ha-1. Hence, enset plant has high biomass production capacity [15].
Total carbon stock in enset plantation
The organic carbon fraction in the enset body part among the three age groups was likely increased along with increasing age group. It might be because of the true stem in enset plant grows at age of maturity that matured enset plant shows deviation in fresh weight and carbon fraction relative to young and medium age groups. The highest carbon fraction is seen in root while the lowest is seen in pseudo-sterm in enset plant (Table 3).

Total organic carbon in the AGB
The averaged organic carbon in enset plantation was 30.20t ha-1C, which was one of high carbon storing perennials. The above-ground biomass of pasture and crops, plantation forests store between 2, 20 and 250t of carbon per hectare (http:// www. licor.com/sequestration). When we compare with this, enset plant could have higher Carbon in AGB than pasture plants and crops and lower carbon in AGB than plantation forest.
Total organic carbon in BGB
The total organic carbon in BGB was about 9.12t ha-1 C. Enset has much greater carbon in the below ground biomass production (9.12t ha-1) than banana, which can sequester about 4.81ton ha-1 [13], since it is more herbaceous, having a higher size, and hence a higher DBH and height. It is also obvious that longer, fibrous roots and shoot to root ratio is lower in enset than banana plant [15].
Total organic carbon in soil
The mean value of coarse fragment, bulk density, soil organic carbon and soil carbon stock of five measured plots was 0.20 ± 0.185, 0.94 ± 0.055, 1.42±0.215, and 249.2±88.71, respectively. The data are not in agreement with the report by Asnakech & Linden [16]. This is mainly due to great reduction on SOM and organic carbon through time in the study site. Therefore, the soil carbon stock in enset field of the study area is probably decreasing than before.
The highest and lowest carbon stock in the soil were stored in plot A (Fate) which was 33734kg/ha and plot C (Woshi Gale) which was 14930kg/ ha, respectively. This difference is related with soil and plantation management difference throughout farm plots in addition to edaphic and other factors. As practically known, for instance, crop residues, and animal manure application is high in plot A as C. This is related with the household income level and presence and absence, and number of cattle. The more income the household has the higher number of cattle and hence the more well managed enset plantation. When house holds’ income and size of farmland is higher, the use of enset field for other crops is very rare case, or not at all (Figure 6).

The averaged total carbon stock for all the farm plots was 24.92t ha-1. Therefore, at present day enset farmland could minimally help sequestering about 24.92t/ha organic carbon (Figure 6).
Total organic carbon in necromass
The averaged total carbon stock stored in the necromass of under enset plantation was about 2.223t ha-1. This value was even much greater than the mixed trees and banana plantation [13]. The organic carbon stored in the coarse litter was 0.77 and 1.25t ha-1 for the sampled banana, mixed fruit trees in dry matter basis, respectively.
Total organic carbon stock
The present carbon stock in enset plantation in Mt. Damota watershed was about 66.46t ha-1 in DM basis (Table 4). This figure is promising that enset based agriculture really can be included in the list plant species which have role in CDM, in addition to the plant being environmental buffer-stock. FAO (2001) reported that while a ton of carbon per hectare in crop land is relatively small comparing to forests, the overall potential for cost effective climate mitigation is quite large.

Carbon sequestration potential of enset plantation
Averaged aboveground, belowground, and total carbon sequestred in enset plantation among the five measured plots were 30.2, 9.12 and 39.32t ha-1 respectively. Thus, live enset plant can sequester about 144.30 t CO2-eq /ha.
Enset role in carbon sequestration and climate change mitigation
Enset plantation can sequester totally about 243.91t ha-1 CO2 in its above and belowground biomass, soil and necromass. According to the World Bank CDM project, enset plantation in Mt. Damota watershed could cost about 1097.60 $ per t CO2- eq. in carbon trade market. This show that enset plantation can be considered as one of active-role playing agriculture in CDM. Hence, being one of perennial plant in Ethiopia, enset has a high biomass production and carbon stock, which reflects that it can play a significant role in climate change mitigation [17-21].
Conclusion and Recommendation
a) This study identified six dominant clones of enset in the area locally named as Argama, Arkiya, Dokuwa, Hadha, Maziya and Sirgiya. The distribution of clones, DBH and biomass significantly varies from one plot to another. The height, DBH and biomass of enset increase along with increasing age and age groups.
b) The total biomass production in enset plantation is reasonably high.
c) The CF in body of enset plant is low and it increases with increasing age group. But the total carbon stock of enset plantation is very high.
d) The carbon sequestration potential of enset is promising.
e) Enset plantation can help mitigating climate change plus serving an alternative income source for enset growing community provided that:
i. Using it discriminately, reducing overuse, maintaining diversity via micro propagation, harvesting wisely at stage of maturity and increasing productivity of enset plantation.
ii. Avoiding cultural practice like leaf pruning and being careful when transplanting.
iii. Further research with better method for analyzing the carbon sequestration potential of enset species at different watershed including more diverse clones is needed.
references
- FAO (2006) World Agriculture toward 2015/22030. Chapter 13. Rome. Earthscan.
- Smith P, Martino D, Cai Z, Gwary D, Janzen H, et al. (2007)Agriculture. In: Metz,
- Niggli U, Fließbach A, Hepperly P,Scialabba N (2009) Low Greenhouse Gas Agriculture: Mitigation and Adaptation Potential of Sustainable Farming Systems. FAO, April 2009, Rev. 2.
- Willler H,Kilcher L(Eds.) (2009) The World of Organic Agriculture. Statistics and Emerging Trends 2009. IFOAM, DE-Bonn and FiBL, CH-Frick.
- Westphal E(1975) Agricultural System in Ethiopia, Centre for Agricultural Publishing and Documentation, Wageningen, p. 14.
- Gascon (1994) Le miracle de l’ensät. Géographied’uneplantepeuplante.In:BarhuZewde et al. (Eds.). Proceedings of the 11th International Conference of Ethiopian Studies 1-6 April 1991, Institute of Ethiopian Studies, Addis Ababa, pp. 81-99.
- Brandt SA, Anita S, Clifton H, Terrence MCJ, Endale T, et al. (1997) The “Tree Against Hunger”: Enset Based Agricultural Systems in Ethiopia. American Association for the Advancement of Science, Washington, DC, USA, p. 56.
- TsegayeA (2002) On Indigenous Production, Genetic Diversity and Crop Ecology of Enset (EnseteVentricosum (Welw.) Cheesman.Ph.D.Thesis,Wageningen University, Wageningen, the Netherlands.
- Jansson C, Wullschleger SD, Kalluri UC, TuskanGA (2010) Phytosequestration. Carbon Biosequestration by Plants and the Prospects of Genetic Engineering.
- Tenaye A, Geta E (2010) Analysis of Vulnerability and Determinants of Enset Production in Wolayta, Southern Ethiopia.
- Garedew G (2008) Mountain Environmental Changes and Emerging Indicator of Unsustainability- The Case of Mount DamotaWolayta Zone, SNNPR.
- Noordwijk M, Mulia R (2002) Functional Branch Analysis as Tool for Fractal Scaling Above and Belowground Trees for their Additive and Non-additive Properties. Ecological Modelling 149:41-51.
- ZemekOJ (2009) Biomass and Carbon Stocks Inventory of Perennial Vegetation in the Chieng Khoi Watershed, Nw Viet Nam.
- FAO (2001) Soil Carbon Sequestration for Improved Land Management.
- Birmeta Genet (2004) Genetic Variability and Biotechnological Studies for the Conservation and Improvement of EnseteVentricosum. Doctoral Thesis ISSN 1401- 6249, ISBN 91-576-6781-0.
- WoldetensayeA, Linden B (1993) Cultivation and Utilization of EnseteVentricosumin Ethiopian Region of Ethiopia; Swdish University of Agriculture.
- Tessema A (2008) The Livelihood Adaptation, Risk and Vulnarablity in Rural Wolayta; a Phd Dissertation, Norway.
- EliasE (2003) Environmental Roles of Agriculture in Ethiopia-Module 2; Summary Version Received September 17, 2003.
- IPCC (2001) Climate Change 2001: Impacts, Adaptation, and Vulnerability: Contribution of Working Group II to the Third Assessment Report of the Intergovernmental Panel on Climate Change, Cambridge University Press.
- Davidson OR, Bosch PR, Dave R, Meyer LA (Eds.), Climate change 2007: Mitigation. Contribution of Working Group III to the Fourth Assessment Report of the Intergovernmental Panel on Climate Change. Cambridge University Press, Cambridge, UK and New York, NY, USA.
- http://www.Licor.Com/Sequestration: CO2Sequestration.


