


Modelling and Validation of the Precipitable Water Vapour from Zenith Wet Delay using Radiosonde and GNSS Data in the Central Arabian Peninsula
Maghrabi AH1*, Alothman AOA2, Fernandes RMS3, Almutairi MM1, Aldosari AF1, Aldakhil AA4, Allehyani BI4, Aljarbar GA4 and Altilasi MI1
1National Centre for Applied Physics, King Abdulaziz City For Science and Technology, Saudi Arabia
2 National Center for Geodesy & Navigation Technology, King Abdulaziz City for Science and Technology, KSA
3Instituto D. Luiz, Universidade da Beira Interior, Portugal
4 Prince Nora University, Saudi Arabia
Submission: May 25, 2020; Published: June 08, 2020
*Corresponding author: Maghrabi AH, National Centre for Applied Physics, King Abdulaziz City For Science and Technology, P.O. Box 6086, Riyadh 11442, Saudi Arabia
How to cite this article: Maghrabi A, Alothman A, Fernandes R, Almutairi M, Aldosari A, et al.Modelling and Validation of the Precipitable Water Vapour from Zenith Wet Delay using Radiosonde and GNSS Data in the Central Arabian Peninsula. Int J Environ Sci Nat Res. 2020; 25(1): 556152. DOI: 10.19080/IJESNR.2020.25.556152
Abstract
In this study, radiosonde observations for the period 1985 to 2016 from four sites in Saudi Arabia (Riyadh, Abha, Hail, and Dammam) were used to calculate the Zenith Wet Delay (ZWD) and Precipitable Water Vapour (PWV). Using the Asken & Nordius [1] approach (PWV =1/k ZWD), correlation analyses between these two variables (in mm) were carried out using data from1986-2012 for each site individually and for the combined data from all sites. The values of the conversion constant between the two variables were determined and found to lie between 0.171 and 0.178. The site-specific model and the regional developed model were used to predict the PWV values for the period between 2013 and 2016 and for the entire study period (1986 to 2016). The predictability of these models against the three datasets was excellent. The mean bias error (MBE) and root mean square error (RMSE) for the three datasets were, respectively, between 0.02mm and 0.53mm and between 1.51mm and 3.71mm.
Zenith Total Delay (ZTD) and ZWD from the GNSS receiver installed at the Geodetic Solar Village (SOLA) site for the period between2004 and 2016 were used to calculate the PWV during this period to validate the accuracies of the proposed models. Three models, dependent upon the k value, were used to obtain the PWV values. These were the regional k value (0.178), the Riyadh site k value (0.172), and the global k value (0.15). Additionally, three locally developed models to calculate the weighted mean temperatures(Tm) from the surface temperature as well as eight models previously developed by different investigators were used to calculate the PWV values. The calculated PWV values were validated against the radiosonde-derived PWV for this period of time. For all the considered models, the MBE values were less than 2mm, and the RMSE values were between 1 and 4mm.
Keywords: GPS applications; Saudi Arabia; ZWD; PWV; weighted temperature
Introduction
Atmospheric Water Vapour is one of the most important and abundant greenhouse gases. Precipitable Water Vapour is an actual measure of the total moisture in the atmosphere. Knowledge of the water vapour distribution and variability is very important for several atmospheric applications, as well as meteorological and climate studies. Water vapour has a considerable impact on radiation transfer in the atmosphere by absorbing and attenuating electromagnetic radiation, as well by influencing the environment [2-4]. Despite its importance, water vapour is difficult to measure or quantify due to its variability, both spatially and temporally [5-7].
The number of measurement techniques used for observations of PWV increased considerably in the 1990s [8-11]. A summary of these techniques and a discussion of their advantages, disadvantages, and limitations are given in Maghrabi & Clay [12] and references there in. However, with advances in satellite technology, Global Navigation Satellite System (GNSS) observations has become are liable, accurate, high resolution, low cost source of global PWV measurements [13-19].
The atmosphere delays GNSS signals as they pass through. This delay is either dry, known as the Zenith Hydrostatic Delay (ZHD), or wet, termed the Zenith Wet Delay (ZWD). The total delay is due to the sum of these two components; namely the Zenith Total Delay (ZTD). The ZHD can be calculated accurately based on the ground level temperature and pressure [20-22]. On the other hand, ZTD can be obtained from processing the GNSS signals using state-of-art processing software (e.g., GIPSY-OASIS, Bernese, Gamit). Thus, by subtracting the ZHD from the ZTD, the ZWD component can be obtained. By knowing the ZWD and by employing a specific type of transformation, the PWV can be retrieved [1,23-26].
The aim of this work was to provide a model to calculate the PWV from the ZWD that could be used for several applications without using the surface meteorological variables. To achieve this, radiosonde data for the period between 1986 and 2016 from four sites in Saudi Arabia, were used to calculate the ZWD and PWV. These sites were Riyadh, Hail, Dammam, and Abha (Figure 1). Correlation analyses between these two variables were carried out for each site and for the combined data to model the PWV from the ZWD measurements; several models are proposed. A regionally developed model is also proposed to calculate the weighted temperature from the surface temperature. The GNSS data from the SOLA site (located in Riyadh) for the period 2004- 2016 were used to validate the proposed models. Moreover, eight previously proposed models to calculate the weighted mean temperature were used to calculate the PWV values for this data set.

The experimental data and the methodologies are discussed in section 2. In section 3, the results are presented. Conclusions are presented in section 4.
Experimental Site, Data Sources and Methods
Experimental data
Radiosonde observations from the record of the Saudi Presidency of Meteorology and Environment (PME) for four sites in Saudi Arabia during the period from1985 to 2016 were used for the purposes of the current study. The selected sites were Riyadh, Abha, Hail, and Dammam. These sites were chosen because they had the longest series of observations, which are relatively homogeneous and cover a broad range of climatic and atmospheric conditions experienced in the region (Figure 1).
The available data were subjected to several quality control procedures. These include the elimination of the whole atmospheric profile if several observations of the required variables are missing. Radiosonde observations less than 5km were excluded from the analysis. Linear interpolation procedures were carried out to replace up to five missing profiles to complete the series. These interpolations were kept at a reasonable level in order to preserve the nature of the information contained in the data.
Analysis methods
According to Askne & Nordius [1], the relationship between the PWV and the ZWD can be formulated as:
Where k is the proportionality coefficient, which can be expressed according to Bevis et al. [27] as:
where ρ is the density of liquid water, Rv (461.518J/kg K) is the specific gas constant for water vapour, k3 = (3.776±0.004)105 K2mbar-1, k2 = (17±10)Kmbar-1, and Tm is the mean weighted temperature of the water vapour in the atmosphere (K). The value of k is about 0.15 globally; however, this value can vary by up to 20% due to variations in Tm [22,27]. Characteristically, the value of k used in Eq. (1) can be obtained through several methods [19,20,28,29]: (a) assuming the constant value of 0.15; (b) using Eq. (2); or (c) determining it experimentally for a specific site or region, as described below.
Using radiosonde data, the ZWD can be calculated using the following formula [30,31]:
In this equation, Nw is the wet atmospheric refractivity between layer i and i+1, ΔH is the height difference between the two layers, and n is the number of layers available for a certain profile. For a certain layer, Nw can be obtained from:
Where e is the atmospheric water vapour pressure and Zw is the inverse of the compressibility (≈ 1) and formulated as:

Where Tc is the temperature in Celsius.
Using equation (6), the Precipitable Water Vapour (PWV) content for each radiosonde profile can be calculated as [32]:
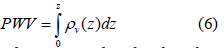
Where v ρ is the absolute humidity at sounding level z and it is obtained from the equation of the state of an ideal gas as:
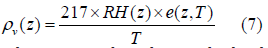
Where T is the observed absolute temperature, RH(z) is the relative humidity, and e(z, T) is the saturation water vapour pressure in mbar.
For each available radiosonde profile, the required meteorological variables were extracted and the ZWD was calculated (using equations 3-5) for each atmospheric layer and integrated from the surface up to 300mbar. The 300mbar data limit is due to the poor performance of the radiosonde humidity sensors in cold temperatures (Zhai and Eskrideg 1996; Kassomenos and McGregor 2006) [7]. Finally, the radiosonde derived PWV was obtained using equation (6).
Table 1 gives the mean values of meteorological variables, the number of radiosonde profiles, and the calculated values of the PWV and the ZWD for each site individually and for all the combined data.

The data were divided into two groups, namely the modelling and validation groups. The modelling dataset (set 1) covers the period between 1985 and 2016, whereas the validation dataset (set 2) covers the period between 2013 and2016, where independent estimatives obtained from GNSS observations were available. The combined data for the entire period of study is called set 3.
Statistical indicators
The statistical indicators used here were the mean bias error (MBE) and the root mean square error (RMSE). Their functional forms are given as follows:
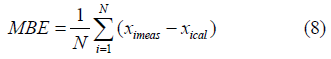
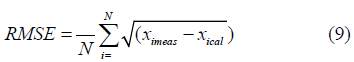
Where ximeas is the ith measured value, xcal is the ith predicted value, and N is the total number of observations. Furthermore, a t-statistic Student’s test was used to test the significance of the proposed regressions. According to Stone [33], the t-value can be calculated as follows:
Additionally, the relationship between the predicted and measured data was examined using linear regression analysis, as represented by equation (11):
For better prediction by the proposed models, the MBE and RMSE values need be as small as possible, the t-value must be less than the critical value, the correlation coefficient r must be close to 1, intercept (b) close to zero, and the best-fit slope (a) must be close to 1.
Results and Discussion
Relationship between radiosonde-derived PWV and ZWD
Figure 2 shows the variations in mean PWV and ZWD values from all stations during the considered period. It is clearly evident that both variables exhibited seasonal variation with a maximum reached in summer months and minimum in winter months. During this period, the PWV showed a minimum value of about 2mm in January of 1987 and February 2008. The highest PWV (34.7mm) was recorded in May 1988, followed by September 2013 (34mm) and August 2003, when it reached a value of 32mm. ZWD attained a maximum value of 0.2m in September 1986 and May 1987. The minimum ZWD of 0.01m was reached in January 1987 and February 2008.

The relationships between the calculated PWV and the ZWD for each site for the period between 1986 and 2012 are depicted in Figure 3.While there is spread in the data, Figure 3 shows that the PWV was correlated with the ZWD, with different degrees of dependence.
Regression analyses between the two variables for this period of time were carried out and the constant (k) values of equation (1) were obtained for each site individually and for the combined data from all sites. Moreover, the predictability of the site-developed model was tested against the independent data set (covering the period 2013-2016) and against data for the whole period (1985- 2016) for the corresponding site. The results of these regression analyses are presented in Table 2
The regression equation between the combined PWV and the ZWD data from all the considered sites (regional model) for the period between 1985 and 2012 was:
This equation has a correlation coefficient of 0.94, MBE of 0.017mm, and RMSE of 1.55mm. Using the validation dataset, the MBE and RMSE values for this model were -0.61mm and 1.34mm respectively. The RMSE and MBE values of this model, when is tested against the measured PWV data for each site individually for the whole period of the study (1985-2016),are given in the last column of the Table 2. It can be seen that the obtained MBE values between the prediction of equation (12) and the measured PWV values were less than 1mm. The model underestimated the measured data by 0.081mm, 0.002mm, and -0.28mm for Riyadh, Hail, and Dammam respectively. The model presented RMSE values of 2.09mm, 1.52mm, 1.51mm, and 3.92mm for Abha, Riyadh, Hail, and Dammam, respectively.
The value of the constant k was about 0.177 for both Abha and Hail, with correlation coefficients between the PWV and the ZWD of0.93 and 0.94, respectively. For the Riyadh site, it was 0.175 with a correlation coefficient of 0.96. This value was 0.171 with a correlation coefficient of 0.88 for the Dammam site.
The site-specific developed model, when tested against the measured data from the modelling data (third column), independent data (fourth column), and the data combined from all the sites (fifth column), presented MBE values less than 1mm all cases. However, the RMSE values were different from one dataset to another. For the dataset covering the whole period of the study (1986-2016), all the site-specific models showed RMSE values less than 2mm, in which the Hail model had the highest value (1.76mm) and Riyadh model had the lowest value (1.51mm). For the other two datasets, i.e. 1986 to 2012 and 2013 to 2016, the Dammam developed model presented the highest RMSE values of 3.71mm for the former dataset and 3.1mm for the latter. This may be due to the considerable variations in atmospheric conditions in Dammam and due to its proximity to the sea. The Abha specific model presented the second highest RMSE values when it was used to predict the PWV for these two datasets. The Riyadh and Hail models had RMSE values of 1.54mm and 1.78mm, respectively, when they were used to predict the PWV for all data between 1986 and 2012. For the second dataset (2013-2016), the RMSE values were 0.83mm and 0.81mm, respectively, when the Riyadh and Hail specific models were used.


Figure 4 indicates the measured PWV data plotted against the predicted PWV values using the regional model (equation 12) and the site-specific model for the independent dataset (2013-2016) for each site. It can be clearly seen that most of the data points lie far from the 1:1 line, but the majority of them are distributed around it.

Regression analyses between the measured and the predicted PWV values, for all panels in Figure 4, showed slope values from 1 for Abha, Hail, and Riyadh to 0.93 for the Dammam site and the combined data from all sites. The intercepts of these regression lines were 0.004mm for Riyadh, 0.08mm for Hail, 0.28mm for Abha, 1.7mm for Dammam, and 1.25mm for the combined data from all sites. Apart from the Dammam site (correlation coefficient 0.91), the correlation coefficients for all the cases ranged between 0.94 and 0.99. Additionally, Student’s t-tests at a confidence level of 95% showed that the developed models were statistically significant for (n-1) degrees of freedom.
The values of the k constant obtained in this study are within the range previously reported by several investigators. Liu et al. [34] found that the values of the k constant ranged between 0.17 and 0.182 for different Chinese regions. Singh (2015), when studying the relationship between the ZWD and the PWV in the Indian region, reported k constant values between 0.166 and 0.162. However, these values are slightly higher than the typical value reported for American stations (about 0.15) [20,27]. Variations in the k value are attributed to several factors, such as the season and the latitude of the site [23,30,32].
Regional model to obtain the weighted mean temperature (Tm) for PWV estimations
Several investigators have found that accurate determination of the PWV depends on the accuracy of estimating the k value which, as a consequence, depends upon variations in the atmospheric weighted temperature [13]. Knowledge of the weighted temperature is of a great importance for PWV estimations from ground-based GNSS receivers [23,29,30,35]. Weighted temperature determinations require detailed information on the upper air regarding both temperature and water, which is usually unavailable and difficult to obtain. Instead, several empirical models have been developed to calculate the weighted temperature from easy-to-measure meteorological data such as surface temperature, pressure, and humidity (Yanxin et al. 2013; Sapucci 2014) [13,22,23]. The most commonly used and easy to use method to determine the weighted temperature is the Bevis method. This method is based on the linear correlation between the weighted temperature and surface temperature (Ts).
The weighted mean temperature of the atmosphere can be expressed as:
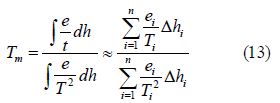
Where ei and Ti are the water vapour pressure (in mbar) and the atmospheric temperature (in K), respectively, at height hi [29- 31].
In this section, using the available radiosonde profiles from the selected sites for the period between 1986 and 2016, the weighted temperature (Tm) was calculated for each atmospheric layer and integrated from the surface up to 300mbar [29]. Regression analyses between the calculated Tm and the Ts from all sites were conducted, as shown in Figure 5.

The regression equation for this plot was:
The correlation coefficient, MBE and RMSE were 0.86, -0.01 K, and 4.32 K, respectively.The calculated Tm will be used in the calculations of the PWV discussed in the following section
PWV estimation from GNSS observations
In 2004, King Abdulaziz City for Science and Technology (KACST) established a GNSS network for geodetic and geophysical applications to contribute to the International GNSS Service (IGS). In this study, we use the data from covering the period between 2004 and 2016.
The ZTD values for this station were directly obtained from the analysis of the GNSS data using the GIPSY/OASIS software package [24]. GIPSY/OASIS processes the daily files for each station individually using a strategy called PPP – Precise Point Positioning [36]. Satellite orbit and clock parameters are provided by the Jet Propulsion Laboratory (JPL) and kept fixed in order to estimate the ZTD and other parameters of interest (in particular the daily positions) simultaneously. One estimate for ZTD was obtained every 5 minutes. In order to remove the jumps at 00h00 UTC (since each daily file is computed separately), we used a methodology developed at SEGAL that computes the ZTD values using files with 30h (from 21h00 from day before to 03h00 of the following day) and uses a transference function to remove these jumbs [37].
The ZWD for each estimate was obtained by subtracting the hydrostatic part (ZHD) from the ZTD [25,38]:

Where ZHD is almost constant over time and it was modelled in the GPS processing using the Vienna Mapping Function [39].
Radiosonde observations for the considered period (2004- 2016) were used to calculate the PWV, and these values were considered as the reference for further comparisons. The ZWD values used in this section are those calculated by the software (equation 15). Using equation (1), the PWV was calculated using six different approaches. Three of them were based on using the value of the transforming constant (k) between the PWV and the ZWD. The remaining three approaches were based on using the mean weighted temperature in calculating the value of the constant k. The methods are:
a) The regional k value (0.178) developed in this study.
b) The Riyadh-specific k value (0.175) developed here.
c) Assuming a value of 0.15 for the k constant as adopted by several investigators [25,27].
d) Calculating the k constant (equation 2) using the mean weighted temperature (Tm), calculated from radiosonde observations using equation (13); namely the measured Tm
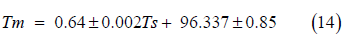
.e) Calculating the k constant (equation 2) using Tm obtained from equation (14).
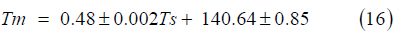
f) Calculating the k constant (equation 2) using Tm calculated using the Riyadh-specific temperature model [29]:
The mean values of the radiosonde-derived PWV and the PWV values calculated using the six methods as well as the GPS-derived ZTD and ZWD are given in Table 3. It can be seen that the PWV obtained using the global and site-specific k values presented the highest PWV, whereas the site-specific Tm model provided the minimum value. The radiosonde-derived mean PWV for this data set was almost same as the mean for the entire period (Table 1). The software-derived mean ZWD value was almost the same as that calculated using equation (3).

The least square fits between the measured and the predicted PWV values using the six approaches were assessed; the results are depicted in Figure 6. The MBE and RMSE values of these analyses are presented in the last two columns of Table 3. It is clear that all the models predicted the measured data with good accuracy. The obtained RMSE and MBE values using method 3 were 3.48mm and 1.83mm, respectively. For the rest of the methods, the MBE values were less than 1mm and the RMSE values were about 3mm. The slopes of the regression lines between the measured and predicted values were between 0.85 and 0.88. Moreover, the correlation coefficients for the measured and predicted data, in all the cases, were about 0.91 and the intercept values ranged between 2.42mm and 3.14mm. Student’s t-tests were conducted and showed that the t values for all the regressions were below the critical value (1.64) at the 95% level of significance for (n- 1) degrees of freedom. It is obvious that, in some situations, the methods either over-or underestimated the measured data, which may be due to the uncertainties, associated with measurements of meteorological variables and/or PWV estimations from the radiosonde data. Other atmospheric parameters, such as the effects of wind speed and day/night variations in the atmospheric boundary layer, which may affect the distribution of atmospheric water, may have some influence on PWV estimations in some situations.
PWV calculations based on existing Tm models
Several empirical models from different regions around the world have been developed to estimate the Tm (i.e. the Bevis method) according to the surface temperature, and to use this relationship to calculate the PWV. In this section, eight previously established models (Table 4) were used to calculate the Tm for the Riyadh site based on the surface temperature. The obtained Tm temperatures from each model were used to calculate the k values, which were then used to transform the GPS ZWD data to PWV data. The RMSE and the MBE values between the radiosondederived PWV data and those obtained from the selected models are also given in Table 4. It can be seen that the overall predictions of the selected models for the measured data appear to be adequate. They showed sub-millimetre MBE values and RMSE values of about 3mm.


Figure 7 shows the measured data plotted against the predicted PWV values using the selected models. It can be seen that the data are distributed very close to the 1:1 line. For all the considered models, the correlation coefficients between the measured and predicted PWV values were between 0.87 and 0.89. The slopes of the regression lines ranged between 0.77 and 0.79 and the intercept values ranged between 2.8 and 3mm. Student’s t-tests were carried out and showed that the overall predications of the selected models were significant at a 95% level of significance for (n-1) degrees of freedom.

It can be seen that the predictions of these models provided realistic estimates of measured PWV values and showed fairly consistent results with the regional and local weighted temperatures used in the previous section. The selected models failed to predict the PWV value in some situations. This may be due to the failure of the model in predicting the exact weighted temperature and/or to the uncertainties associated with measuring the meteorological variables used in the calculations.
Conclusion
Thirty-one years (1985-2016) of radiosonde observations from four sites in Saudi Arabia were used to calculate the zenith wet delay (ZWD) and Precipitable Water Vapour (PWV) for each site individually, and using the entire data set from all four sites. Several conclusions may be drawn from these analyses.
a) Using the Asken & Nordius [1] approach (PWV = k-1 PWV), the relationship between these two variables was investigated and established for each site individually and for the combined data from all sites. Several PWV models based on the ZWD were developed and tested using the dataset covering the period from 1985 to 2012.The values of the conversion constants between the two variables were determined and were found to lie between 0.17 and 0.178, and were within the range of previously obtained values.
b) The site-specific model and the regionally developed model were validated against the measured PWV values for the period between 2013 and2016 and for the entire study period (1986 to 2016). The predictability of these models against the three datasets was excellent. The mean bias errors (MBE) and root mean square errors (RMSE) for the three datasets were, respectively, between 0.02mm and 0.53mm and between 1.51mm and 3.71mm.
c) The mean weighted temperatures (Tm) for the considered sites were calculated and a regional Tm model based on the surface temperature was developed for further calculations. The model had MBE and RMSE values of -0.01K and 4.32K, respectively.
d) ZWD data obtained from GPS receiver installed at the GNSS Solar Village (SOLA) site for the period between 2004 and 2016 were used to calculate the PWV during this period and validate the accuracy of the proposed models.
e) Six approaches were considered in calculating the PWV for this dataset. Three of them were based on using different values for the constant k value; specifically, the regionally obtained k value (0.178), Riyadh site value (0.172), and the global value of k(0.15). The remaining three approaches depended on calculating the weighted temperature from locally developed models. Except for the model that used the global value of k (0.15), all the considered models showed MBE values of less than 1mm. The RMSE value for all the models was about 3mm.
f) Eight models previously developed by different investigators to calculate the weighted temperature from the surface temperature were used to derive the PWV values. The predictions of these models were comparable with the models developed in this study. For all eight models, the MBE value was less than 1mm and the RMSE value was about 3mm.
g) Despite considerable efforts to establish regional and global PWV models using data from all over the world, very few of these studies have been conducted in this region of world. Therefore, the sites and regional PWV-ZWD models developed in this study will be useful for space science, meteorology, climatology, and GPS applications.
Acknowledgement
We would like to thank King Abdulaziz City for Science and Technology (KACST) for supporting this work.
References
- Askne J, Nordius H (1987) Estimation of tropospheric delay for microwave from surface weather data. Radio Sci 22(3): 379- 386.
- Sajith V, Santosh KR, Mohan HSR (2003) Intra seasonal oscillation of total precipitable water over North Indian Ocean and its application in the diagnostic study of coastal Geophys Res Lett 30(20): 2054.
- Ning T, Elgered G, Willen U, Johansson JM (2013) Evaluation of the atmospheric water vapour content in a regional climate model using ground based measurements. J Geophys Res 118(2): 329-339.
- Maghrabi AH, Al Dajani HM (2014) Time distribution of the precipitable water vapor in central Saudi Arabia and its relationship to solar activity, Advances in Space Research 53(8): 1169-1179.
- Kane RP (1996) Interannual variability of precipitable water. Ann Geophys Atmos Hydrosph Space Sci 14: 464-467.
- Smirnov VV, Moore GWK (2001) Short-term and seasonal variability of the atmospheric water vapor transport through the Mackenzie River basin. J Hydrometeor.
- Dai A, Wang J, Ware RH, Hove TV (2002) Diurnal variation in water vapor over North America and its implications for sampling errors in radiosonde humidity. J Geophys Res 107(D10): ACL 11-1-ACL 11-14.
- CzajkowskiK P, Samuel N, Goward S, David S, Walz A (2002) Thermal remote sensing of near-surface water vapor. Remote Sensing of Environment 79(2-3): 253-265.
- Bokoye AI, Royer A, O’Neill NT, Cliche P, McArthur LJB, et al. (2003) Multisensor analysis of integrated atmospheric water vapour over Canada and Alaska. J Geophys Res 108(D15): 4480.
- Gerding M, Christoph R, Marion M, Roland N (2004) Tropospheric water vapour soundings by lidar at high Arctic latitudes. Atmospheric Research 71(4): 289-302.
- Elies C, Bech J, Rodríguez-Marcos J, Sola Y, Lorente J (2010) A comparison of total precipitable water measurements from radiosonde and sunphotometers. Atmospheric Research 97(3): 385-392.
- Maghrabi A, Clay R (2010) Precipitable water vapour estimation on the basis of sky temperatures measured by a single-pixel IR detector and screen temperatures under clear skies. Meteorol Appl 17(3): 279-286.
- Bevis M, Businger S, Herring T, Rocken C, Anthes R, et al. (1992) GPS meteorology: remote sensing of atmospheric water vapour using the global positioning system. J Geophys Res 97(D14): 15787-15801.
- Gendt G, Dick G, Reigber C, Tomassini M, Liu Y, et al. (2004) Near real time GPS water Vapour monitoring for numerical weather prediction in Germany. Journal of Meteorological Society of Japan 82(1B): 361-370.
- Heise S, Dick G, Gendt G, Schmidt T, Wickert J (2009) Integrated Water Vapour from IGS Ground-Based GPS Observations: Initial Results from a Global 5-min Data Set. Ann Geophys 27: 2851-2859.
- Fernandez LI, Salio P, Natali MP, Meza AM (2010) Estimation of precipitable water vapour from GPS measurements in Argentina: validation and qualitative analysis of results. Adv Space Res 46(7): 879-894.
- Bosy J, Kaplon J, Rohm W, Sierny J, Hadas T (2012) Near real time estimation of water vapour in the troposphere using ground GNSS and the meteorological data. Ann Geophys 30: 1379-1391.
- Boutiouta S, Lahcene A (2013) Preliminary study of GNSS meteorology techniques in Algeria. Int J Remote Sens 34(14): 5105-5118.
- Hong L, Yunchang C, Xiaomin W, Zhifang X, Haishen W, et al. (2015) Meteorological applications of precipitable water vapor measurements retrieved by the national GNSS network of China. Geod Geodyn 6(2): 135-142.
- Ross RJ, Rosenfeld S (1997) Estimating mean weighted temperature of the atmosphere for Global Positioning System applications. J Geophys Res 102(D18): 21719-21730.
- Emardson TR, Derks HJP (2000) On the relation between the wet delay and the integrated precipitable water vapour in the European atmosphere. Meteorol Appl 7(01): 61-68.
- Raju CS, Saha K, Thampi BV, Parameswaran K (2007) Empirical model for the mean temperature of the Indian zone and precipitable water vapour from ground based GPS measurements. Ann Geophys 25: 1935-1948.
23. Jade S, Vijayan MSM, Gaur VK, Tushar PP, Sahu SC (2005) Estimates of precipitable water vapour from GPS data over the Indian subcontinent; Journal of Atmospheric and Solar-Terrestrial Physics 67(6): 623-635.
- Lichten S, Bar-Sever Y, Bertiger E, Heflin M, Hurst K, et al. (2006) GIPSY-OASIS II: A High precision GPS Data processing System and general orbit analysis tool. Technology 2(6): 2-4.
- Jin SG, Li Z, Cho J (2008) Integrated Water Vapour Field and Multiscale Variations over China from GPS Measurements. Journal of Applied Meteorology and Climatology 47: 3008-3015.
- Xu G, Cui C, Wan R, Lai A, Wan X, et al. (2012) Applicability of methods for estimating GPS precipitable water in the Qinghai-Tibet Plateau. Journal of Atmospheric and Solar- Terrestrial Physics 89: 76-78.
- Bevis M, Businger S, Chiswell T, Herring T, Anthes R, et al. (1994) GPS meteorology: Mapping zenith wet delays onto precipitable water. J Appl Meteorol 33: 379-386.
- Isoioye OA, Combrinck L, Botaic J (2016) Modelling weighted mean temperature in the West African region: implications for GNSS meteorology, Meteorol Appl 23(4): 614-632.
- Maghrabi AH, Aldosari AF, Almutairi MM, Altilasi MI, Aldakhil AA, et al. (2018) Variations and modeling of the atmospheric weighted mean temperature for ground-based GNNS applications: central Arabian Peninsula. Advance in Space Research 62(9): 2431-2442.
- Wang J, Zhang L, Dai A (2005) Global estimates of watervapour-weighted mean temperature of the atmosphere for GPS applications. J Geophys Res 110(D21): 1-17.
- Singh RP, Mishra NC, Verma A, Ramaprasad J (2000) Total precipitable water over the Arabian Ocean and the Bay of Bengal using SSM/I data. Int J Remote Sens 21(12): 2497-
- Singh D, Ghosh JK, Kashyap D (2014) Weighted mean temperature model for extra tropical region of India. J Atmos Sol Terr Phys 107: 48-53.
- Stone RJ (1993) Improved statistical procedure for the evaluation of solar radiation estimation models. Sol Energy 51(4): 288-291.
- Liu J, YaoY, Sang J (2018) A new weighted mean temperature model in China. Advances in Space Research 61(1): 402-412.
- Liou YA, Teng YT, Teresa VH, James CL (2000) Comparison of precipitable water observations in the near tropics by GPS, microvawe radiometer, and radiosondes. J Apllied meterology 40: 5-15.
- Zumberge JF, Heflin MB, Jefferson DC, Watkins MM, Webb FH (1997) Precise point positioning for the efficient and robust analysis of GPS data from large networks. Journal of geophysical research: solid earth 102(B3): 5005-5017.
- Fernandes RMS, Sá A, Miranda P, Bos MS, Martins J, et al. (2015) Signature on GNSS PWVestimates of relevant storms affecting Iberia in recent years. IUGG General Assembly, IUGG-G07, Prague, Czech Republic, p. 372.
- Mekik C, Deniz I (2017) Modelling and validation of the weighted mean temperature for Turkey. Meteorol Appl 24(1): 92-100.
- Böhm J, Niell A, Tregoning P, Schuh H (2006) Global Mapping Function (GMF): A new empirical mapping function based on numerical weather model data. Geophysical Research Letters 33(7).
- Mendes VB, Prates G, Santao L, Langley RB (2000) An evaluation of the accuracy of models for the determination of weighted mean temperature of the atmo sphere. In: Proceedings of the ION 2000, National Technical Meeting, Anaheim, CA, USA, pp. 433-438.
- Solbrig P (2000) Untersuchungen uber die Nutzung numerischer Wettermodelle zur Wasserdampfbestimmung mit Hilfe des Global Positioning Systems. Diploma Thesis. Institute of Geodesy and Navigation, University FAF Munich, Germany.
- Davies OT, Watson PA (1998) Comparison of integrated precipitable water vapor obtained by GPS and radiosondes. Electronic Letters 34(7): 645.
- Feng Y, Bai Z, Fang P, Williams A (2001) GPS water vapour experimental results from observations of the Australian Regional GPS Network (ARGN). 2001-A Spatial Odyssey: 42nd Australian Surveyors Congress, Brisbane, Australia, Institute of Surveyors.


