Mapping Deforestation and Forest Degradation Using CLASlite Approach (A Case Study from Maya Devi Collaborative Forest of Kapilvastu District, Nepal)
Ram Kumar KC, Dambar Bahadur Mahato, Nabin Kumar Yadav and Prabin Poudel
Institute of Forestry, Tribhuvan University, Nepal
Submission: February 18, 2020; Published: March 04, 2020
*Corresponding author: Ram Kumar KC, Tribhuvan University, Institute of Forestry, Pokhara, Nepal
How to cite this article: KKC R, Mahato DB, Yadav NK, Poudel P . Mapping Deforestation and Forest Degradation Using CLASlite Approach (A Case Study from Maya Devi Collaborative Forest of Kapilvastu District, Nepal). Int J Environ Sci Nat Res. 2020; 23(5): 556122. DOI: 10.19080/IJESNR.2020.23.556122
Abstract
Mapping and monitoring of forest area suffering from deforestation and forest degradation using satellite images and remote sensing has been an achievable activity for the sustainable forest management and conservation. Mapping of disturbance and degradation of forest is gaining momentum through Remote Sensing despite, major challenges still exist. The present study was conducted to quantify the forest area of deforestation and degradation within the Maya Devi collaborative forest of Terai region located at Kapilvastu district of Nepal. This study based on the optical satellite data (Landsat 7 ETM of 2000 and Landsat 8 OLI/TIRS of 2016) and spectral un-mixing of these datasets which produced fractional cover (proportion of vegetation, non-photosynthetic vegetation and bare soil). Under the environment of CLASlite tools, mapping of damaged canopy, exposed soil and dead vegetation were produced. With the gap of 15 years two Landsat Image of 2000 and 2016 were processed to estimate. Results shows that the study area has 60% intact forest, 23% less degraded forest, 12% moderately degraded forest and 5% highly degraded forest. In sum, only 8.01 hectare of forest has been cleared and degraded. Finally, CLASlite approach based upon medium resolution satellite images and ground sample plots could practicable in order to monitor the forest degradation and deforestation.
Keywords: Deforestation Forest Degradation CLASlite Spectral un-mixing Fractional cover
Introduction
In global, Nepal forests cover is about one-third of land which represents the 44.74% of total land of Nepal only. Comprises of 118 ecosystem that contributes essential service to the human being’s survival. Forests becomes a main hub to encroached in the name of relief, resettlement, homestay as well as playground for the government offenders, urban expansion, national development infrastructure which ultimately accelerated the forest deforestation. There are still some communities those rely completely in the illegal felling and selling that to the market for the daily survival. and poorly understanding the root causes of widespread forest degradation in developing countries [1]. Forest resources are crucial and increasing population have heavy pressure on the forest of Nepal in order to fulfill the subsistence need like fuelwood, fodder and land use changes. Forest conservation are more directly relevant in the case of Nepal as forest resources are significant for ecosystem balance and people’s livelihood [2].
According to FRA [3] deforestation is the conversion of forest to another land use or the long-term reduction of tree canopy cover below the 10% threshold. The worldwide deforestation continues at an alarmingly high rate: 16 million ha per year [4]. In Asia, a net loss of about 0.6 million hectares per year occurred in the 1990s; however, from 2000 to 2010 a net gain of more than 2.2 million hectares per year was reported, primarily due to large-scale afforestation efforts, particularly in China, but high rates of net loss continued in many countries in South and Southeast Asia [4].
Nepal has in total 5.96 million ha of forests, which represents more than one-third (40.36%) of total land [5]. It comprises of 3 physiographical zones among which Terai is one having subtropical to tropical eco-climatic zone and it covers 17% of total land. High population growth, unmanaged settlement, unemployment, encroachment, grazing and forest fire are some of the underlying causes of the reduction of forest resources. Brampton [6] suggeststhat Terai forests have a higher deforestation rate than the middle hill forests of Nepal. According to the National Forest Inventory, annual average deforestation rate in Nepal from 1978 to 1994 was about 1.7% [7]. Similarly, global forest loss was estimated 1.7% of deforestation for the period of 1990 to 2005 [8]. A case study in 20 Terai districts showed forest cover loss with annual rate of 0.6% between 1990 to 2000 [9]. According to a recent forest assessment report, the forest area in the Terai decreased by 16500 ha with annual rate of 0.44% between 2001 and 2011 [5]. This shows that there is a good deal of pressure on forest especially on those in the Terai and Inner Terai.
Remote sensing is a very powerful tool, widely accepted and growing implication for the monitoring of forest degradation studies. It involves the acquisition of remotely sensed data about an object, area or phenomenon then undergoing through the analysis of data acquired by a device that is not in contact with the object, phenomenon or area under investigation [10]. Remote sensing data with sufficient spatial and high-resolution satellite datasets are worthful and reliable resources for forest cover mapping and monitoring [11].
Landsat Data with (30 by 30) m resolution free data are used for the forest cover mapping and application of CLASlite program was used to detect the forest deforestation and disturbance in the tropical region [12]. Deforestation is defined as permanent absence of forest cover (decrease of photosynthetic vegetation and increase of soil substrate). Meanwhile, disturbance refers to patches of non-forest area in forested area, as well as natural non-forested vegetation such as grasslands and shrub lands and thinning of forested area [13]. Automated Monte Carlo Unmixing (AMCU) is a promising technique to generate fractional cover of forest canopies and its time series study using CLASlite can indicate the various classes and level of degradation. This technique provided a reliable method of monitoring of forest degradation.
The main aim of this study is to map out the deforested and disturbed forest area of the study site on the basis of fraction cover. The factors which could accelerate the deforestation and forest degradation process have not been studied well in the Nepalese context yet. Though, many studies have been done on forest canopy and its dynamics, afforestation, restoration, deforestation and forest degradation in the different parts of the world, only few studies have been carried out in Nepal. Therefore, identifying the problems of deforestation, degradation and forest disturbance at different spatial and temporal scales could provide useful information for sustainable managements of forests, define proper polices and strategies, implementation plans and addressing the real issues of deforestation and its coping mechanism.
Materials and Methods
Study area
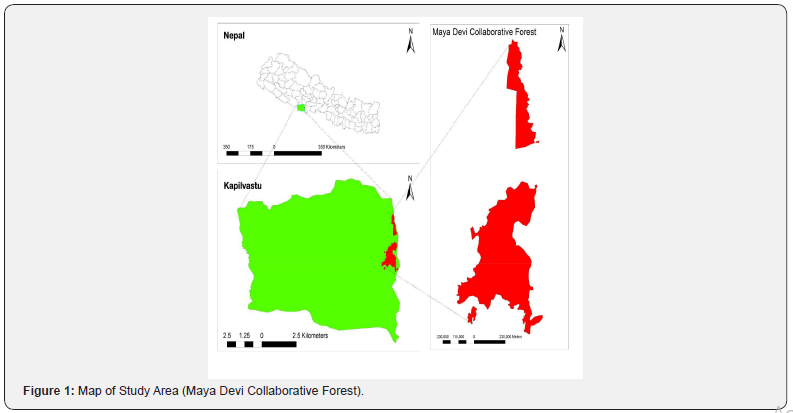
This study (Figure 1) has been carried out in Mayadevi Collaborative Forest of Kapilvastu district in the Southern parts of Province 5. It lies between 27°35’ 44.92” N to 27°44’ 35.96” N and 83°10’ 17.13” E to 83°13’ 50.47”E. Its elevation range is between 94-248m above mean sea-level. The maximum temperaturerecorded here is 43°C and minimum temperature is 4.5°C. It is divided into 3 blocks: Pipara block, Prativa East block and Patna block with a total area of 1721.27 hectares. Climatically, the study area falls under a Tropical monsoon climate and mainly coarse clay/ loamy soil is found here. Primarily this forest is a Sal forest. However, other species like Bhotdhairo (Lagerstroemia parviflora), Asna (Terminalia alata), Kusum, Harro (Terminalia chebula), Barro (Terminalia bellirica), Sindure (Mallotus phillippinesis), Karma (Adina cardifolia), Jamun (Syzygium cumini), Sissoo (Dalbergia sissoo), Khair (Acacia catechu) etc. are also found in the research area. The forest range is surrounded by agriculture and rural settlements. There is disturbance due to grazing by cattle, illicit felling, road widening and dying trees in flooding of lowlying areas.
Data, tools and software
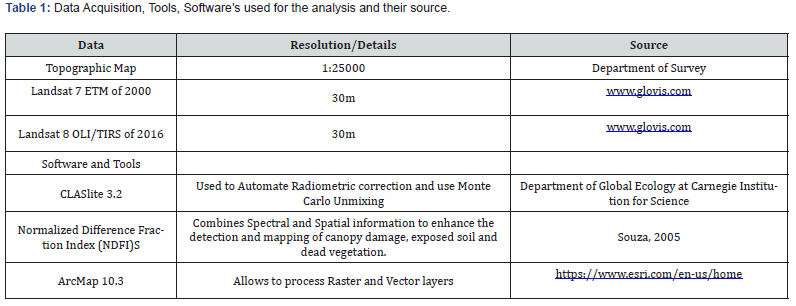
I order to mapping of deforestation and forest degradation demands data from different sources such as satellite images, topo sheets and various tools were used to carry out image analysis and conclude the findings. Data, Tools and Software used for this study are presented in Table 1.
Methodology
Till today there are variety of methods developed and applied in Nepal for the assessment of the forest degradation. Aerial Photography, Field Surveys Satellite Image analysis and GIS and Ecosystem service valuation out of this all Satellite Image analysis and GIS are more feasible in terms of uniformity, costing, and accuracy [14]. Following the flowchart from Figure 2 forest degradation and deforestation maps were produced.

Pre-processing of landsat satellite data
The boundary of study file was been digitized from Topographic map from Survey department of Nepal. CLASlite 3.2 was used for image processing. The Raw Digital Number (DN) images downloaded from USGLOVIS (www.glovis.com) were calibrated to reflectance using gain and offsets value available in metadata. The result of radiometric calibration is an image in units of radiance (i.e. watts per square meter per units of solid angle), also known as the energy measured by the satellite-based sensor. The atmospheric players are aerosols, water vapor and other gases, like oxygen and ozone. These constituents scatter and absorbs radiated energy to various extents at different wavelengths. This means that the sensor cannot detect everything that gets reflected off the Earth’s surface. CLASlite applied an automated atmosphere correction model and converts the results to reflectance images [15].
Analysis of fractional cover
The CLASlite tool has been used to generate fractional cover of both the years, sequentially following the methodological framework as shown in Figure 2. CLASlite adopts a Monte Carlo method, whereby the possible combination of the end member spectra is pre-computed and are applied during the Automated Monte Carlo Unmixing run. An advantage of the Monte Carlo approach is that the per-pixel iterations produce a standard deviation of the estimate for PV, NPV and bare substrate fractions. The process of random selection is repeated up to 50 times or until the solution converges to a mean value for each surface cover fraction. This technique considers that each pixel is a combination of certain pure elements [i.e. vegetation (PV), Soil-vegetation (S), Non-Photosynthetic vegetation (NPV), Shade Burnt] that combine to produce a given response per pixel. Each pixel will be characterized by a percentage of each pure element (i.e. 80% Vegetation, 10% Soil, 5% NPV and 5% Shade) and the interpretercan choose the thresholds of each element that will help classify the image (i.e. those pixels with ≥60% of Vegetation-pure element, will be classified as vegetation cover).
Normalized Difference Fraction Index (NDFI)
A technique that combines spectral and spatial information to enhance the detection and mapping of canopy damage, exposed soil and dead vegetation has been used. Comparing with spectral indices, NDFI are more reactive to Tropical Forest disturbance that make ease in the identification [16]. Following Equation given below has been used to calculate NDFI. The output layers of CLASlite i.e. PV, NPV, and Bare Soil is used as input parameters.

Where, PV is photosynthetic vegetation, NPV is nonphotosynthetic Vegetation.
Accuracy assessment
For the validation, we looked at five different measures: error matrix, overall accuracy, user’s accuracy, producer ‘s accuracy and kappa coefficient in order to evaluate the final maps. The manual interpretation from 2016 was used for the accuracy assessment since it consists of the most up-to-date information about the forest extent in the study area. The required number sample points have been collected from study area which has been used as reference data.
Results and Discussion
Fractional cover of 2000 and 2016
Figure 3 shows the fractional cover of 2000 in which PV, NPV and bare soil are expressed in percentage (0-100%). In 2000, there is, 5-100 % vegetation, 0-72% of non-vegetation 0-49% of bare soil.

Similarly, Figure 4(b) and 6(b), Band 1 represents Fractional cover of BS which is displayed in red color, while Band 2 represents Fractional cover of PV which is displayed in green, and Band 3 represents Fractional cover of NPV which is displayed in Blue color. The intensities of each represent the presence of each cover type in each pixel. For instance, green pixels have a higher percentage of PV, red and yellow pixels indicate the presence of BS and PV, while blue pixels represent higher fractional coverage of NPV.
The RMSE image (Figure 4c) shows the geographic areas of relatively high overall uncertainty in the modeling: for example, roads and settlements have the largest errors approaching 6%.

Similarly, Figure 5, shows the fractional cover of 2016 in which PV, NPV and bare soil expressed in percentages (-1 to 100%). In 2016, there is -1 to 100% of Vegetation, -1 to 84% of Non-Vegetation and -1 to 77% of Bare which shows there is more open and deforested area.

The RMSE image (figure 6c) of 2016 ranges from -1 to 5 indicating the highly accurate classification of PV, NPV and Bare Soil.
Normalized Difference Fractional Index (NDFI)
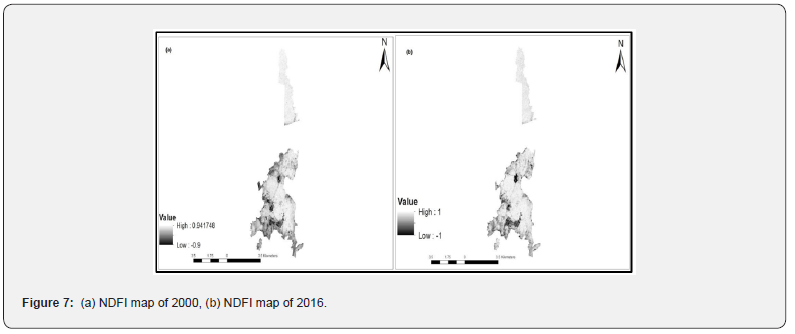
The range of NDFI lies between -1 to +1. A positive value shows high PV implying less NPV and bare soil indicating less disturbed forest while a negative value shows high NPV and bare soil indicating highly disturbed forest. Figure 7(a) shows that the range of NDFI in 2000 lies between -0.9 to 0.941748 while in 2016 Figure 7(b) the range is between -1 to +1.

Forest deforestation and disturbance map
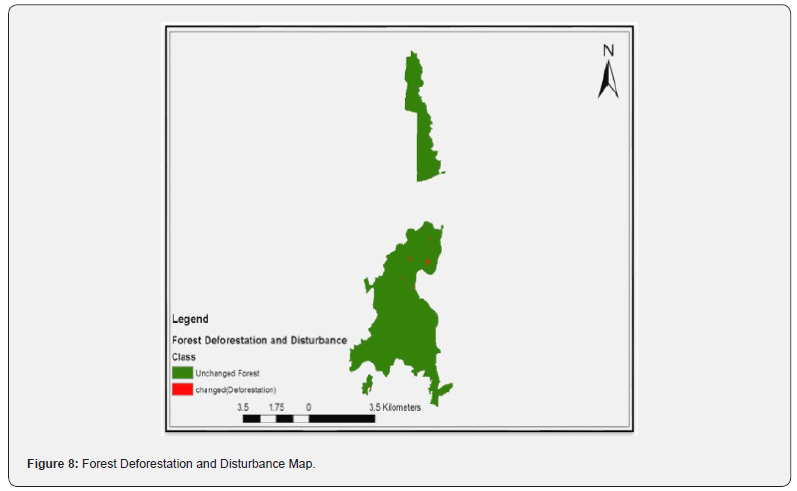
In the Figure 8, it’s represents the final deforestation and disturbance map which is derived from image analysis of two different years 2000 and 2016 using ClASlite package. The result shows that out of total area 8.01 hectare of forest has been deforested from the total area.
Forest degradation map
From Figure 9, forest degradation which is composed by overlaying of reclassifying change map of NDFI from 2000 and 2016. The result shows that 60% intact forest, 23% less degraded forest, 12% moderately degraded forest and 5% highly degraded forest.
From Table 2 it can be clearly conclude that the overall accuracy of this study is 84.61% with kappa Coefficient of agreement value 0.793, giving an indication of highest degree of agreement between user defined class and referenced class (ground truth class).
Conclusion
The Mayadevi Collaborative Forest which is dominated by Sal forest is subjected to deforestation and degradation due to various factors natural and man-made. LANDSAT images are better suited for studying about forest as it has NIR, SWIR, thermal bands. CLASlite is an automated tool based on Automatic Monte Carlo Unmixing (AutoMCU) for separating PV, NPV and Bare using pre-computed spectral signature. An advantage of the Monte Carlo approach is that the pre-pixel iterations produce a standard deviation of the estimate for PV, NPV and bare substrate fractions. It also generates a root mean square error (RMSE) image of the model versus observed reflectance signature whichexpressed in percentage. The RMSE and the standard deviation images provides a way to assess the performance of the AutoMCU on a pixel by pixel basis, allowing to identify areas of concerns.
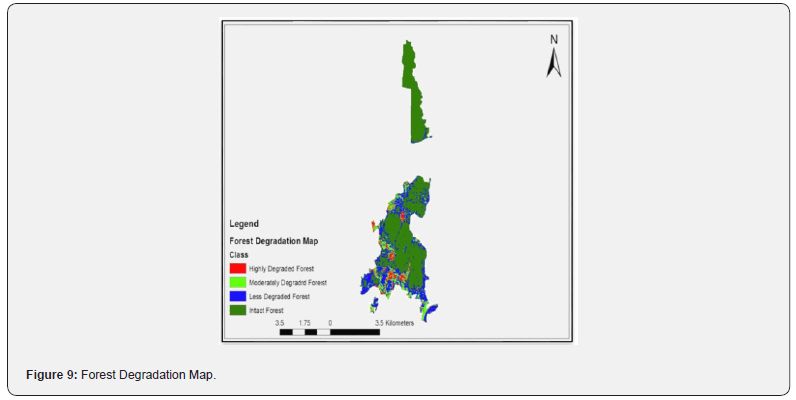
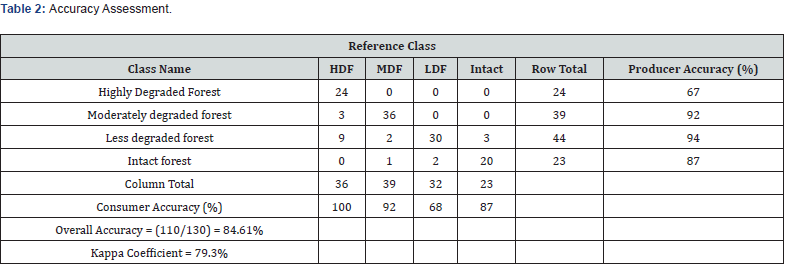
Results show that study area has 60% intact forest, 23% less degraded forest, 12% moderately degraded forest and 5% highly degraded forest. In total, only 0.46% (8.01Ha) land was completely deforested out of total area (1721.27Ha). The overall accuracy of this study is 84.61% with Kappa Coefficient of agreement value 0.793, giving an indication of highest degree of agreement between user defined class and reference class (ground truth class). The fractional cover of study area shows that Landsat OLI/ TIRS 8 of 2016 has low RMSE (i.e. 0 to 5%) than Landsat 7 ETM of 2000 (i.e. 0 to 6%) because it has two thermal bands in which one of them is uses for quality assessments (QA). The roads and agricultural land shows largest error i.e. 6% while the degraded areas show very low error.
The change in fractional cover from one time to other included change in natural (felling, logging, lopping) as well as anthropogenic change (conversion of forest to agriculture and settlements). The study suggests that NDFI considers only PV, NPV, and bare whereas fails to analyze the structural changes in vegetation, this disadvantage is overcome by using SAR and highresolution satellite images. CLASlite automated tool will be much useful for operational purpose, which need limited classification but has greater impact to protect forest degradation.
References
- Niles JO, Brown S, Pretty J, Ball AS, Fay J (2002) Potential carbon mitigation and income in developing countries from changes in use and management of agricultural and forest lands. Philos Trans A Math Phys Eng Sci 360(1797): 1621-1639.
- Birch JC, Thapa I, Balmford A, Bradbury RB, Brown C, et al. (2014). What benefits do community forests provide, and to whom? A rapid assessment of ecosystem services from a Himalayan forest, Nepal. Ecosystem Services 8: 118-127.
- FRA (2015) Terms and Definitions of Forest. Forest Resource Assessment, Working Paper 180.
- FAO (2015) Global Forest Resources. Rome, Italy: Food and Agriculture Organization of the United Nations.
- FRA (2014) Terai Forests of Nepal (2010-2012) Babarmahal, Kathmandu: Resource Assessment Nepal Project.
- Brampton JA, Cammaert B (2007). How Can Timber Rents Better Contribute to poverty Reduction Through Community Forestry in the Terai Region of Nepal. Journal of Forest and Livelihoods 6(1): 28-47.
- DFRS (1999) Forest Resources of Nepal (198 -1998). Kathmandu, Department of Forest Research and Survey, Ministry of Forests and Soil Conservation and Forest Resource Information System Project, Government of Finland.
- FAO (2012) FAO Forestry Paper No. 169. Rome, FAO: Agriculture Organization of the United Nations and European Commission Joint Research Centre.
- DoF (2005) Forest Cover Change Analysis of the Terai Districts, 1990/91-2000/01. kathmandu, Nepal: Department of Forest, Ministry of Forest and Soil Conservation.
- Lillesand TK (2004) Remote Sensing and Image Interpretation. (7th edn), John Wiley: Chichester.
- Lu DM, Mausel P, Brondizio E, Moran E (2004) Change detection techniques. International journal of remote sensing 25(12): 2365-2401.
- Asner GP, Knapp DE, Cooper AN (2005) Ecosystem structure throughout the Brazilian Amazon from Landsat observationsand automated spectral unmixing. Earth Interactions 9(7): 1-31.
- CLASlite (2013) CLASlite Forest Monitoring Technology version 3.1 User Guide. 260 Panama Street Stanford, California 94305 USA: Carnegie Institution for Science, Department of Global Ecology.
- Acharya KP, Dangi RB, Acharya M (2011) Understanding forest degradation in Nepal. Unasylva 62(2): 31-38.
- Allnutt TF, Asner GP, Golden CD (2013) Mapping recent Deforestation and Forest Disturbance in North Easter Madagascar. Tropical Conservation Science 6(1): 1-15.
- Schultz MC, Clevers JGPW, Carter S, Verbesselt J, Avitabile V, et al. (2016) Performance of vegetation indices from Landsat time series in deforestation monitoring. International Journal of Applied Earth Observation and Geoinformation 52: 318-327.


