Carbon and Water Interaction Model in Tropical Peatland
Nobuyuki Tsuji1*, Keiji Kimura2, Albertus Sulaiman3, Takashi Hirano4, Hidenori Takahashi5 and Mitsuru Osaki1
1Japan Peatland Society, Japan
2Faculty of Letters, Nara University, Japan
3Agency for the Assessment and Application of Technology, Indonesia
4Research Faculty of Agriculture, Hokkaido University, Japan
5Hokkaido Institute of Hydro-Climate, Japan
Submission: November 28, 2019; Published: December 06, 2019
*Corresponding author: Nobuyuki Tsuji, Japan Peatland Society, Ohura 3-15-3-402, Yahata-Nishi-Ku, Kitakyusyu, Fukuoka, 807-0874, Japan
How to cite this article: Nobuyuki Tsuji, Keiji Kimura, Albertus Sulaiman, Takashi Hirano, Hidenori Takahashi, Mitsuru Osaki. Carbon and Water Interaction Model in Tropical Peatland. Int J Environ Sci Nat Res. 2019; 22(5): 556099. DOI: 10.19080/IJESNR.2019.22.556099
Abstract
As the water issue relates the carbon issue in peatland, carbon and water interrelation has been studying for long term (more than 10 years) in peatland of Central Kalimantan, Indonesia. The Soil Moisture Content (SMC) and Ground Water Table (GWT) in long term have been monitoring by auto-monitoring system called SESAME, developed by our team, and Net Ecosystem Exchange (NEE) has been measured by Eddy Covariance on the tower. By these long-term monitoring, it is found that
a) positive correlation with SMC and GWT,
b) negative correlation with NEE and GWT.
On the other hand, as global soil moisture data has been provided daily from European Center for Medium-Range Weather Forecasts (ECMWF), we developed mapping model on GWT and NEE, applying correlation coefficient of SMC-GWT and NEE-GWT. The NEE mapping in peatland corresponds with Tier 2 and 3 level of Intergovernmental Panel on Climate Change (IPCC) guideline.
Keywords: Tropical peatland, N2O emissions, Vegetation, Ecosystem
Introduction
Tropical peatland is high carbon and water reservoir, because as oxygen dissolve extremely low into water, organic matter decomposition by microorganisms comes extremely to low at high ground water table (GWT) in native peatland. In other trait of tropical peatland, especially in Indonesia, nutrients supply is very limited, because;
a) water supply is only from rain (acidic pH 5.6), and
b) nutrients desorption ability is very low with peat (organic matter) at low pH (lower than 4.0 in peat), indicating that peat decomposition is low owing to low microorganisms’ activity. Tropical peatland is very vulnerable ecosystem. Once GWT comes to lower by drainage and/or deforestation, microorganisms decompose quickly peat (slow oxidation called cold fire), and fire occur frequently inside peat (fast oxidation called hot fire).
In opposite process against carbon and water reservoir in peatland such as drying-up peatland by making drainage, CO2 emission should be accelerated, and CH4 and N2O emissions should increase by chemical fertilizer application, for which oil palm plantation is typical case. By using drained peatland data and regression relationship between CO2 emission and GWT (CO2 emission t ha−1 y−1 = 91 · Groundwater depth (cm)), it was estimated that carbon emission caused by decomposition of drained peatlands was between 355Mt y−1 and 855Mt y−1 at Southeast Asia in 2006 [1]. With the same method of Hooijer et al. [2] carbon dioxide will be released from 93 to 217 megaton over next 25 years due to the development of palm oil plantation that located in the Ex-Mega Rice Project area in Central Kalimantan, Indonesia [2].
Thus, water-carbon interaction is one of the key scientific principles of tropical peatland ecosystems; carbon accumulate in peatland at high GWT, vise versus, carbon emits from peatland at low GWT. However, as emission factors in Intergovernmental Panel on Climate Change (IPCC) guideline are Tier 1 level, there are big bias for actual greenhouse gasses (GHGs) emissions in especially peatland and wetland, because redox potential has been drastically changing by water and nutrients conditions, indicating also microorganism’s activity is drastically changing by redox potential [3].
Tropical peatland in Central Kalimantan, including Mega Rice Project (MRP) area, Indonesia, has been monitoring with several parameters related with carbon and water for more than 10 years. The important parameters are GWT and SMC, both of which have liner correlation, and other is Net Ecosystem Exchange (NEE), of which NEE has negative correlation with GWT, suggesting peat decomposition process is controlled by GWT because of microorganism’s activity increasing with decreasing GWT because of oxygen suppling to peat [4,5]. Also, carbon emission by peat fire relates with GWT [6-10].
There are mainly two kinds of GWT estimation models: physically based model generally applied to small region, and statistically based one generally applied to wide region. Water balance, input (precipitation) = output (runoff, transpiration, evapotranspiration, groundwater table), is the fundamental equation in physically based model [11]. Simulation of groundwater and surface water levels (SIMGBRO) [12] and tank model [13], for example, are the physically based models for estimating GWT, respectively. As we should know the detailed physical parameters related with soil, temperature, and precipitation, it is generally difficult to apply physically based model for getting GWT estimation value for long time and/or in huge area. While, in statistically based model, many parameters derived from satellite and observation data (ground truth) are used. Vegetation Integrated Simulator for Trace gases (VISIT) model has been proposed [14] based on such as position (latitude, longitude, and altitude), climate information (temperature, precipitation, etc.), land cover information (natural vegetation, wetland fraction, etc.), inundation fraction and soil type, into each grid cell . This model simulates the balance of specific GHGs (CO2, CH4, and N2O), biogenic volatile organic compounds (BVOC), and dissolved organic carbon (DOC) [15]. The model has been validated through comparisons with a variety of observational data at different scales. This model can be applicable to all over the world. Takeuchi et al. [16] established the GWT estimation model in Indonesia. They made a wide model used by temperature, precipitation, observed GWT. Carlson et al. [17] studied the statistical-based relationship between GWT and amount of carbon emission. This paper aims to develop an empirical model to estimate carbon emission to GWT data for a mesoscale area such as province.
Indonesia is the third largest carbon emission country of the world, and emission from peatland is larger than one from industry [18]. Thus, the Reducing Emissions from Deforestation and Forest Degradation (REDD+) and the carbon accounting system at Tier 2 or Tier 3 level are required keenly in Indonesia. Recently, REDD+ in developing counties become important mechanisms for forest managing using natural capital accounting and carbon accounting. To promote REDD+ project, measurement, reporting, and verification (MRV) is necessary because emission factors in IPCC guideline is too approximative. However, there are no integrated MRV system yet, especially in tropical peatland. Therefore, here is proposed a comprehensive Integrated MRV System and Carbon Emission Model (Map) in tropical peatland.
Methods and Materials
Description of the study area
GWT and NEE have been observing in Central Kalimantan [4]. A national project of Indonesia, the Mega Rice Project (MRP) developed large peatland area (around one Million ha), deforested and drained during the late 1990s. After the project was terminated in 1999, MRP area has been devasting and/or still developing by drainage inside of peatlands. To study ecosystem of peatland in this area, sites were set at three types peatland such as Undrained forest (UF, intact (near native) peatland forest with small drainage and select logging in past), Drained Forest (DF), and Drained and Burned area (natively Forest) (DB). The three sites were located on flat terrain within 15 km from river. To classify three peatland types, we used the following data; 1) peatland map by Wetlands International (2004) [19], 2) Global forest change data set (2000-2013), and 3) MODIS MOD09A1. By data (1) and (2), we extracted peatland, and canopy loss areas at peatland. Canopy loss area was assumed to DB. We calculated normalized difference infrared index as dry index. Higher dry index was assumed to DF, and lower assumed to UF.
Monitoring methods
The observed (monitoring) data are such as GWT, SMC, temperature in peat, and whether data; air temperature, precipitation, solar radiation, wind speed and direction, using the Sensory Data Transmission Service assisted by Midori Engineering Lab. (SESAME) system. SESAME system is mainly composed of the sensors, the data logger, the data communication module and the battery system. The sensor for water depth is used the pressure sensitive element. The M2M (Machine to Machine) system is used for the data transmission, because the system makes data transmission automatically through the communication network of mobile-phone and stocks the huge amount of data in the cloudserver. The solar battery is used for driving force of the system, so then this system is possible to use in the field without electric power supply network. This system can compose some different type of sensor such as water quality, rainfall and temperature. The intervals of data sampling in the field and data transferring to the server are possible to choose minimum 1 minute in data sampling and minimum 10 minute for data transferring. The sensors of water pressure, rainfall and temperature are used in this study. And the data sampling and data transferring was carried on 10-minute interval and 1-hour interval, respectively [20].
The NEE was observed by an equipment with Eddy covariance method, for evaluating vertical transport of energy, water vapor and gases in the near-ground atmosphere. Near the ground surface, wind blows as a turbulent flow, meaning there are many “eddies” with wide ranges in size and duration. These eddies exchange the energy and gases between the upper and the lower atmospheric layers. According to the turbulent flow theory, these vertical fluxes can be given as a function of covariance of vertical wind velocity and gas concentration. Therefore, this method is called “eddy covariance” [21].
Model structure
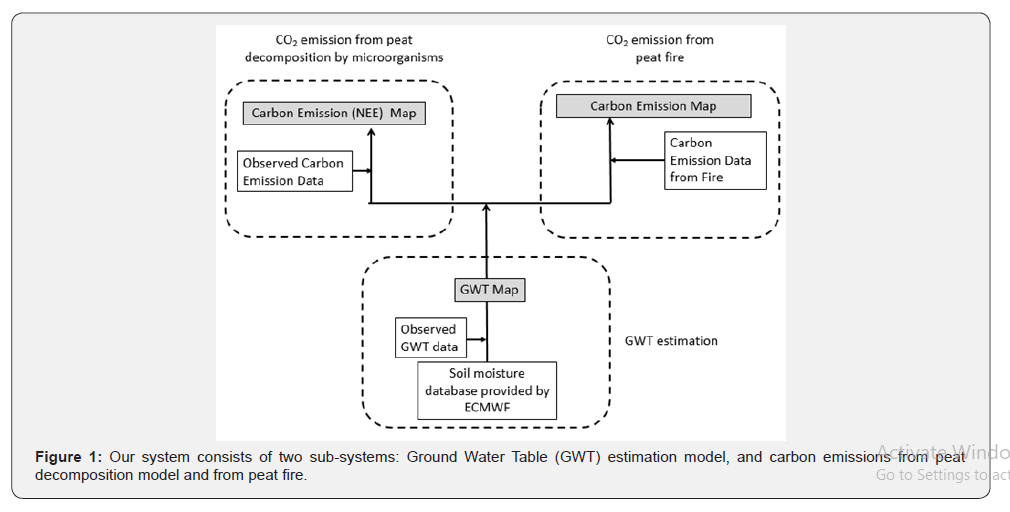
Our model consists of two parts: one is estimating GWT used by database related with soil moisture, and the other is for estimating amounts of carbon emission from peat decomposition and peat fire based on the estimated GWT (Figure 1). Though this system was explained already in “Guidebook for estimating carbon emissions from tropical peatlands in Indonesia” [21] which is Japan International Cooperation Agency (JICA) project report, more detail is available than this guide book.
SMC-GWT correlation
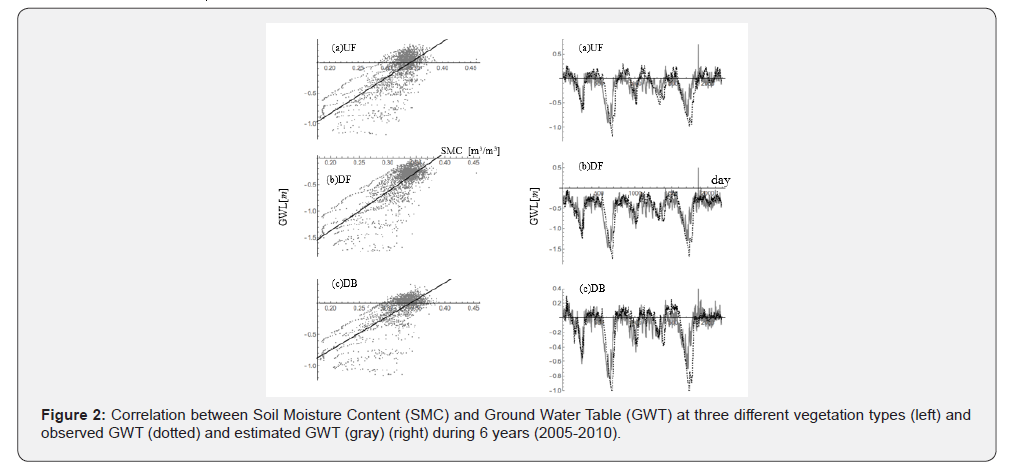
SMC correlates linearly with GWT at three sites for 6 years (2005-2010). From this result, it is assumed that SMC by satellite sensing will be available to estimate GWT in peatland, and then will make GWT map through binding the GWT in peatland observed by SESAME and SMC map evaluated by satellite sensing (Figure 2).
Estimated GWT Map
European Centre for Medium-Range Weather Forecasts (ECMWF) is providing global SMC database in rough grid (0.125 degree). The volumetric soil water layer 1[m3/m3] is downloaded from the database established by ECMWF, http://apps.ecmwf.int/ datasets/data/interim-full-daily/, under the following conditions:
during six years (2005 - 2010), time=00:00:00, step=0, spatial mesh size 0.125degree by 0.125 degree (the smallest), and Indonesia region. We used the observed GWT data at 7:00 am, because 7:00 am at Central Kalimantan corresponds to 0:00 am on the satellite data.
NEE (carbon emission) map
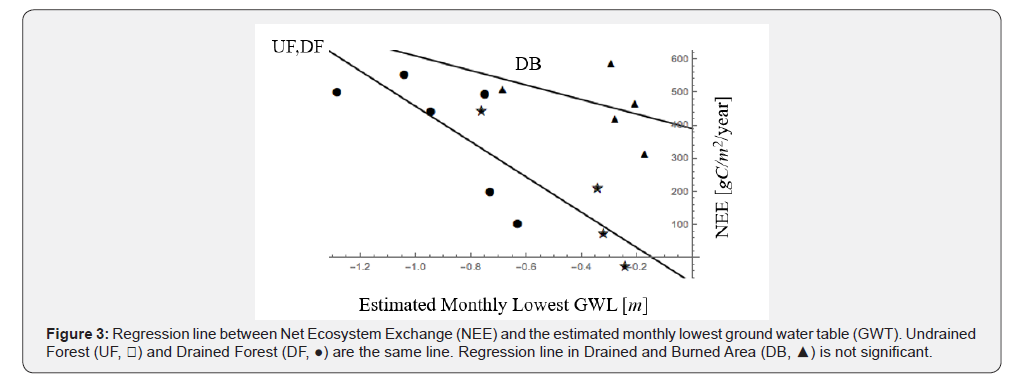
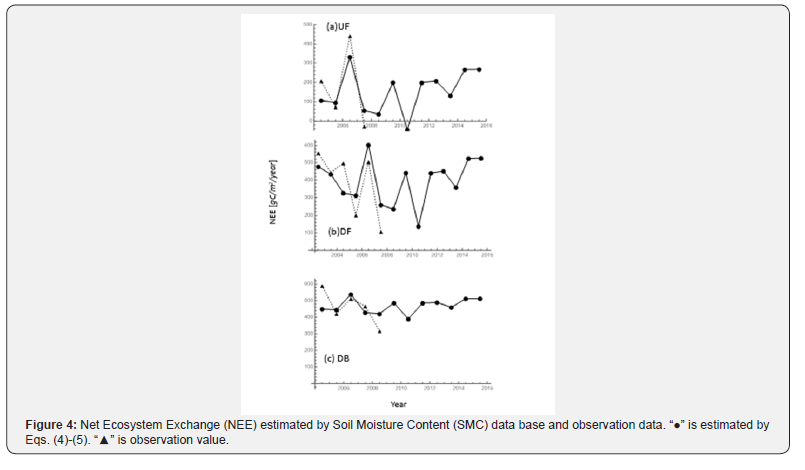
As NEE relates negatively with GWT at each monitoring sites (Figure 3), we can predict NEE from GWT, or calculate using only GWT data or GWT map (Figure 4). Then, this NEE-GWT coefficient is input into the estimated GWT Map, then NEE (Carbon Emission) Map is obtained (Figure 5).
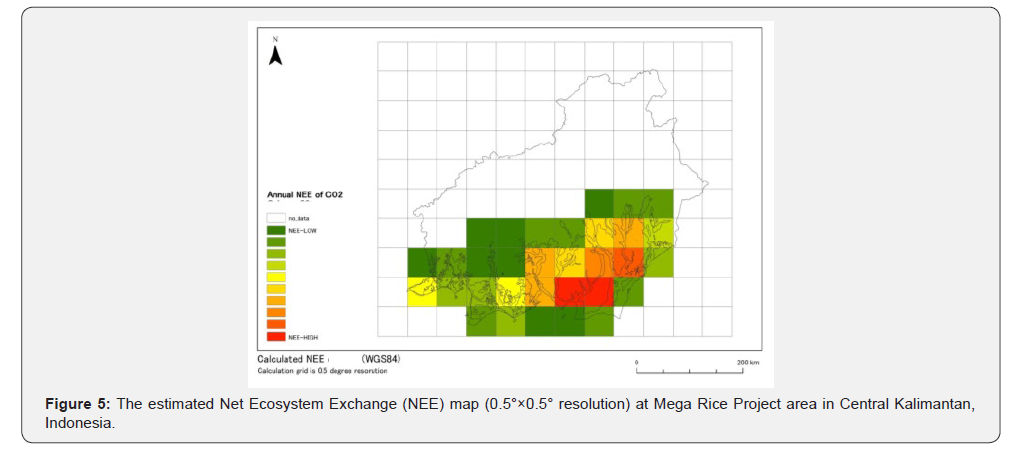
Carbon Loss by Fire (CLF) map
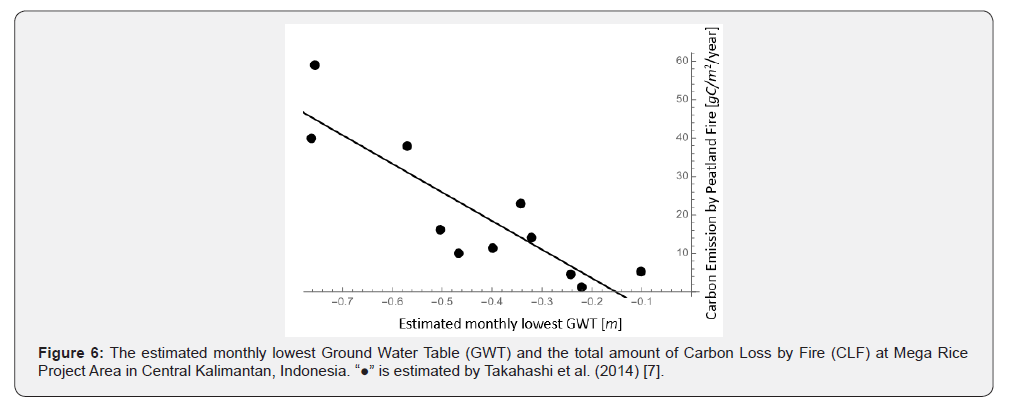
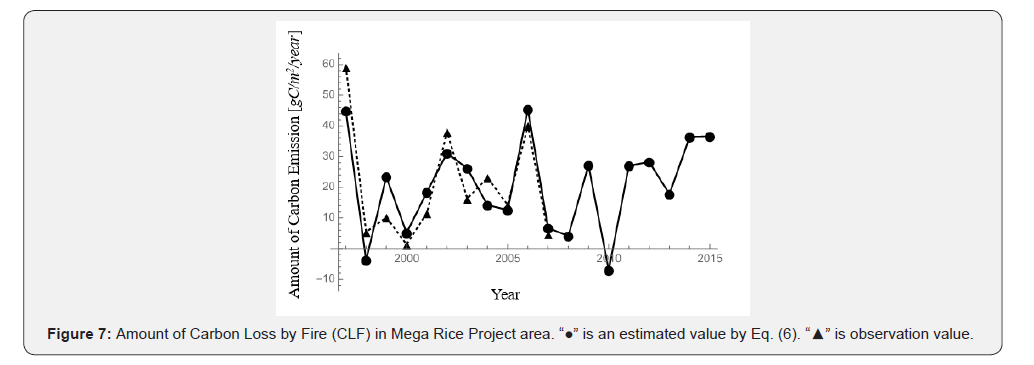
As Carbon Loss by Fire (CLF) relate negatively with GWT at each monitoring site (Figure 6), CLF can calculate using only GWT data (Figure 7). If CLF-GWT coefficient is input into the Estimated GWT Map, CLF Map is also obtained.
Results
Linear regression model with SMC-GWT
We got the regression lines between the data of SMC [m3/m3] (x) provided by ECMWF and the daily GWT [m] (y) observed by Hirano (refer to the left side of Figure 2):


The estimated daily values of GWT are shown at the righthand side of Figure 2.
Net ecosystem exchange (NEE)
Hirano et al. [5] found that there exists a linear relationship between NEE and the observed value of the monthly lowest GWT at a year. They defined the monthly lowest GWT as follows: after deriving the monthly average GWT in a year from the daily GWT they observed, they found the lowest one among 12 ones. We got the lowest monthly GWT from the daily GWT which we estimated by Eqs. (1)-(3) and got the similar relationship between NEE and the estimated monthly lowest GWT (Fig. 3). The regression equations between NEE (y) and the estimated monthly lowest GWT (x) were


The regression lines of UF and DF were merged into one as the same as Hirano et al. [4,5] did (Eq. 4), and the regression line in DB (Eq. 5) was not significant as the same as Hirano et al. [4,5], too.
v
As Takahashi et al. [7] found highly correlation between the observed monthly lowest GWT at Sebangau and carbon emission amount from MRP, we got the similar relationship between the estimated monthly lowest GWT and amount of carbon emission by peat fire (CEPF) (Figure 6). The regression line was

Then, we can estimate the annual carbon emission amount [gC/m2/year] by peat fire at the whole MRP (Figure 7).
Discussion
Water is the critical issue in peatland management, because that water relates with carbon emission by microorganism’s degradation and fire loss, carbon loss through water, and tree growth/mortality. Also, water balance is affected by deforestation, ecosystem change, and drainage. We have established the model for estimating NEE and CLF based on the estimated GWT from SMC at the grid data provided by ECMWF. Regression line between NEE and the monthly estimated lowest GWT in DB (non-forest area) was not significant (Eq. (5)), probably with large variation of SMC in open area and high temperature in land surface, which will be improved by estimating these elements.
In this paper, we mostly consider the GWT below of the peatland surface, namely we interested in the unsaturated water zone of peatland. The dynamical property of this region is described by two important parameters namely the water potential and the volumetric water contents (VWC), where they are connected by Richard’s equation [22]. By assuming, the osmotic force smaller rather than hydrostatic force then the water potential can be approximated by GWT. In soil physics, there is a relationship between VWC and GWT through Van Genuchten formula. The application of the Van Genuchten in the study area is inadequate due to the diversity of peatland hydrological unit properties. Instead, we are looking for an empirical relation directly between VWC obtained from ECMWF and GWT from the instrument. The daily soil moisture data was linearly translated into the daily GWT, and we got the monthly lowest GWT from these estimated daily GWT. The lowest monthly GWT was also linearly translated into the carbon emission amounts generating from NEE and peat fire. Hirano et al. [5] and Takahashi et al. [7] showed the relationship between GWT and amount of carbon emission from NEE and CLF, respectively.
GWT model (map) in this paper was compared with Takeuchi’s model [16]. The GWT of Takeuchi’s model composed from following five data: GWT observation data, soil surface temperature, precipitation, land surface water coverage and MODIS hot spot product, from which a modified Keeth-Byram drought index (mKBDI) was obtained. Then the estimated GWT value was obtained from this mKBDI index. After this model establish, soil moisture information was used for GWT estimation. Takeuchi model and this paper model are using different methodology, however both models fit very well. As this paper model is simpler compared with Takeuchi model, it is recommended to use this paper model of GWT, also it is easy to evaluate NEE model (map) and CLF model (map) applying estimated GWT model (map).
As the smallest grid size of soil moisture in ECMWF is 0.125×0.125 degree, UF, DF, and DB may coexist in the same grid. After estimating NEE at each peatland type, we could estimate NEE per year at a certain grid used by the next equation;

Area [m2] are total NEE amount from the grid, NEE from peatland type i (i=UF, DF, and DB), and area of type i at the grid, respectively. Then, we need each type of area, before we estimate
NEEtotal from the grid.
One km grid SMC is derived applying Weather Research and Forecasting (WRF) method with Noah land surface [23,24]. Resolution (0.125×0.125 degree) of ECMWF-GWT can be improved by applying Weather Research and Forecasting (WRF) and applying PALSAR L-band (15m x15m).
Conclusion
The GWT is the principal parameter to evaluate the peat ecosystem, because high GWT prohibits peatland from being degraded by microorganisms and fire. If GWT comes to low by mainly peatland drainage, then oxygen comes into peat, and oxidizes peat by microorganisms and fire.
Thus, the GWT map is necessary for peatland management and evaluation. As SMC relates with GWT by monitoring data of SMC and GWT using SESAME, SMC-GWT regression coefficients input into SMC map of ECMWF which provide GWT map.
GWT also relate negatively with NEE and carbon emission by peat fire from ground observation, these coefficients provide NEE map and CEPF map.
Acknowledgements
Results shown in this paper were mainly obtained from Science and Technology Research Partnership for Sustainable Development (SATREPS) project entitled as “Wild fire and carbon management in peat-forest in Indonesia” founded by Japan Science and Technology Agency (JST) and Japan International Cooperation Agency (JICA), and JICA Indonesia-Japan REDD+ project. We used the volumetric soil water layer 1 [m3/m3] established by European Centre for Medium-Range Weather Forecasts (ECMWF). The authors acknowledge also to Mr. Yasuhito Kojima of Hokkaido University for treatment of GIS data, and two Nara University students, Mr. Tomohide Iwase and Ms. Haruka Hisazuma.
References
- Hooijer A, Page S, Canadell JG, Silvius M, Kwadijk J, Wosten H, et al. (2010) Current and future CO2 emissions from drained peatlands in Southeast Asia. Biogeosciences 7: 1505-1514.
- Dohong A, Aziz AA, Dargusch P (2018) Carbon emissions from oil palm development on deep peat soil in Central Kalimantan Indonesia. Anthropocene 22: 31-39.
- Osaki M, Hirose K, Segah H, Helmy F (2016) Tropical peat and peatland definition in Indonesia. In Osaki M, Tsuji N (eds.) Tropical Peatland Ecosystems, Springer Japan, Tokyo, Japan, pp. 137-147.
- Hirano T, Segah H, Kusin K, Limin S. Takahashi H, Osaki M (2012) Effects of disturbances on the carbon balance of tropical peat swamp forest. Global Change Biology 18(11): 3410-3422.
- Hirano T, Sundari S, Yamada H (2016) CO2 balance of tropical peat ecosystems, In Osaki M, Tsuji N (eds.) Tropical Peatland Ecosystems, Springer Japan, Tokyo, Japan, pp. 329-337.
- Takahashi H, Usup A, Hayasaka H, Limin S (2003) Estimation of groundwater level in a peat swamp forest as an index of peat/forest fire. Proceedings of the International Symposium on Land Management and Biodiversity in Southeast Asia, 17-20 September 2002, Bali Indonesia, pp. 311-314
- Takahashi H, Jaya A, Suwido H, Limin S (2014) The scenario of carbon management by water management, firefighting and forest recovery in tropical peatland. Proceeding of International Symposium on WildFire and Carbon Management in Peat-Forest in Indonesia 2013, Palangka Raya, Indonesia.
- Usup A, Hashimoto Y, Takahashi H, Hayasaka H (2004) Combustion and thermal characteristics of peat fire in tropical peatland in Central Kalimantan, Indonesia. TROPICS 14(1): 1-19.
- Osaki M, Hirano T, Inoue G, Honma T, Takahashi H, et al. (2012) Sensing/monitoring networks on carbon balance and biodiversity in tropical peatland. In: Nakano S, Yahara T, Nakashizuka T (Eds.), The biodiversity observation network in Asia-Pacific region, Springer Japan, Tokyo, Japan, pp. 349-374
- Hayasaka H, Takahashi H, Limin SH, Yukianit N, Usup A (2016) Peat fire occurrence. In: Osaki M Tsuji N (Eds.), Tropical Peatland Ecosystems, Springer Japan, Tokyo, Japan, pp. 377-395.
- Susilo GE, Yamamoto K, Imai T (2013) Modeling ground water level fluctuation in the tropical peatland area under the effect of El Nino. Procedia Environmental Sciences 17: 119-128.
- Querner PE, Miduszewski W, Povilaitis A, Slesicka A (2010) Modelling peatland hydrology: three cases from Northern Europe. Polish J of Environ Stud 19(1): 149-159
- Kondo J (1994) Meteorology in hydro environment. Asakura Syoten, Tokyo, Japan.
- Ito A, Inatomi M (2012) Use of process-based model for assessing the methane budgets of global terrestrial ecosystems and evaluation of uncertainty. Biogeosciences 9: 759-773.
- Hirata R, Adachi M, Ito A (2016) Modeling of carbon and GHG budgets in tropical peatland. In: Osaki M, Tsuji N (Eds.), Tropical Peatland Ecosystems, Springer Japan, Tokyo, Japan.
- Takeuchi W, Hirano T, Roswintiarti O (2016) Estimation model of ground water table at peatland in Central Kalimantan, Indonesia. In: Osaki M, Tsuji N (Eds.), Tropical Peatland Ecosystems, Springer Japan, Tokyo, Japan.
- Carlson KM, Goodman LK, May-Tobin CC (2015) Modeling relationships between water table depth and peat soil carbon loss in Southeast Asian plantations. Environmental Research Letters 10: 1-12
- World Bank (2007) Executive Summary: Indonesia and Climate change. Working paper on current status and policies.
- Wetlands International (2004) Map of Peatland Distribution Area and Carbon Content in Kalimantan. 2000-2002, ISBN:979-95899-9-1, Wetlands International-Indonesia Program, Bogor, Indonesia.
- Shigenaga Y, Saito H, Takahashi H, Teguh R, Kencana W, et al. (2016) Field data transmission system by universal mobile telecommunication network. In: Osaki M, Tsuji N (Eds.), Tropical Peatland Ecosystems, Springer Japan, Tokyo, Japan, pp. 479-489.
- Hamada Y, Tsuji N, Kojima Y, Qirom MA, Sulaiman A, et al. (2016) Guide book for estimating carbon emissions from tropical peatlands in Indonesia, Indonesia-Japan Project for Development of REDD+ Implementation Mechanism.
- Miyazaki T (2005) Water flow in Soils. (2nd edn), CRC press, Taylor and Francis Group, Boca Raton, USA
- Warrach-Sagi K, Schwitalla T, Wulfmeyer V, Bauer HS (2013) Evaluation of a climate simulation in Europe based on the WRF–NOAH model system: precipitation in Germany. Climate Dynamics 41(3-4): 755-774.
- Greve P, Warrach-Sagi K, Wulfmeyer V (2013) Evaluating soil water content in a WRF-Noah downscaling experiment. Journal of Applied Meteorology and Climatology 52: 2312-2327.


