


Effect of Different Mating Systems on Population Structure and Genetic Progress of a Simulated Small Flock
Assis Rubens Montenegro1, Luciano Pinheiro da Silva1 and Raimundo Nonato Braga Lôbo1,2 *
1Departamento de Zootecnia, Universidade Federal do Ceará, Brazil
2Embrapa Caprinos e Ovinos, Estrada Sobral/Groaíras, Brazil
Submission: July 25, 2019; Published: August 12, 2019
*Corresponding author: Raimundo Nonato Braga Lôbo, Departamento de Zootecnia, Universidade Federal do Ceará, Embrapa Caprinos e Ovinos, Estrada Sobral/Groaíras, km 04, Caixa postal 71, Sobral 62010-970, CE, Brazil
How to cite this article: Assis Rubens Montenegro, Luciano Pinheiro da Silva, Raimundo Nonato Braga Lôbo. Effect of Different Mating Systems on Population Structure and Genetic Progress of a Simulated Small Flock. Int J Environ Sci Nat Res. 2019; 21(1): 556051. DOI:10.19080/IJESNR.2019.21.556051
Abstract
Strategies to promote genetic progress or preserve genetic diversity in small populations may change due to population size. Higher inbreeding coefficients are associated to the use of breeding values predicted by mixed model methodology, which tends to score better animals within the best families. The reduced effective population size makes herds more susceptible to genetic drift and inbred matings. We compared three methodologies/software on simulated data that reproduced small-closed populations: Mate Selection (evolutionary differential), Gencont (Lagrange Multipliers) and SGRmate (linear programming). Algorithms optimized the objective function in order to achieve the higher genetic progress, but with an inbreeding coefficient of less than 10%, selecting the necessary number of sires and forming the reproductive pairs, except for Gencont, whose objective function was only to minimize the coancestry. All software generated populations with similar genetic progress. Mate Selection generated populations with the highest levels of inbreeding coefficients, similar to RANDOM, which presented best controlled mating between relatives. Gencont produced populations with intermediate levels of inbreeding. SGRmate maintained lowest levels of inbreeding due to higher number of sires selected and equal proportionality in combination of the pairs. Use of linear programming (SGRmate) was more efficient in maintaining the genetic diversity of small-closed populations.
Keywords: Mating optimization; Linear programming; Optimal genetic contribution; Differential evolutionary algorithm
Introduction
One of the first steps in defining strategies used in a breeding program is to determine the purpose of production and criteria to select and evaluate animals, and after, assign breeding pairs. However, it is a complex operation due to correlation among mating values, i.e., all breeding pairs must be planned simultaneously within each generation.
Genetic progress is directly related to the intensity of selection, that is, the smaller the number of animals selected the greater the response to selection, which can also result in higher levels of inbreeding. Therefore, the number of animals selected for reproduction and the intensity of use should be weighted by inbreeding coefficient (F) and genetic gain. Populations under intense selection process show a systematic increase of F, which has detrimental effects on performance, reproductive, conformation and survival traits [1]. The use of a mating management software could be a useful tool to mitigate the negative impact that the selection process can generate.
Mating selection software select the best animals and to form breeding pairs within a pre-established limit of inbreeding [2]. There are several methodologies available for directed mating, such as linear programming [3], the theory of optimal genetic contribution with the Lagrange multipliers [4] and genetic algorithms [5]. In some production systems, random mating seems to be the most practiced [6], and it has been reported in some simulation studies that this strategy presents poorer results than the directed mating system [6,7].
Mc Parland et al. [8] described that linear programming was more efficient than random mating in maintaining genetic variability and promoted greater genetic gain. According to these authors, linear programming can be used in small populations, if the breeder uses semen from animals evaluated in national breeding programs. On the other hand, Kinghorn [9] applied a genetic algorithm developed by Price & Storn [5], entitled Evolutionary Differential, which uses evolution processes in the treatment of vector solutions as a tool to target mating and to promote genetic gain within the limit of inbreeding allowed.
The theory of optimal genetic contribution consists in defining the intensity of use of sires and dams in the composition of the future progeny. It has already been evaluated in simulation studies [10], in pig farming [11], milk-cattle raising [6] and, more recently, in poultry farming [12], and presented positive results. Optimal genetic contribution can be used both for software’s that have genetic progress as their central objective, as for genetic resources conservation scenarios [12].
The objective of this study was to evaluate the use of different software with simulated data, over ten generations, namely Mate Selection available on Pedigree Viewer (evolutionary differential), Gencont (Lagrange Multipliers) and SGRmate (linear programming), compared to a random mating scenario.
Material and Methods
Stochastic simulation was used to simulate a population and to verify genetic and populational changes over ten generations, using mating systems based on the following software’s: Gencont (Optimal Genetic Contribution and Lagrange multipliers, [13]), Mate Selection (Evolutionary differential [14]) and SGRmate (Linear programming [15]) and, a reference scenario, using random mating (RANDOM). The generations were overlapped, resulting in the use of animals throughout all generations. A single trait with normal distribution, NID (0, σ2) and expressed in both sexes, with no dimorphism, was simulated twenty times in each scenario.
The base population built from 200 individuals, divided equally between males and females, with unknown paternity. These individuals were then randomly mated through five generations, summing up 600 animals, considered so as the base population, by using “simul.pedigree” function from “synbreed” package [16].
Next, the kinship matrix, here called matrix A, was build using the functions “makeA” and “symatrix” to adjust results in matrix structure. True breeding values were initially simulated using the “mvrnorm” function, from “MASS” package [17] and assigned as a vector MVN. The covariance matrix was calculated by multiplying the A matrix and an arbitrary value of 0.3 units that simulated a heritability of 30%.
We simulated two scenarios: the first one, the 10 sires and 50 dams (named T10) with the highest breeding values; the later, the number of sires was set as 17. Males and females that not selected as breeding stock were automatically discarded. Ten generations of mating were simulated, using the aforementioned mating systems.
The software output is often a mating list, except for Gencont, which contains only the genetic proportions that each individual should contribute to the next generation. In this case, a randomized sire-dam combination based on those proportions.
The progeny breeding value was estimated by the mean breeding value of the parents plus Mendelian segregation:

where ap is the estimated breeding value of progeny; as and ad, the breeding values of sire and dam, respectively; and, sm, the Mendelian segregation, which is defined as:

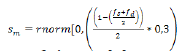 where fs and fd are the inbreeding coefficients
of sire and dam, respectively, and 0.3 is the genetic variance.
where fs and fd are the inbreeding coefficients
of sire and dam, respectively, and 0.3 is the genetic variance.
The population was simulated with a mean litter size of 1.5 offspring/birth, 55% of births were single, 40% twin and 5% triplet. A progeny sex ratio was set as 1:1. Each round of simulation was considered as a new generation.
Mate Selection and SGRmate were set up to allow mating between individuals with up to 0.35 of genetic relationship and an average inbreeding coefficient of up to 10%.
Random mating
A simulated random mating population was set as a control group, in which every sire had the same probability of mating any dam.
Gencont
Gencont software [13] uses Lagrange multipliers to find the maximum genetic gain with a restricted level of inbreeding. Thus, we used Gencont’s tool ‘minimise ΔF’, that search a solution with the lowest inbreeding coefficient.
Mate selection
The Mate Selection is a tool from Pedigree Viewer software to direct mating that uses evolutionary differential as a search algorithm (Kinghorn, 2002). The software was set up with “soft constraint on coancestry” option, with mating between individuals limited on genetic relationship (0.35) and in populational inbreeding coefficient (10%). The operational parameters for performing the differential algorithm routines range from 1,000 to 7,000 for the number of generations of solution vectors.
SGRmate
The SGRmate [15] uses the SIMPLEX method to optimize the objective function, which maximize the genetic gain and minimize the populational inbreeding in a given population. The SGRmate was set to allow the maximum populational inbreeding of 10% and maximum value of 35% of genetic relationship for a given mating pair.
Response variables
Inbreeding coefficient was calculated using the “calcInbreeding” function from “pedigree” package [18] for each animal. This package uses the methodology proposed by Wright [19].
The populational inbreeding coefficient in a given generation is the mean of every inbreeding coefficient in a given population. Intergenerational change of the inbreeding coefficient (Δf) is the ratio of F from two consecutive generations. Effective population size (Ne) is inversely proportional to two times Δf.
Other variables evaluated were the number of mating between parents and offspring, between full siblings and half siblings, and the average relatedness coefficient (AR), described as:

where AR is the average relatedness coefficient; 1’, vector of 1’s; and A, the genetic relationship matrix. Endog 4.8v [20] was used to estimate the response variables.
Statistical analysis
The mean number of offspring per sire, the maximum number of offspring, the number of sires and the variance of the number of offspring were calculated. All differences among mating systems from different software were compared by Tukey test (α=0.05).
Regressions of true breeding values and inbreeding coefficients over time, during ten generations of directed mating, were used to compare mating systems. To compare slopes from multiples mating systems with dummy variables we used 5% confidence intervals.
Results and Discussion
Selection by truncation with 10 sires and 50 dams (T10)
After 10 generations, the T10 truncation selection scenario promoted oscillations in the inbreeding coefficients (F) and in the mean breeding values, regardless of the mating system (Figures 1 & 2).


As the number of animals chosen as breeders (60) was not enough to meet the 10% coancestry restrictions, in some cases it was not possible to satisfy all the imposed inequations and when this happened, Gencont created a solution vector that indicated the use of few sires, which elevated the F in a few generations. Therefore, we used the ‘minimise’ option to give more weight on coancestry.
After 10 generations of mating, SGRmate use produced the lowest inbreeding coefficient (4.11 ± 0.91), statistically differ
ing (Table 1) from the values obtained for random mating (5.17 ± 0.84), directed by Mate Selection (5.15 ± 0.67) and Gencont (5.12 ± 1.61). SGRmate performed better control of inbreeding for T10, probably to the constant number of sires in all generations, while Mate Selection and Gencont changed according to the preset coancestry, varying from two up to 10 (Figure 3). On average, Mate Selection selected 5.5 sires per generation. Another possible advantage of the use of SGRmate in small populations is the selection of the same number of females per male, that is, all males will contribute equally to the formation of the future progeny, favoring the maintenance of levels of inbreeding. Since that using of equal sex ratio in commercial herds is not economical, the use of less unequal ratio would be better to maintain genetic variability. Reducing family size variance with fewer selected animals within each family would result in lower rate of inbreeding for each unit of genetic progress [21].

For variables followed by #, the Mate Selection scenario was not considered in the analysis of variance.


.
The average individual F value estimated in this study over the ten generations of directed or random mating was 4.89%, close to the reference value of 6.25% to avoid inbreeding depression in livestock [22]. In the seventh generation, 77% of the animals had individual F higher than 6.25%, and 40% had a value higher than 10%, regardless of sex (Figure 4). This significant portion of population would probably have already reduced performance due to inbreeding depression. Hossein-Zadeh [23] found reduction in birth weight in sheep only above 10% of inbreeding and recommended that the control of mating can guarantee the maintenance of genetic diversity.
SGRmate was more efficient to control inbreeding (20%) when compared to RANDOM system. Similar results were reported by studies using linear programming as an optimization tool [6-8], in which it presented greater results than randomized mating.

Through the measurement of the effective size of the population (Ne) it is possible to evaluate the changes of the population structure over time. Ne can be influenced by sexual ratio, fluctuation of population size in time, selection and mating system. SGRmate was the software that simulated populations with the highest absolute value of Ne (22.20 ± 5.06), although it was not statistically different (p> 0.05) from the Mate Selection and Gencont softwares, but different (p< 0.05) of the RANDOM, which produced the lowest Ne (17.60 ± 3.06). Mate Selection was the software that simulated the least amount of inbreeding mates (Table 1), but it was not enough to compensate for the smaller number of males used as breeder and the greatest variation in the number of progeny (Table 2), as it presented Ne (18.80 ± 2.75) statistically similar to RANDOM. In turn, Gencont used the same number of sires as SGRmate and RANDOM, but did not direct the matings, resulting in Ne and F similar to RANDOM. Therefore, it is possible to infer that the combination between directed mating and use of the largest number of sires is a good strategy to preserve genetic diversity in small closed populations.
At the beginning of simulations, all the populations had 600 animals and Ne of 533.33. Over the ten generations, the selection process, the different reproductive rates and the mating systems caused a reduction of the Ne to 19.39, far away from the 50 recommended by FAO [24]
All the scenarios evaluated in this study had the same level of coancestry, but Gencont, Mate Selection and SGRmate systems could vary the number of sires per generation (Figure 3), as well as the proportion of use. SGRmate used all males that were available, similar to the RANDOM (Table 2). Gencont indicated almost all sires, but over the generations there was variation. On the other hand, Mate Selection presented a great variation in relation to the number of sires (Table 2), which grew gradually over the generations until reaching the maximum number allowed. The lower use of sires in the initial generations occurred to prioritize genetic gain in the short term, increasing selection intensity. The animals selected for breeding had a low average kinship coefficient. However, that even with the use of a few sires, Mate Selection still maintained the level of individual inbreeding at zero in the first generations (Figure 1), which characterizes it as the best control of inbreeding at the beginning in this work. However, over the ten generations it had F similar to RANDOM.
Mate Selection generated populations with the highest number of offspring per sire (11.44 ± 0.74), the highest number of offspring (62.10 ± 10.32), the highest number of breeding animals in the ten generations (65.00 ± 4.07) and higher variance in the number of offspring (91.20 ± 19.92) than all the other scenarios (Table 2). Gencont and SGRmate used the same number of sires over the ten generations as the RANDOM. Although in this scenario, the same number of sires was used in equal proportions per generation. The variance of the number of offspring (37.70 ± 11.11) was caused by the different birth rates (1.5 births on average) and mainly due to overlapping generations, in which one sire could be used in several successive generations given that it had one of the ten highest breeding values. This combination of factors, in the RANDOM scenario, allowed the same sire to produce up to 46 offspring over the ten generations. On the other hand, Mate Selection directed the maximum of up to 94 offspring to the same sire.
In the early generations, inbreeding was below the imposed 10% restriction, which allowed Mate Selection to indicate lower numbers of sires in the first generations. In studies that evaluated scenarios with increasing levels of inbreeding, the number of sires increased as restriction increased [12,25,26]. In a way, this corroborates with the result of this study, since the level of inbreeding increased over generations (Figure 2). In the same sense, Barreto Neto [27], in studying sheep of Santa Inês breed, tested different directed mating scenarios weighted by levels of coancestry, optimized by genetic algorithms, and described an increased number of sires as coancestry restriction increased.
If the restriction to F is small, the best animals would be selected regardless of the genetic relationship and the results may not differ from a non-restricted system. On the other hand, at high levels of F, the results may be similar to a scenario that only seeks to maintain genetic variability [28]. Therefore, it seems that intermediate values of F give the greatest benefits.
There is no single recommendation for the use of mating relatives to the pre-established level of F, it depends on the objectives of the genetic breeding program and thus can vary widely. In situations in which breed association has a closed book, and it is not possible to enter animals with unknown kinship and/or no relationship with animals of the population, it is more important to maintain Ne and, consequently, genetic variability. This is also true for populations with few individuals, such as in zoos and native breeds conservation program.
Mucha & Komen [29] performed a study with simulated data to evaluate different mating strategies for a small population, simulating animals raised in three zoos. The authors compared a rotational mating scenario with different intensities of selection, in which 10%, 20% and 50% of the males were transferred from one zoo to the other, that is, the females always remained in the place of birth and the males were exchanged. The other scenario used the optimal genetic contribution to select males in three different situations: between all zoos, inside a zoo and with male exchange. Gencont was set to produce the lowest inbreeding rate possible, as performed in this study. The scenario that most approached our study was the one that used Gencont without exchanging animals with reproductive rate of one male for every five dams. An inbreeding increase of 1.53 was reported, close to our results (1.61). The authors suggested that animal exchange is a solid way of preserving genetic diversity, since optimal genetic contribution theory needs complete and correct pedigrees and recommended its use in situations where it is not possible to exchange animals between zoos. They also reported that between the rotational mating scenario and Gencont, the level of inbreeding seems more related to the number of animals selected and that a population cannot be managed with less than 60 animals, without considerable loss of genetic diversity.
In turn, in a scenario where animals from other populations or breeds are accepted, the assignment of mating pairs should mainly concern on the genetic progress and in the control of mating among between close relatives, because if Ne needs to be increased, animals from other populations can be included.
Another parameter used to assess the level of population genetic similarity is the average relatedness coefficient (AR). Conceptually, it is the probability of an allele chosen at random in the population belongs to a particular animal. In other words, the AR value indicates the allelic sharing of a given animal with the rest of the population, that is, an animal with a low AR value could be used more intensively to disseminate its germplasm [30]. Mate Selection simulated populations with mean AR of 6.79% ± 1.42, being the highest value among all the scenarios (Table 1). The AR of the populations simulated from the use of SGRmate did not differ statistically from RANDOM, which corroborates that the number of animals selected for reproduction was determinant.
In relation to the mating of closely related individuals, such as between parents and offspring (MPO), full siblings (MFS) and half siblings (MHS), it is known to be harmful mainly due to higher probability of homozigozity of deleterious recessive alleles in the progeny, which may affect fitness, reducing reproduction rates and survival. Therefore, restriction on these matings is an important feature of a software. Note that the parameter imposed a priori allowed up to 35% of probable genetic similarity between pairs. In order to make a more correct comparison between SGRmate, RANDOM and Gencont, the observations from Mate Selection were taken from the analysis of variance and from the means comparison test, since the variance of the treatment was null, violating the assumptions of normality and homoscedasticity.
The RANDOM presented 26.80 ± 8.64 of MPO and Gencont had a statistically similar value (26.35 ± 12.80), as both scenarios used matings as random. In turn, SGRmate also did not differ from RANDOM, with an average of 26.05 ± 8.48. On the other hand, Mate Selection only formed three MPOs in a single simulation, showing to be the most efficient software for this characteristic.
Gencont generated the same amount of progeny arising from mating between full siblings as RANDOM (Table 1). SGRmate assigned less MFS (4.05 ± 3.03) over the ten generations, which was 42.5% less than RANDOM. Moreover, it did not direct any MFS in two of the replicates. Mate Selection avoided almost all MFS (0.10 ± 0.31), directing only one mating of this type in two of the simulated replicates.
Coefficients of inbreeding of progenies from half siblings, full siblings and parents and offspring are 12.5%, 25% and 25%, respectively, given that parent’s inbreeding coefficients are null. Therefore, 10% restriction on populational F was more effective in the control of inbred matings, compared to 35% restriction on individual F allowed on the three types of mating evaluated.
Mate Selection assigned 40.40 ± 18.80 half siblings matings, and the other software’s or RANDOM generated higher values. SGRmate directed an average of 65.50 ± 28.00 MHS; Gencont, 80.30 ± 29.40; and RANDOM, 75.70 ± 24.50. Mate Selection was the software that better restricted mating between direct relatives, but this was not enough to avoid the highest values of F and Ne. This diverged from other studies that showed that the exclusion of full sibling’s and half sibling’s matings reduces the inbreeding coefficient [31]. However, according to Wang [32], the exclusion of sibling’s matings reduces inbreeding in the first generations, but it does not differ from a random selection scenario in future generations. This corroborates with the results of this study, since there was no difference between RANDOM and Mate Selection inbreeding coefficient, even though MFS and MPO were assigned.
Another study demonstrated that exclusion of full or half sibs mating resulted in lower inbreeding rates [33]. However, in this study, the exclusion of MFS did not result in a lower inbreeding rate probably because the exclusion of this type of mating has a greater impact on genetic diversity due to more intensive is the use of sires [32].
The selection pressure practiced generated inbreeding rate of 4.88, Ne of 19.39, AR of 5.30 and some animals born achieved an individual F value of 52%, higher than recommended for livestock [30]. These values were similar to those reported by Teixeira Neto et al. [34], evaluating 53 herds of Santa Inês sheep, summing close to 13,000 animals. The authors reported F and AR values of 6.92%, 3.87%, respectively. The similarity of parameters of the simulated and actual parameters confirms the efficiency of stochastic simulation, providing confidence for practical application of the best methodology evaluated.
None of the confidence intervals for genetic trends and inbreeding included the zero, rejecting the null hypothesis, in which the linear coefficient is similar to zero (Figure 5). Another finding is the overlap of values between all the intervals, indicating that the software did not promote greater genetic gains than the RANDOM (Figure 5a). Regarding to inbreeding trends (Figure 5b), there is evidence that SGRmate software generated a population with lower F.


After regression analysis, we made plots with predicted values and their respective confidence intervals (95%) for genetic (Figure 6) and inbreeding trends (Figure 7). Comparative analyses of slopes for genetic trends at T10 in all scenarios were statistically similar (p> 0.05). On the other hand, inbreeding trend were statistically different (p≤ 0.001). SGRmate was lower to all other scenarios; Gencont produced a curve with a linear coefficient lower than Mate Selection and RANDOM; and, finally, Mate Selection and RANDOM did not differ statistically. These results are consistent with previously reported population parameters in this study
Preventing increased inbreeding due to selection process in a population without new animals is the central issue for some animal breeding programs. This is more important when the population is composed of large families and reduced effective size, which can quickly lead to loss of allelic diversity [35].

For a small population in which 10 sires and 50 dams (T10) selected and mated over ten generations, SGRmate software promoted the same genetic progress with higher control of F and Ne, probably because it used all males available for breeding. SGRmate assigned the same amount of matings per sire and avoided more matings between full siblings than RANDOM and Gencont.
Selection by truncation with 17 sires and 50 dams (T17)
As expected, there were also oscillations in inbreeding coefficients and in the mean breeding values between the replications, regardless of the system used to assign matings (Figures 8 & 9).

Mate Selection produced, on average, populations with F of 4.21 ± 0.58 (Table 3), statistically higher (p< 0.05) to the RANDOM (3.48 ± 0.45). SGRmate and Gencont generated populations with F of 2.75 ± 0.53 and 2.88 ± 0.29, respectively, with no statistical difference (p> 0.05), however, lower to the two aforementioned scenarios. AR showed a similar result, in which Mate Selection presented the highest value (7.06 ± 1.00), followed by RANDOM (4.09 ± 0.39), and finally SGRmate (3.52 ± 0.54) and Gencont (3.56 ± 0.27), which did not differ statistically (p> 0.05). The greater control of genetic variability of Gencont must have occurred main ly due to the culling of some sires that are related with the dams. It can be observed (Figure 10) a trend in reducing the number of sires up to the sixth generation, maintaining this number up to the tenth generation for Gencont. The use of all males (17 per generation) for mating in each generation resulted in a lower level of inbreeding, a strategy used by SGRmate (Table 4), which used the same number of sires as RANDOM.


Mate Selection was the software that best controlled inbreeding in the first generations (Figure 8), even though it selected, on average, 2.35 and 4.45 sires in the second and third generation (Figure 9), respectively. However, over the ten generations, it generated populations with the highest value of F and AR (Table 3) when compared to RANDOM and the other software’s.
The maximum number of offspring per sire can be an indication of selection intensity. Over ten generations, 740 offspring were simulated in each iteration. On average, the sires most used by Mate Selection left 68.40 ± 13.43 offspring, which was higher (p< 0.05) than all scenarios (Table 4), reaching a maximum value of 96 offspring for a single sire, which represented approximately 13% of all simulated progeny. The SGRmate attributed a higher number of offspring per sire (30.05 ± 8.20) when compared to RANDOM and Gencont. However, it was much lower than Mate Selection, which directed up to 56 offspring per sire. Gencont, on the other hand, obtained a similar result to RANDOM, probably due to the configuration of minimizing the coancestry, which attenuates the intensity in the use of males. The variance of the number of offspring per sire had a similar result to the maximum number of offspring per sire, because softwares that led a higher number of offspring per sire, simultaneously, would cause a disproportionality in relation to the progeny size.
In Ethiopia, in a flock of Menz sheep, the use of Mate Selection generated a similar genetic gain with a smaller increase of inbreeding, comparing simulated data with real data over ten years [36], so it was recommended as a tool to maintain genetic diversity in the long term. For the scenario used in the mating routines of this study, Mate Selection was the best option to achieve genetic gains in short term with maintenance of F. Gencont presented higher genetic gain with a lower inbreeding level when compared to truncation selection scenario based on breeding value.

For variables followed by #, the Mate Selection scenario was not considered in the analysis of variance.


For T17, 50% of the animals have F higher than 6.25% in the seventh generation, far below the 77% presented in T10. In addition, the higher use of sires, in T17, reduced the number of animals with F higher than 10% from 40% to 7.6% (Figure 11). The increase in the number of sires, as the less numerous genders, proved to be efficient in delaying the undesirable effects of selection, such as the increase in individual inbreeding.
All populations simulated using the different software’s resulted in the same genetic progress of the RANDOM scenario (p> 0.05), with no statistical difference in the linear coefficient comparison. It is observed through graphical analysis that there is overlap of the confidence intervals of the linear coefficients (Figure 12b). It is also possible to observe the projection of the breeding values predicted by the regression equation for the different softwares and RANDOM that were in parallel (Figure 13), that is, the genetic modification by generation was similar for all scenarios. Genetic progress achieved over ten generations of directed mating was caused by selection. Mate Selection had an intercept value (0.51) higher than the RANDOM (0.38), Gencont (0.39) and SGRmate (0.39) scenarios in about 31.9%, probably due to the higher selection intensity in the first generations, but with a similar slope, as aforementioned. Mating systems may cause genetic progress in the early generations, however, over time, this progress tends to be only maintained [37].


In other studies, directed mating softwares (algorithms) presented greater genetic progress when compared to real situations [26,38] and to random mating [39].
In a study simulating a plant breeding program, it was verified the superiority on genetic and inbreeding trend of the scenario that minimized the coancestry of the progeny when compared to the scenarios of assortative or random mating [40]. The authors attributed this superiority to the maintenance of genetic variability throughout the generations, measured from the long-term contribution of the ancestors and the higher connectivity between unrelated families of the reproductive pairs.
Combinations of mating pairs caused changes in population structure. Similar to the genetic progress, it is possible to follow the changes in the degree of average inbreeding of the population per unit of time by the inbreeding trend. The confidence intervals of mean inbreeding trends for simulated populations using different softwares and the RANDOM (Figure 12a) did not show any overlap of values, which is indicative of statistical difference between treatments. The different selection intensities on Mate Selection and Gencont and the differences in sires use influenced inbreeding during the period of analysis.
Mate Selection generated populations with the highest trends of inbreeding, followed by the RANDOM and, finally, SGRmate and Gencont, with similar results (Figure 14). Regression lines presented intercept values close to zero. We can infer that the base population and the five initial generations of random mating produced populations with low level of inbreeding for all software’s.
Sun et al. [39] reported the superiority of linear programming to control inbreeding coefficient in relation to random mating, which corroborates with the results of this study. Older studies, in dairy cattle, verified the efficiency of linear programming in directing mating [6], generating populations with 2.8% less inbreeding compared to other methods. That same study performed an economic evaluation of mating, estimating an increase of up to US $59 when the objective function was maximized for the net profit of the productive life corrected for inbreeding depression.

For small and enclosed populations, mating of individuals with high genetic relationships can easily raise the inbreeding coefficient. This study showed that the selection of mating using the largest number of sires available is the most efficient strategy to control inbreeding. The linear programming, implemented in the SGRmate, provided better control of inbreeding in the long term, with the same genetic gain of the other softwares. Gencont, which uses Lagrangian multipliers and is set only to meet the lowest coancestry possible presented results close to the RANDOM, which uses all males available in equal proportions. Mate Selection, which uses the evolutionary algorithm to optimize vector solutions, provided better control of inbreeding and promoted the greatest short-term genetic progress (up to the third generation), probably due to the higher selection intensity in this period. This may be relevant, since breeding programs may prioritize genetic gain in the short term due to the low net present value of the expected genetic gain in future generations [41]. Although Mate Selection avoided almost all full siblings and parent-offspring mating, due to the bottleneck effect it generated the highest levels of inbreeding, AR and lower Ne, as well as increased inbreeding. Note that the inbreeding depression on breeding values was not simulated, which could greatly reduce the genetic progress of the populations generated, mainly by Mate Selection.
All the methodologies evaluated in this study require well-structured and correct pedigrees. The use of directing software’s for mating in commercial herds is already a reality, enabled by research institutions or companies that commercialize germplasm. The higher the quality of data, the better the results of the matings, because the software will correctly estimate the inbreeding coefficient of the animals. The lack of pedigree information leads to underestimation of inbreeding coefficients, which may lead to mating with an inbreeding level higher than expected. Thus, for small-closed herds with little genealogical information, the safest option, perhaps, would be the equal use of the largest number of males available [42-46].
Conclusion
SGRmate was the software that provided the best control of inbreeding for both scenarios (selection of 10 or 17 sires per generation) over ten generations with the same genetic gain.
For T10, Gencont simulated populations with the same level of inbreeding as RANDOM. Therefore, only selection, without mating system, was not an efficient strategy to control inbreeding in a small population, even though the selection was made to minimize coancestry.
For a small-closed population, the number of animals used for reproduction have a greater impact on population parameters than the exclusion of mating between full siblings and between parents and offspring.
Acknowledgment
The authors acknowledge the National Counsel of Technological and Scientific Development (CNPq) and the Coordination for the Improvement of Higher Education Personnel (CAPES) for the scholarship grants to last and first authors of this manuscript, respectively.
References
- Leroy G (2014) Inbreeding depression in livestock species: Review and meta-analysis. Animal Genetics 45(5): 618-628.
- Kinghorn B (2011) An algorithm for efficient constrained mate selection. Genetics Selection Evolution 43(1): 1-9.
- Jansen GB, Wilton JW (1985) Selecting mating pairs with linear programming techniques. Journal of Dairy Science 68(5): 1302-1305.
- Meuwissen TH (1997) Maximizing the response of selection with a predefined rate of inbreeding. Journal of Animal Science 75(4): 934-940.
- Price K, Storn R (1997) Differential Evolution. Dr Dobb’s Journal 264: 18-24.
- Weigel KA, Lin SW (2000) Use of computerized mate selection programs to control inbreeding of Holstein and Jersey cattle in the next generation. Journal of Dairy Science 83(4): 822-828.
- Haile-Mariam M, Bowman PJ, Goddard ME (2007) A practical approach for minimising inbreeding and maximising genetic gain in dairy cattle. Genetics Selection Evolution 39(4): 369-389.
- Mc Parland S, Kearney JF, López-Villalobos N, Berry DP (2009) Optimal system of contract matings for use in a commercial dairy population. Irish Journal of Agricultural and Food Research 48(1): 43-56.
- Kinghorn BP (1998) Managing genetic change under operational and cost constraints. 36th National Congress of the South African Association of Animal Science. University of Stellenbosch.
- Sonesson AK, Meuwissen THE (2002) Non-random mating for selection with restricted rates of inbreeding and overlapping generations. Genetics Selection Evolution 34(1): 23-39.
- Luther H, Hofer A (2006) A new selection strategy for nucleus gilts to optimize genetic gain and the increase of relationship in the Swiss pig breeding program. European Association for Animal Production 12: 233.
- König S, Tsehay F, Sitzenstock F, von Borstel UU, Schmutz M, et al. (2010) Evaluation of inbreeding in laying hens by applying optimum genetic contribution and gene flow theory. Poultry Science 89(4): 658-667.
- Meuwissen THE (2002) Gencont: An operational tool for controlling inbreeding in selection and conservation schemes. Proc 7th World Congress of Genetics Applied to Livestock Production 33: 769-770.
- Kinghorn BP (2000) The tactical approach to implementing breeding programs, In: Kinghorn BP, Van der Werf JHJ, Ryan M (Eds.), Animal Breeding - use of new technologies, Post Graduate Foundation in Veterinarian Science of the University of Sydney, pp. 291-308.
- Lôbo RNB (2013) SGR - Flock Management System User Notes (Version 2.0 Build 20121106) [electronic resource]. -- Brasília, DF, Brazil: Embrapa.
- Wimmer V, Albrecht T, Auinger HJ, Schoen CC (2012) Synbreed: a framework for the analysis of genomic prediction data using R. Bioinformatics 28(15): 2086-208.
- Venables WN, Ripley BD (2002) Random and mixed effects. In Modern applied statistics with S, Springer, New York, pp. 271-300.
- Coster A (2013) pedigree: Pedigree functions. R package version 1.4.
- Wright S (1922) Coefficients of inbreeding and relationship. The American Naturalist 56(645): 330-338.
- Gutierrez JP (2009) User ’s Guide A Computer Program for Monitoring Genetic Variability of Populations Using Pedigree Information Endog. Program.
- Lstibůrek M, Mullin TJ, Mackay TF, Huber D, Li B (2005) Positive assortative mating with family size as a function of predicted parental breeding values. Genetics 171(3): 1311-1320.
- Franck R (1997) Inbreeding steals profits. Dairy Herd Management, pp. 46-50.
- Hossein‑Zadeh NG (2012) Inbreeding effects on body weight traits of Iranian Moghani sheep. Archiv Tierzucht 55(2): 171‑
- FAO - Food and Agriculture Organization of the United Nations (1998) Secondary guidelines for development of national farm animal genetic resources management plans.
- Kearney JF, Wall E, Villanueva B, Coffey MP (2004) Inbreeding trends and application of optimized selection in the UK Holstein population. Journal of dairy science 87(10): 3503-3509.
- Santos NPS, Sarment JLR, Carvalheiro R, et al. (2016) Optimum genetic contribution used to selection Santa Inês sheep selection. Brazilian Agricultural Research 51(6): 745-750.
- Barreto Neto AD (2014) Population structure and optimization of mating schemes in sheep using evolutionary algorithms, Dissertation - Federal University of Sergipe, Sergipe, p. 51.
- Toro M, Pérez-Enciso M (1990) Optimization of selection response under restricted inbreeding. Genetics, selection, evolution: GSE 22: 93-107.
- Mucha S, Komen H (2015) Rates of inbreeding and genetic adaptation for populations managed as herds in zoos with a rotational mating system or with optimized contribution of parents. Journal of Animal Breeding and Genetics 133(4): 323-332.
- Paiva SR, Facó O, Faria DA, Lacerda T, Barretto GB, et al. (2011) Molecular and pedigree analysis applied to conservation of animal genetic resources: The case of Brazilian Somali hair sheep. Tropical Animal Health and Production 43(7): 1449-1457.
- Carneiro PLS, Malhado CHM, Euclydes RF, et al. (2007) Endogamy, allele fixation and selection limit in populations selected by traditional methods and associated with molecular markers. Brazilian Journal of Animal Science 36: 369-375.
- Wang J (1997) Effect of excluding sib matings on inbreeding coefficient and effective size of diploid populations. Biometrics 53(4): 1354-1365.
- Pereira Filho J (2005) Effect of Effective Size and Mating Systems on Inbreeding increase in populations under selection, using simulation. Thesis (PhD in Animal Science) - Federal University of Viçosa, Minas Gerais, p.
- Teixeira Neto MR, Da Cruz JF, Carneiro PLS, et al. (2013) Population parameters of the Santa Inês sheep breed in Brazil. Brazilian Agricultural Research 48(12): 1589-1595.
- Loughnan SR, Domingos JA, Smith-Keune C, Forrester JP, Jerry DR, et al. (2013) Broodstock contribution after mass spawning and size grading in barramundi (Lates calcarifer, Bloch). Aquaculture 404-405: 139-149.
- Gizaw S, Getachew T, Haile A, Rischkowsky B, Sölkner J, et al. (2013) Optimization of selection for growth in Menz Sheep while minimizing inbreeding depression in fitness traits. Genetics Selection Evolution 45: 20.
- Toro MA, Varona L (2010) A note on mate allocation for dominance handling in genomic selection. Genetics Selection Evolution 42: 33.
- Vieira CV, Andrade WBF, Faria CU (2014) The efficiency of optimized mating analysis in obtaining genetic progress in nelore cattle. Bioscience Journal 30: 816-822.
- Sun C, Vanraden PM, O’connell JR, Weigel KA, Gianola D (2013) Mating programs including genomic relationships and dominance effects. Journal of dairy science 96(12): 8014-8023.
- Hallander J, Waldmann P (2009) Optimization of selection contribution and mate allocations in monoecious tree breeding populations. BMC Genet 10: 70.
- Weigel KA (2001) Controlling inbreeding in modern breeding programs. Journal of Dairy Science 84: 177-184.
- Fernández J, Caballero A (2001) Accumulation of deleterious mutations and equalisation of parental contributions in the conservation of genetic resources. Heredity 86: 480-488.
- Id-Lahoucine S, Casellas J (2017) Impact of incomplete pedigree data and independent culling level pre-selection on the genetic evaluation of livestock: A simulation study on lamb growth. Livestock Science 198: 76-81.
- Malhado CHM, Carneiro PLS, Malhado ACM, Filho RM, Bozzi R, et al. (2010) Genetic improvement and population structure of the Nelore breed in Northern Brazil. Brazilian Agricultural Research 45(10): 1109-1116.
- R Core Team (2016) R: A language and environment for statistical computing. R Foundation for Statistical Computing, Vienna, Austria.
- Wang J, Caballero A (1999) Developments in predicting the effective size of subdivided populations. Heredity 82: 212-226.


