Biomass and Soil Carbon Stocks Assessment of Agroforestry Systems and Adjacent Cultivated Land, in Cheha Wereda, Gurage Zone, Ethiopia
Mihert Semere*
Ethiopian Environment and Forest Research Institute, Ethiopia
Submission: July 10, 2019; Published: July 25, 2019
*Corresponding author: Mihert Semere, Ethiopian Environment and Forest Research Institute; P.O.Box 24536 Code 1000, Addis Ababa Ethiopia
How to cite this article: Mihert Semere. Biomass and Soil Carbon Stocks Assessment of Agroforestry Systems and Adjacent Cultivated Land, in Cheha Wereda, Gurage Zone, Ethiopia. Int J Environ Sci Nat Res. 2019; 20(4): 556043. DOI:10.19080/IJESNR.2019.20.556043
Abstract
The present study examined biomass and soil carbon stock potentials of different agroforestry system (AFS) [home garden and woodlot] and cultivated land in Cheha Werda, Gurage zone, Ethiopia. The sites and land use types were selected based on dominance and accessibility through reconnaissance survey prior to sampling. A total of 60 sample plots and 20m x 20m for each land use type were randomly selected. Above ground biomass (AGB) and below ground biomass (BGB) were calculated by adopting allometric equations. A total of 120 Soil samples from two depths were also collected to determine soil organic carbon (SOC), pH, texture and bulk density (120 samples). The results showed that the total ecosystem carbon stocks in home garden and woodlot AFS were 100.4 and 72.9Mg C ha-1 respectively. The highest SOC stock was recorded in home garden agroforestry system. The study also revealed that AFS enhance carbon stocks accumulation both in the biomass and soil besides the socioeconomic benefits over cultivated land. Hence, AFS can be taken as potential climate change mitigation strategy in central highlands of Ethiopia.
Keywords: Biomass; Carbon stocks; Agroforestry
Abbrevations: AFS: Agroforestry System; AGB: Aboveground Biomass; AGBC: Above Ground Biomass Carbon; BD: Bulk density; BGB: Below Ground Biomass; BGBC: Below Ground Biomass Carbon; DBH: Diameter at Breast Height; H: Height; IPCC: International Panel for Climate Change; SOC: Soil Organic Carbon; TBC: Total Biomass Carbon
Introduction
Agroforestry system comprises one or more agricultural and forestry systems with beneficial effects by creating biological, socioeconomic and ecological interaction among trees or shrubs (woody perennials) with crops and/or animals [1]. The major components of agro forestry systems are trees, shrubs (woody perennials, including bamboos) and animals. These are intentionally retained or planted on the farmland to provide multiple products as a source of income generation and household consumption and other ecosystem services.
Forest ecosystem in particular agroforestry systems play a significant role in global climate change mitigation strategy, as the source of income and ecological benefits. Though several efforts have been made to reduce carbon dioxide emission through forestry sector like afforestation and enhancing agroforestry systems most of them are unaccounted locally to show the contribution of the systems. Gurage zone, Cheha Wereda was selected since it incorporates diversified Agroforestry systems and cultivated lands.
This study mainly aimed in assessing of biomass and soil carbon stocks of AFS and adjacent cultivated land in Cheha District, Gurage Zone and Central Highland of Ethiopia. The study explicitly intended to estimate and compare above and belowground biomass carbon stocks and SOC Stocks of different land us types.
Materials and Methods
Site description
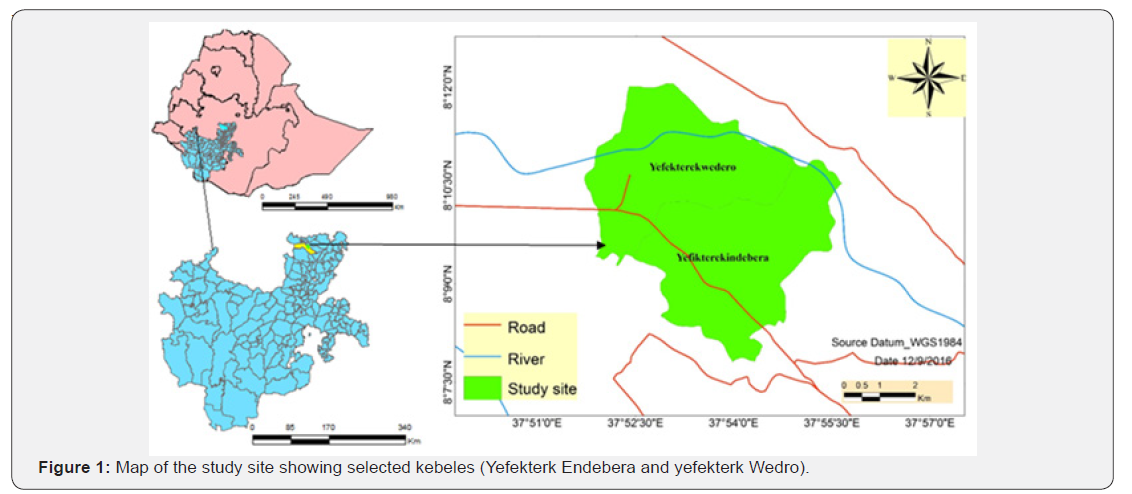
LocationThe study was conducted in Cheha district, located in Gurage Zone of Southern Nations, Nationalities and Peoples Regional State (SNNPRS), Ethiopia. The geographical location of the Study area is between 8° 00’ 18” and 8° 15’ 28” N and 37° 35’ 46” and 38° 03’ 59” E and average elevation ranges from 1950-1970 meters above sea level (Figure 1). Based on information obtained from the Cheha Wereda agriculture and rural Development Office, the area is characterized by bimodal rainfall Pattern ‘Kiremt’, is the

The mean annual rainfall obtained from the monthly data on the bases of ten years of records at the neighboring meteorological station (Imdibir, Gubre and Wolkite) is 1268 mm. The mean monthly maximum and minimum temperatures are 25°C and 11°C respectively and dominant soil type of the study site is Vertisol which covers 82.4 % of the study area.
Selection of study sites and sampling size
A preliminary reconnaissance survey was conducted in identify the study area. Key informants i.e. development agents, elders and district’s natural resource experts were consulted to identify dominant agroforestry systems. Accordingly, Kebeles with home garden, woodlot agroforestry system and cultivated land were identified. Among the list of identified kebeles two kebeles, Yefekterk endebera and yefekterk wedro kebeles were randomly selected as site replications. A total of 60 farms consisting of 20 farms for each land use were randomly selected.
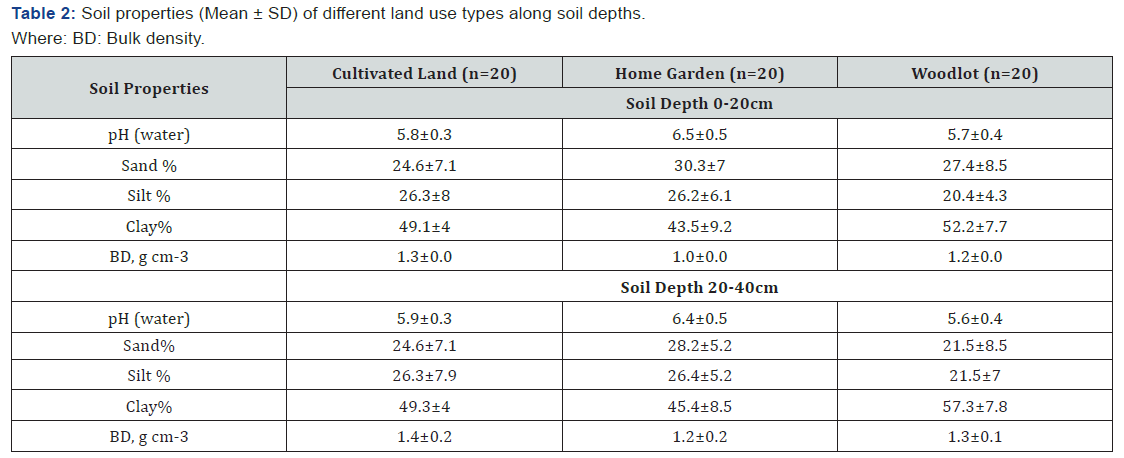
The description of vegetation and soil characteristic of agroforestry system practiced in the study area is given in Table 1 & 2.


Data collection methods
Woody species inventoryA plot size of 20m x 20m was randomly laid down in each sampled farm to inventory woody species in both the studied land use systems [2]. All woody species including fruit trees and non- fruit trees with DBH ≥2.5cm diameter and height ≥1.5m was measured and recorded [3].
For coffee plants, stem diameter at stump height (at 40cm) was measured. Stem diameter measurements (d40) were taken in two perpendicular directions and the average value taken. For enset plants stem diameter at stump height (at 10cm) was measured. In the case of multi-stemmed coffee plants, fruit trees and non-fruit, all steam in single plant was measured and the equivalent diameter of the plant calculated as the square root of the sum of diameters of all stems per plant (Snowdon et al. 2002).

Soil samples were collected from the same plots we used for woody species inventory (20m x 20m) used for woody species inventory. In this study the soil sample were collected in two depths (0-20cm and 20-40cm) from three sub plots (two at the corner and one at the centre) using soil auger and made a composite sample, for determination of sub plots lottery method were used. A total of 120 composite samples from the three subplots were taken to laboratory to determine SOC, pH and soil texture. Soil samples for bulk density analysis were collected separately from sample plot (20m x 20m) and1m x 1m subplot using core sampler size of 5cm diameter consecutively from 0-40cm. A 5cm diameter core sampler was used to take samples for bulk density and four cores were taken for each depth.
Laboratory analysis
The soil samples for SOC were air dried and sieved with 2 mm sieve for making them ready for further analysis. The samples were oven dried at 105 °C for 48 hours and weighed then Walkley and Black method was used for further analysis of the required parameters [4].
Data analysis
Above and belowground biomass estimationAbove ground biomass carbon stock for each plot (Mg C ha−1) was estimated as the product of dry matter biomass and carbon content.
For woody species (Trees) including fruit trees incorporated within home garden agroforestry, AGB was estimated using allometric equation developed by Kuyah et al. [5]. We used 48% for carbon stock conversion.

Where ABG; is the aboveground biomass (kg dry matter/ plant), d = Breast height diameter (cm)
Below ground biomass estimated (BGB) using global average value of 26% of aboveground biomass (Cairns et al. 1997). We used 49% for carbon stock conversion [3].


Where: AGB coffee is aboveground biomass for coffee, d40 = Stem diameter (cm) of the coffee plant at 40 cm height
AGB and BGB of enset were computed with allometric equation developed by Negash et al. (2013). 47% was used for carbon stock conversion.


Where AGB enset is aboveground biomass for enset, d10 is the basal diameter (cm) of the enset at 10cm height and h is total height (m), BGB enset is belowground biomass for enset.
For above ground biomass estimation of Eucalyptus viminalis allometric equation developed by Zerfu H (2002) was adopted. Since Eucalyptus viminalis has similar vegetation characteristics with Eucalyptus camaldulness

Below ground biomass estimated using global average value of 26% of aboveground biomass (Cairns et al., 1997). 50% (default values) was used for carbon stock conversion.


Where: TAGBC= Total Above ground biomass carbon, Mg C ha-1, TBGBC= Total below ground biomass carbon, Mg C ha-1 and TBC= Total biomass carbon
BD and soil organic carbonSOC stock (Mg C ha-1) was calculated by multiplying the concentrations (%) of soil carbon, the Bulk density (g cm-3) and depth of the sampled soil [2].

Where, SOC = Soil Organic Carbon (Mg C ha-1), BD = Bulk Density (g cm-3), Depth of the soil sample (cm) and % C = Carbon Concentration
Soil bulk density also calculated using [2].

Where, BD (g cm-3) =Bulk density, ODS=Oven dried soil (g).
The total carbon stock density estimation
The total carbon stock density from different carbon pools was calculated using the following formula [2].

Where, CTotal = Carbon Stocks (Mg C ha-1)
CAGTB = Carbon Stock in Above Ground Tree Biomass (Mg C ha-1)
CBGTB = Carbon Stock in Below Ground Tree Biomass (Mg C ha-1)
SOC = Soil Organic Carbon (Mg C ha-1)
Statistical analysis
Microsoft excel version 2010 was used to record, calculate and organize data. IBM SPSS version 20 software was used for statistical analysis. One-way Analysis of Variance (ANOVA) was performed to examine the variations in biomass and soil carbon stock among the agroforestry system and cultivated land. Post hoc test was used to evaluate the mean differences across the studied systems, followed by Tukey test to compare statistical mean differences among the systems. One-way ANOVA shows presence of significant differences among mean values of agroforestry systems and cultivated land in both biomass carbon and soil organic carbon stocks.
Results
Biomass carbon stocks in home garden and woodlot AFS
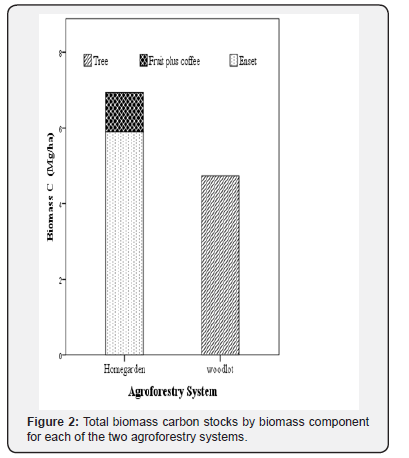
The mean total biomass carbon stocks (Above and below ground) of home garden and woodlot agroforestry system is estimated between 2-6Mg ha-1 and 1.9-4.74Mg C ha-1 respectively. Woodlot agroforestry system was lower by 22% compared to home garden agroforestry system in TBC. Mean above and below ground biomass carbon stocks showed similar leaning in their biomass carbon stock. The contribution of above ground biomass carbon stock for total biomass carbon stock in home garden and woodlot agroforestry systems is averaged at 69%. Total biomass carbon was highest in home garden as compared to woodlot and it showed difference between the two studied agroforestry systems but the difference was not significant at 5% level of significance. Mean biomass carbon stock of home garden and woodlot agroforestry system was estimated to be (6.092±2.3Mg C ha−1) and (4.74±6.3Mg C ha−1) respectively (See Table 3).

In home garden agroforestry system enset and coffee plus tress accounts 83% and 17% respectively for the total biomass in the system. This study assumes the difference in carbon between the two studied agroforestry systems was not significant at 5% level of significant (Figure 2).

BGBC of the two studied agroforestry systems ranged from 1-4Mg C ha−1. Home garden AFS has significantly higher BGBC than woodlot AFS (2.03 and 1.9Mgha−1) respectively (See table 3). The contribution of BGBC for the total biomass carbon stock was 33% and 40% for home garden and woodlot agroforestry systems respectively.
Soil organic carbon stocks among studied land uses
The mean total SOC (0-40cm) of studied land uses was estimated to be 94.2Mg C ha-1, 73Mg C ha-1 and 68Mg C ha-1 for home garden, cultivated land and woodlot respectively. The SOC (0-20cm) in home garden agroforestry system was higher by 28% and 23% than woodlot and cultivated land respectively. The contribution of the upper soil layer (0-20cm) to total SOC stocks was highest for all AFS home garden agroforestry followed by cultivated land and woodlot agroforestry than the lower layer (20-40cm). Conversion of home garden agroforestry and woodlot to cultivated land would decrease SOC stock by 23% and increases by 7% respectively.
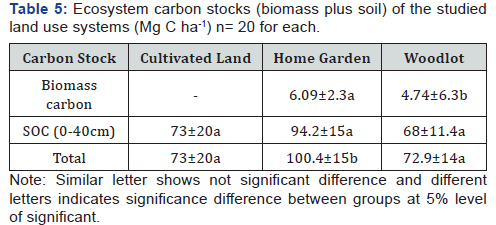
The total SOC stocks significantly differed between home garden and the other two studied systems. The SOC stock was the highest in-home garden and the least in woodlot (See Table 4).

Ecosystem carbon stocks among the three studied land uses
Amongst the studied land uses the highest mean ecosystem carbon stock was recorded for home garden agroforestry system (100.38Mg C ha-1) and the least was for woodlot agroforestry (72.9Mg C ha-1) (See Table 5).

Discussion
Biomass carbon stock in studied agroforestry system
The mean total biomass carbon stock of home garden agroforestry system accounted in this study was comparable with the findings in the same agroforestry system in Gununo Watershe Wolayitta Zone, Ethiopia [6]. Home garden agroforestry system total biomass carbon in this study was substantially higher than the parkland agroforestry system in Gununo Watershed, Wolayitta Zone, Ethiopia [6] and lower than the studies in enset and enset coffee agroforestry system in Southern escarpment of Ethiopia [7] and in tropical dry deciduous forests (14.7 -43.2Mg ha-1) [8] and in Western Kenya (36.9 - 115.9) [9].
The present study revealed that total biomass carbon stocks were highest in-home garden as compared to woodlot. This could be due to lower diameter trees documented in the earlier system than the later one [10]. Besides, home garden agroforestry system includes diversified species such as fruit trees, coffee and enset which could contribute a lot in carbon storage. Similar studies have also shown that the differences in biomass carbon stocks depend on several factors such as stand age, stand structure, diversity and composition and management system [6,11].
SOC in studied land use type
Soil organic carbon is a significant carbon pool because it has the longest dwelling time of carbon among organic carbon pools (Lugo & Brown, 1993). The mean soil organic carbon stocks for the 0 –40 cm soil depth within the ranges of African savannahs and woodland 30-140Mg C ha-1 [12]. SOC in our study was considerably high as compared to results estimated to be 43Mg C ha−1 for semi-arid Acacia etabica woodland in southern Ethiopia [13].
In this study higher SOC was recorded than the study made in home garden and woodlot agroforestry in Gununo Watershed, Wolayita Zone, Ethiopia which accounted 61.6Mg ha−1 and 48.6Mg ha−1 respectively for home garden and woodlot agroforestry (Batiji et al., 2012). The SOC in this study was lower than the finding in the south eastern rift valley escarpment of Ethiopia [3]. Soil physical structure, species composition and litter quality could be the factors for the variation of SOC among the systems [14].
In line with the study management systems determine SOC of different land use system. Organic matter input and aeration alters SOC potential since they are the main driver of SOC stock. The results in this study support this claim, home garden agroforestry with high litter input as mulching management system could be the main driver for high SOC than single species woodlot agroforestry with no additional organic carbon. Low tillage considered as a measure to sequester carbon [15]. In the present study low SOC stock recorded in cultivated land comparing with home garden agroforestry, this could be related to high tillage management system in cultivated land [16-20].
Ecosystem carbon stock in studied land use types
The present study revealed that more carbon is accumulated in soil than biomass. Accumulation of fine roots and litter decomposition could be the factors for SOC and biomass carbon stock density variation. Land use history and management systems could also be additional factors (Nair et al. 2009). In this study, high ecosystem carbon stock was recorded in agroforestry system than that of cultivated land. This implies the system have a significant carbon sequestration potential which could help as climate change mitigation option in the study area [21-25].
Conclusion
The study indicates AFS have high carbon stock potential compared to cultivated land use systems. Higher carbon stock in both biomass and SOC was observed in home garden agroforestry system. This study attributes higher biomass carbon stock in home garden agroforestry than woodlot but the difference was not significant. The contributions of SOC stocks for total ecosystem carbon were higher in both studied agroforestry systems than biomass carbon stock. In a conclusion this study showed that land use conversion has a significant effect in biomass and SOC stock potential. Overall this study will add up information about carbon stock potential of AFP in central highlands of Ethiopia. It also proves AFS has great potential SOC storage, emission reduction and carbon financing scheme as climate change mitigation strategies. Therefore, the current recognition for agroforestry as climate change mitigation strategies is strengthened by this study. Therefore, Climate change mitigation (carbon emission reduction) strategies such as REDD + should give a great recognition for agroforestry since it has remarkable potential on contribution for climate change mitigation.
Acknowledgement
We acknowledge Ethiopia Environment and Forest Research Centre (EEFRC), Ethiopian Environment and Forest Research Institute (EEFRI) for granting me scholarship for pursuing the study and research fund for this paperwork. The first author also acknowledges Hawassa University, Wondo Genet College of Forestry and Natural Resources for the methodological and equipment support.
References
- Nair PKR (2012) Carbon sequestration studies in agroforestry systems: a reality-check. Agroforest Syst 86(2): 243-253.
- Pearson T, Walker S, Brown S (2005) Sourcebook for land-use, land-use change and forestry projects. Winrock International and the Bio-carbon fund of the World Bank. Arlington, USA, pp. 19-35.
- Negash M, Mike Starr M, Kanninen M, Berhe L (2013) Allometric equations for estimating aboveground biomass of Coffeaarabica grown in the Rift Valley escarpment of Ethiopia. Agroforest Syst 87(4): 953-966.
- Walkley A, Black C (1934) Examination of the Degtjareff method for determining soil organic matter and a proposed modification of the chromic acid titration method. Soil Science 37(1): 29-38.
- Kuyah S, Dietz J, Muthuri C, Jamnadass R, Mwangi P, et al. (2012) Allometric equations for estimating biomass in agricultural landscapes: I. Aboveground biomass. Agric Ecosyst Environent 158: 216-224.
- Bajigo A, Tadesse M, Moges Y, Anjulo A (2015) Estimation of Carbon Stored in Agroforestry Systems in Gununo Watershed, Wolayitta Zone, Ethiopia. J Ecosys Ecograph 5: 157.
- Negash M, Starr M (2015) Biomass and soil carbon stocks of indigenous agroforestry systems on the south-eastern Rift Valley escarpment, Ethiopia. Plant and Soil 393(1-2): 95-107.
- Chaiyo U, Garivait S, Wanthongchai K (2011) Carbon Storage in Above-Ground Biomass of Tropical Deciduous Forest in Ratchaburi Province, Thailand. World Academy of Science, Engineering and Technology. International Journal of Environmental and Ecological Engineering 5(10): 585-590.
- Henry M, Tittonell P, Manlay RJ, Bernoux M, Albrecht A, et al. (2009) Biodiversity, carbon stocks and sequestration potential in aboveground biomass in smallholder farming systems of western Kenya. Agric Ecosyst Environ 129(1-3): 238-252.
- Terakunpisut J, Gajaseni N, Ruankawe N (2007) Carbon sequestration potential in aboveground biomass of thong phaphum national forest, Thailand. Applied Ecology and Environmental Research 5(2): 93-102.
- Chave J, Condit R, Aguilar S, Hernandez A, Lao S, et al. (2004) Error propagation and scaling for tropical forest biomass estimates. Philos Trans R Soc Lond B Biol Sci 359(1443): 409-420.
- Ciais P, Bombelli A, Williams M, Piao SL, Chave J, et al. (2011) The carbon balance of Africa: synthesis of recent research studies. Philos Trans A Math Phys Eng Sci 369(1943): 2038-2057.
- Lemenih M, Itanna F (2004) Soil carbon stocks and turnovers in various vegetation types and arable lands along an elevation gradient in southern Ethiopia. Geoderma 123(1-2): 177-188.
- Rojas MM, Jordan A, Zavala LM, Rosa DDL, Abd-Elmabod SK, et al. (2012) Organic carbon stocks in Mediterranean soil types under different land uses Southern Spain. Solid Earth 3: 375-386.
- Paustian K, Andren O, Janzen HH, Lal R, Smith P, et al. (1997) Agricultural soils as a sink to mitigate CO2 Soil Use Manage 13(S4): 230-244.
- Batjes NH (1996) Total carbon and nitrogen in the soils of the world. Eur J Soil Science 47: 151-163.
- Bouyoucos C (1951) A calibration of the hydrometer method for making mechanical.
- Brown S (1997) Estimating biomass and biomass change of tropical forests: a primer. FAO Forestry Paper 134. Food and Agriculture Organization of the United Nations, Rome, Italy.
- Brown S, Gillespie JR, Lugo AE (1989) Biomass estimation methods for tropical forests with application to forest inventory data. J For Sci 35(4): 881-902.
- Hailu Z (2002) Ecological impact evaluation of Eucalyptus plantations in comparison with agricultural and grazing land-use types in the Highlands of Ethiopia. Vienna University of Agricultural Sciences, Vienna.
- IPCC (2002) Third Assessment Report of the IPCC. Cambridge University Press, Cambridge, UK.
- IPCC (2007) Climate change synthesis report. Intergovernmental Panel on Climate Change.
- Kort J, Turnock R (1999) Carbon reservoir and biomass in Canadian prairie shelterbelts. Agroforestry Systems 44(2-3): 175-186.
- MacDicken KG (1997) A guide to monitoring carbon emissions from deforestation and degradation in developing countries: An examination of issues facing the incorporation of REDD into market-based climate policies. Resource for Future, Washington, DC.
- World Agroforestry Centre (ICRAF) (2006) Agroforestry for improved livelihoods and Natural resources conservation. An Agroforestry Policy Brief.


