Climate Change/Variability Impacts on Farmers livelihoods and Adaptation Strategies: In the Case of Ensaro District, Ethiopia
Abirham Cherinet*
Ethiopian Environment and Forest Research Institute, Central Ethiopia Environment and Forest Research Center, Ethiopia
Submission: February 18, 2019; Published: March 22, 2019
*Corresponding author: Abirham Cherinet, Ethiopian Environment and Forest Research Institute, Central Ethiopia Environment and Forest Research Center, P.O. Box: 30708, Addis Ababa, Ethiopia
How to cite this article: Abirham Cherinet. Climate Change/Variability Impacts on Farmers livelihoods and Adaptation Strategies: In the Case of Ensaro District, Ethiopia. Int J Environ Sci Nat Res. 2019; 18(1): 555976. DOI:10.19080/IJESNR.2019.18.555976
Abstract
This study identifies the major impacts of climate change and methods used by farmers to adapt the changing climate in Ensaro district, Ethiopia. 124 sample households were selected purposively from three rural kebele’s of the district and most of the respondents have perceived the increasing trend of temperature and the variation of rainfall in duration and intensity. The most significant impacts of climate variability and change as perceived by the local people were shortage of water, flood, landslide, drought, expose to disease, shortage of forage, force to out migrate, famine, loss of livestock and decline in crop yields. Prevalence of newly introduced human, crop and animal diseases, flooding, drying up of rivers and streams, rainfall variability in duration and amount and the variation of onset and offset date of rainfall are the most mentioned indicators of climate change by farmers. Communities disobeying of God, deforestation and population pressure were the major causes of climate change/variability as perceived by the respondents. Terracing, afforestation, rain water harvesting, crop diversification, use of improved crops, income diversification (petty trade, wage laborer etc.), seasonal migration to generate income and livestock management (destocking, cut and feeding system) are the most coping/adaptation strategies practiced by the farmers in the study area. Results from the binary logit model revealed that the respondent’s age, educational status, access to extension and farm experience have a positive and significant effect on farmer’s taking of adaptation measures. On the other hand, sex of household heads, small farm land size, less access to market and less access to credit have negative and significant effect on farmers taking of adaptation measures in the study area.
Keywords: Climate change; Impacts; Adaptation; Barriers
Introduction
Climate change is a global challenge facing humans and their socio-economic activities, health livelihood, and food security [1-4]. Climate change is a change of climate which is attributed directly or indirectly to human activity. It alters the composition of the global and/or regional atmosphere and natural climate variability observed over comparable time periods. No country or human being can be free from the impacts of climate change including animals. Both developed and underdeveloped nations and poor and rich peoples are also affected by its impacts. Therefore, underdeveloped nations and the poor are more vulnerable to the impact [5]. Rural farmers in Sub-Saharan Africa are likely to be more vulnerable to climate change, particularly because of compounding challenges of poverty, low infrastructural and technological development, and their economy is highly dependent on rain-fed agriculture [6-9].
Over 95% of agricultural production in sub-Saharan African is depends on rain [10-12]. The high vulnerability level of African nations to climate change is not only because of their economy depends on natural resource but also their resources are low and fewer options they have to combat the impacts of climate change/variability [13]. Due to those reasons, millions of African peoples may likely face catastrophes, and extreme weather events are likely to become more intense and more frequent. Particularly Ethiopia is among the most vulnerable countries to climate variability with little adaptive capacity. Specifically, high levels of poverty, rapid population growth, and high level of reliance on rain-fed agriculture, high levels of environmental degradation, chronic food insecurity and frequent natural drought cycles are the major vulnerability drivers to climate change in the country [14]. Climatic changes have resulted several negative consequences on livelihood, health, economy and environment of the people in Ethiopia [15]. As the impacts of climate change on the people varied from one to another, the adaptation strategies implemented by peoples are also not the same. In this regard, farmers in different areas are practicing different adaptation or copping strategies with their indigenous knowledge in respond to adaptation needs [16-21]. This knowledge needs to be exploited properly and integrated with scientific and technological inputs for sustainable management and use. However, local and traditional knowledge are not well documented and structured for the benefit of policy and decision making. It has been argued that governmental and external actors need to strengthen the adaptive capacity of rural people and take advantage of already existing strategies [22]. The current study assesses the impacts of climate change and adaptive strategies implemented by different actors in Ensaro district.
Methodology
Description of the study area
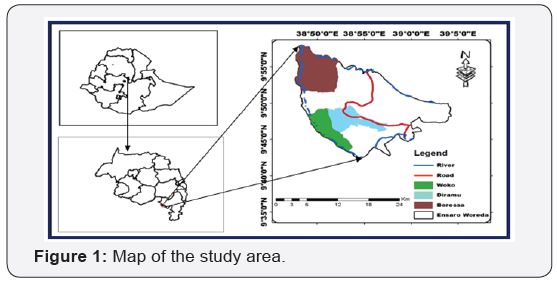
Ensaro district lies in between 9º 35ˈ- 9º 55ˈN and 38º 50’ - 39º 5ˈE with an average elevation of 2435 meters above sea level. Based on the 2007 national census conducted by the Central Statistical Agency (CSA) of Ethiopia, the district has a total population of 58,203, of whom 29,888 were male and 28,315 female; 3,164 (5.44%) were urban inhabitants. The district’s total land coverage is 44,217.6 hectare out of this undulating area covers about 50%, flat plains 40%, mountainous and others 10%. According to the district administration and community classification, the district agro-ecology is subdivided in to lowland (33%), midland (46%) and highland (21%). The vegetation is dominated by scattered trees such as the Croton macrostachyus, Olea capensis, Euclea schimperi, acacias (Acacia spp.) Eucalyptus viminalis and Eucalyptus globules etc. The area is also characterized by a bimodal rainfall distribution with a distinct rainy season lasting approximately from May to September. The average annual rainfall amount varies between 900 to 1500mm and average temperature is in between 18°c-30°c. Out of the estimated total land area of 44,217.6 hectare; 21,465 hectare (48.5%) is arable land, 3911 hectare (8.8%) is used for grazing, 6,707 hectare (15.2%) is covered with shrubs and afforested plants, 186.1 hectare (0.4%) covered with water, 11,948.56 hectare (27.02%) is allocated for residential and infrastructure development. Although agriculture is the main economic activity, many households are engaged in activities such as trading, selling of fire wood and charcoal and livestock rearing which constitute the main source of cash income.
Sampling
Both sample household heads and sample kebeles are selected purposively. The selected sample kebeles are from different agro-ecologies and their sensitivity to climate change hazards like flood, drought and land slide are taken in to account during selection. From the selected 124 sample households the 22 were female headed households which they live at least 20 and above years in the area. Local peoples (male and female including youths), government representatives, and religious leaders of sample kebeles, are among the participants in this study.
Data collection
Both primary and secondary data sources are used for the current study. The primary data are collected through questionnaire, interview and focused group discussion. The researcher selected FGD and KI respondents in each kebele based on socially respected within society and are known to have better knowledge on the present and past environmental, social and economic status of the study area. At each kebele, one focus group discussion was held with 6 participants in each discussion groups and key-informant interviews with 10 community representatives. Secondary data are collected from published and unpublished documents identified from government offices, National Meteorological Service Agency, Central Statistical Agency and Internets. Monthly rainfall, maximum and minimum temperature data of 1987 to 2016 gridded satellite data was used.
Data analysis
The qualitative data gathered from the open-ended questioners’, field observations and document review were narrated and interpreted properly. Quantitative information gathered using interview was analyzed using SPSS Version 23.0 statistical software. Errors related to inconsistency of data were checked and corrected during data cleaning; whereas the quantitative data generated by questionnaire and gridded satellite data had been analyzed using descriptive statistics. Descriptive statistics such as mean, frequency and percentage were used to characterize farmer’s perception on long-term temperature and precipitation variability as well as various adaptation measures used by farmers, and barriers they face to adapt. Finally, Binary logit model were used to see the relationships between dependent and independent variables.
Results and Discussion
Socio economic characteristics of the respondents
As indicated in the sampling section 17.7% of the participants were female headed households and 82.3% were male headed households from the total household heads included in the sampling. This is due to the assumption that most of the agricultural sector and the tiresome activities related to climate change adaptation strategies are dominated by males [23-24].The participant’s age ranges from 25-65 years and the average age was 48 years and the average household size of the respondents is 6, the absolute size of the respondents ranged from 1 to 8 members. In terms of religious composition, 100% of the survey households are adherent of Orthodox Christianity, more than 45.2% of the respondents stated that they could read and write, while 15.3% and 15.3% of the respondents have primary and high school completed respectively. But 36.3% of the sample household heads were illiterate. 86.3% of the households means of livelihood are farming and 13.7% were practiced both farming and off farming activities (wage labor, petty trades etc.). About 70.2% of the respondents had 0.51 to 2ha of farmland, while about 12.9% have had 0.5ha and below of farm land and the rest 16.9% of the respondents have >2.1ha. In general, 46.7% of the respondents have less than 1ha of farmland. About 7.3%, 6.5%, 6.5% and 25.8% of the respondents do not have cattle, oxen, pack animal and small ruminants, respectively.
Temperature patterns of the district
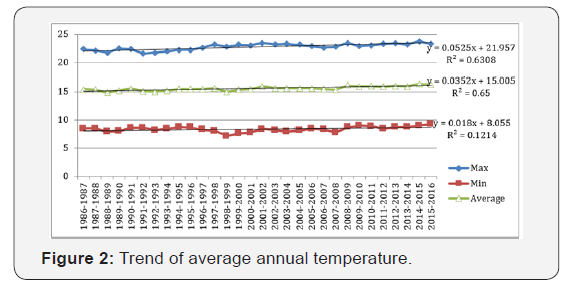
The annual average temperatures of the study area for the last three decades are analyzed and shows an increment by 1.02ºC with an annual increment of 0.034ºC. According to the annual pattern of the minimum, maximum and mean temperature of the study area, there are significant variations in the case of average annual maximum and average temperature that can be seen from their R value greater than 0.5 (i.e., R= 0.63 and 0.65, respectively). But the average minimum temperature of the study area showed insignificant variation with R value less than 0.5 (Figure 2).
Rainfall patterns of the district
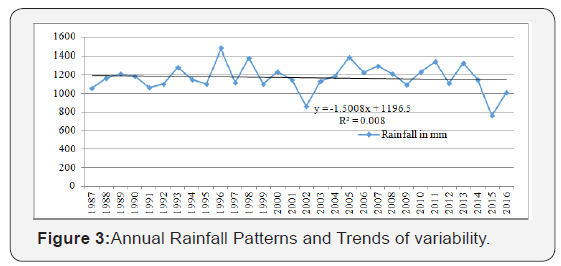
Annual rainfall: The annual average rainfall of Ensaro district over the last three decade shows almost uniform amount. The amount in annual average rainfall is 1175mm, with the exception of 1487mm record in 1996 and that of 2015 that received average rainfall of 764mm (Figure 3).
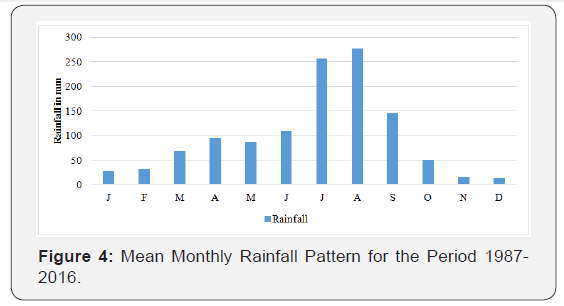
Monthly rainfall: There are significant month-to-month variations and these variations are closely associated with the seasonal atmospheric circulation changes above the region. Slope magnitudes, as well as the general ‘hilliness’ of the topographical environment of the station, had a positive effect on rainfall amounts [25]. The monthly rainfall distribution in the last three decades of the study area indicates prevalence of high rainfall. Around 82.43% of rainfall was recorded from April to September and starts to decline from October until March which clearly reflects the prevalence of seasonality of rainfall in the study area as it is also true to some of such areas in the country (Figure 4).

NB: RC1= Rainfall concentration; Desg.2= Designation of the rainfall concentration in the months; Dry3= RC<0.6; Rainy4= RC>0.6;
BRM5= Big rains with moderate concentration where RC=1.0-1.9; BRH6= Big rains with high concentration with RC= 2.0-2.9.
Rainfall seasonality is related to the temporal distribution of rainfall on a monthly basis and determined by computing the value of rainfall concentration (RC) for each month UNFAO (1965) and adopted by Getachew [26]. According to this computation, the study area receives small amount of rainfall in January, February, October, November and December with RC value is < 0.6 (60%) and the rainfall module designated as dry months, while March is rainy month as it received >60% (Table 1).
Generally, March, April, May, June, July, August and September are rainy months for the RC value is greater than 0.6 and June, July, August and September are designated as big rainy months as their RC values >1.0 (Table 1). The study area receives big rains with moderate concentration during June and September, with the RC of 1.11 and 1.49 respectively. July and August months are months that received the highest concentration of rains with RC >2.0 which is characterized as big rain.
Local communities’ causal attribution of climate change
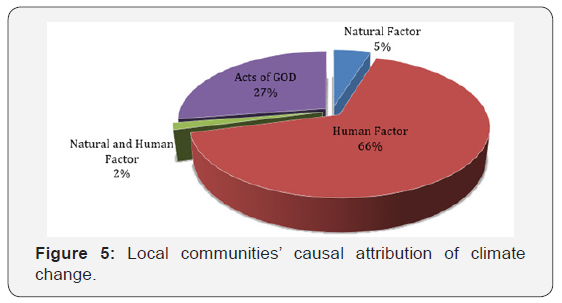
66% of the respondents reflected the main cause of climate change are related to human activities Multiple answer results shows that 95.2% and 71.8% of the respondents recognizes deforestation and population pressure. As the main cause of climate variability in the study area respectively. In addition, about 91.2% of the respondents also considered over cultivation is the major factor that caused by human activity, but they gave little credit to the contribution of fossil fuels and air pollution to climate variability.
Perceived climate change indicators
Newly introduced human, crop and animal disease, flooding, drying up of rivers and streams, rainfall variability in duration and amount and the variation of onset and offset date of rainfall are the most mentioned indicators of climate change by farmers in the study area.
Impacts of climate change
Climate variability hazards are events or occurrences that have the potential for causing injury to life, or damage to property or the environment on which the community depends for its social and economic existence. Community in the study area perceived that, variability of rainfall and temperature, drought, flood, landslide, and soil erosion are common climate change hazards that have been led to crop infestation and livestock diseases. Both crop production and animal husbandry are practiced in the area and these sectors are sensitive to climate change. According to Ensaro district agricultural development office report, climate change and variability particularly reoccurrence of drought, early cessation and late onset of rain, heavy and unseasoned rain and pests have caused massive crop failure (Figure 6).
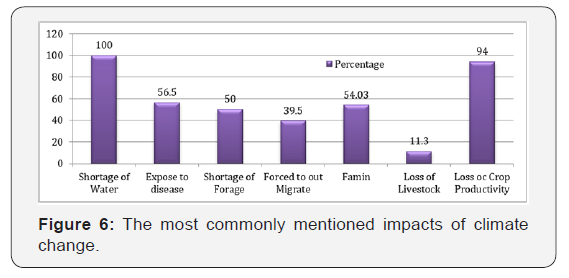
The communities are therefore exposed to these extreme climate events and indirectly though changes in water, air, food quality and quantity, agriculture and livelihoods. These direct and indirect exposures can cause death and hardship in the study area. The results of the respondents is in line with the report of the IPCC [27] that increases in climate extremes (e.g., storms, floods, temperature, droughts) associated with climate variability and change would cause deaths and injuries, population displacement, and adverse effects on food production, freshwater availability and quality, and would increase the risks of infectious disease, particularly in low-income regions.
Responses to climate change impacts

Community level responses: Climate variability and change are already having severe impacts on local people’s livelihoods, particularly those that are highly dependent on natural resources for farming and livestock production. Figure 5 shows the most significant adaptation and coping strategies adopted by the local people in combating impacts of climate variability and change (Figure 7).
Government level responses: Developing nations that lack the infrastructure or resources to respond to the impacts of climate change will be particularly affected. It is clear that many of the world’s poorest people are likely to suffer the most from climate change. Long-term global efforts to create a more healthy, prosperous and sustainable world may be severely hindered by changes in the climate. The task of planning and implementing strategies to adapt to the consequences of climate change will require worldwide collaborative inputs from a wide range of experts, including physical and natural scientists, engineers, social scientists, medical scientists, those in the humanities, business leaders and economists.
To minimize the impacts of climate, change the government of Ethiopia has adopted national policies, sector strategies and programs. The priorities of the national policies, sector strategies and programs of the government are primarily targeted at promoting rural and agricultural development and poverty reduction. Ethiopia has no clear policy on climate variability until 2016. As a result, climate variability and adaptation issues are often treated indirectly in sector specific policies and programs since climate impacts are considered as a sub-component of the overall development goal particularly in relation to natural resources and environmental protection [28]. Government responses related to climate variability and its impact in the study area are disseminating energy saving technologies, emergency aid, protection and livelihood enhancement and disaster risk reduction, mobilize and lead communities for watershed development and awareness creation related activities.
Barriers to adaptation measures to climate change
In the study area a large number of local people consider that climate has become hotter and drier. All the respondents and most of the FGDs participants, experts and interviewed informants perceived changes in temperature and precipitation. Even if the perception is high, only 80% of the respondents took the necessity of remedial actions to cop up the climate change impacts. Even, 67.72% of those who practiced adaptation confirmed that the adaptation options they employed were not successful. In other words, local people adaptation options were not successful due to various perceived limitations. The results of this study revealed that, respondent’s age, educational status, and farming experience have a positive and significant effect on farmers on taking climate change adaptation measure which means a unit change of the variables possess a significant impact on farmers taking adaptation measures. On the other hand, access to extension services, farm land size, access to market and access to credit have negative and significant effect on farmers climate change adaptation measures in the study area (Table 2).
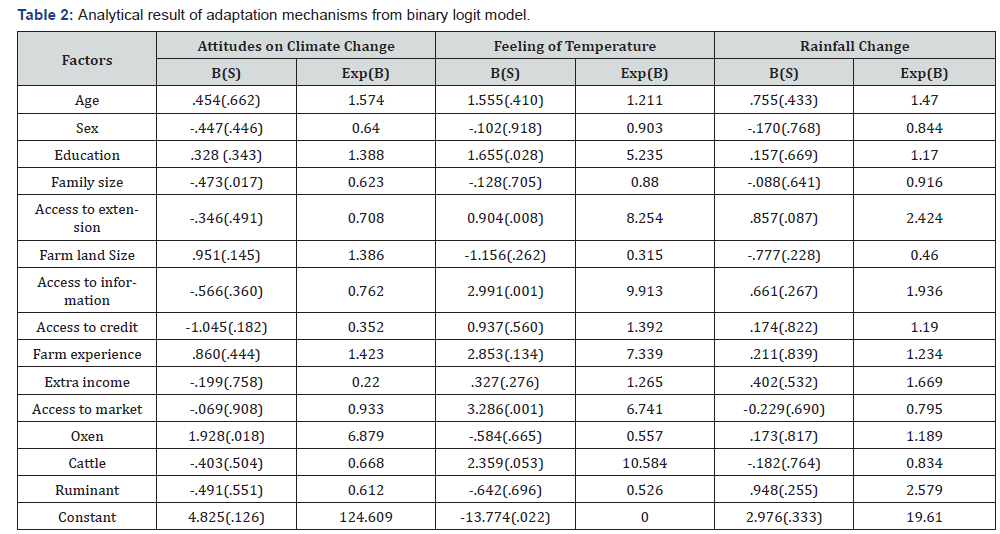
Exp (B) ====odd ratio S========significant.
Conclusion
The finding of the study showed that, both maximum and minimum temperature had increased, and rainfall had showed fluctuations. Most of the FGD, KI and interview participants perceived climate variability induced hazards such as drought, land degradation, flood, pests and disease lead the community to face shortage of water, shortage of forage, famine, disease, out to migrate, loss of livestock and crop product. Reforestation, terracing, water harvesting, change in cropping pattern, use of improved crop varieties, growing short maturing crops, diversification of income, seasonal migration and selling fire woods are among the most practiced adaptation and coping mechanisms in the study area. However, poverty, shortage of water, shortage of farm land, market problem, lack of information about weather and climate variability, lack of accessible credit and access to extension were the major constraints of adaptation for many people in the study area. As a result, decline of crop production, expansion of disease and scarcity of available water occurred in the study area leads them to be more vulnerable to the impacts of climate change. Therefore the local government need more efforts on improving the communities’ knowledge to climate variability (through training, extension services, and mass Medias), diversifying the livelihoods of farmers, expansion of irrigational agriculture, facilitating the availability of credit, constructing of public services, especially roads, health institutions, training Centre and markets, and allocating budget to increase the adaptation capacity of the local community.
Acknowledgment
The authors would like to thank Ethiopian Environment and Forest Research Institute for the financial support to carryout this research and Ensaro district Agricultural Development Office staffs, interviewees, FGD and KI participants for their valuable contributions of this research.
References
- Amjath-Babu T, Krupnik TJ, Aravindakshan S, Arshad M, Kaechele H (2016) Climate change and indicators of probable shifts in the consumption portfolios of dryland farmers in Sub-Saharan Africa: implications for policy. Ecol Indic 67: 830-838.
- Clarke C, Shackleton S, Powell M (2012) Climate change perceptions, drought responses and views on carbon farming amongst commercial livestock and game farmers in the semiarid Great Fish River Valley, Eastern Cape province, South Africa. Afr J Range Forage Sci 29: 13-23.
- Romieu E, Welle T, Schneiderbauer S, Pelling M, Vinchon C (2010) Vulnerability assessment within climate change and natural hazard contexts: revealing gaps and synergies through coastal applications. Sustain Sci 5(2): 159-170.
- Mitchell T, Van Aalst M (2008) Convergence of Disaster Risk Reduction and Climate Change Adaptation. A review for DFID.
- Adger WN, Huq S, Brown K, Conway D, Hulme M (2003) Adaptation to climate change in the developing world. Prog Dev Stud 3(3): 179-195.
- Adimassu Z, Kessler A (2016) Factors affecting farmers’ coping and adaptation strategies to perceived trends of declining rainfall and crop productivity in the central Rift valley of Ethiopia. Environ Syst Res 5: 13.
- Lipper L, Thornton P, Campbell BM, Baedeker T, Braimoh A, et al. (2014) Climate-smart agriculture for food security. Nat Clim Change 4: 1068-1072.
- Nelson GC, Mensbrugghe D, Ahammad H, Blanc E, Calvin K, et al. (2014) Agriculture and climate change in global scenarios: why don’t the models agree. Agric Econ 45(1): 85-101.
- Ericksen P, Thornton P, Notenbaert A, Cramer L, Jones P, et al. (2011) Mapping Hotspots of Climate Change and Food Insecurity in the Global Tropics. Copenhagen, Denmark: CGIAR Research Program on Climate Change. Agriculture and Food Security (CCAFS).
- Adebisi-Adelani O, Oyesola O (2014) Farmers’ perceptions of the effect of climate change on tomato production in Nigeria. Int J Veg Sci 20: 366-373.
- Zake J, Hauser M (2014) Farmers’ perceptions of implementation of climate variability disaster preparedness strategies in Central Uganda. Environ Hazards 13: 248-266.
- Simelton E, Quinn CH, Batisani N, Dougill AJ, Jen C, et al. (2013) Is rainfall really changing? Farmers perceptions, meteorological data, and policy implications. Clim Dev, pp. 37-41.
- IPCC (2007c) Summary for policymakers. In: Parry ML, Canziani OF, Palutikof JP, van der Linden PJ, Hanson CE (Eds.), Climate Change 2007: Impacts, Adaptation and Vulnerability. Contribution of Working Group II to the Fourth Assessment Report of the Intergovernmental Panel on Climate Change, Cambridge University Press, Cambridge, UK, pp. 7-22.
- Aklilu A, Alebachew A (2009a) Assessment of Climate change Induced hazards, impacts and responses in the Southern Lowlands of Ethiopia. Forum for Social Studies (FSS) Research Report No. 4. Addis Ababa, Ethiopia.
- Eriksson M (2006) Climate Change and its Implications for Human Health in the Himalaya. Sustainable Mountain Development in the Greater Himalayan Region, p. 50.
- Huda MN, Hossin MZ, Ashik-E-Elahi S, Mahbub F (2016) Sociodemographic and economic correlates of climate change coping and adaptation strategies: A study on the farmer communities in Barisal district, Bangladesh. American Journal of Climate Change 5(2): 167- 177.
- Kumar V (2014) Role of Indigenous knowledge in climate change adaptation strategies: A study with special reference to North-Western India. Geography & Natural Disasters 5: 131.
- Osbahr H, Peter Dorward P, Stern R, Cooper S (2011) Supporting agricultural innovation in Uganda to respond to climate risk: Linking climate change and variability with farmer perceptions. Agricultural Innovation and Climate Risk 47(2): 293-316.
- NAC (National Academy of Science) (2010) Adapting to the impacts of climate change. Washington, D.C.: The National Academies Press, USA, p. 292.
- Gyampoh BA, Amisah S, Idinoba M, Nkem J (2009) Using traditional knowledge to cope with climate change in rural Ghana. Unasylva 231/232 60: 70-74.
- Agrawal A, Perrin N (2008) Climate Adaptation, Local Institutions and Rural Livelihoods IFRI Working Paper number W08 I-6.
- Ishaya S, Abaje IB (2008) Indigenous people’s perception on climate change and adaptation strategies in Jema’a Local Government Area of Kaduna State, Nigeria. Journal of Geography and Regional Planning 1(8): 138-143.
- Abraham F, Bamidele FS, Adebola AJ, Kobe IH (2012) Climate change mitigating activities and determinants in the rural guinea savannah of Nigeria. Sustainable Agriculture Research 1(2): 170-177.
- Pascal O, Pierre C (2005) Influence of topography on monthly rainfall distribution over East Africa. Climate Research, Inter Research 28 (3): 199-212.
- Getachew G, Tekalign S, Reddy RU (2014) Climate Variability and Its Local Perception and Adaptation Measures in Weliso District, Ethiopia, East Africa. International Journal of Science and Research 3(11): 1510- 1515.
- IPCC (2007b) Climate change 2007: Impacts, adaptation and vulnerability. In: Parry ML, Canziani OF, Palutikof JP, van der Linden PJ, Hanson CE (Eds.), Contribution of Working Group II to the Fourth Assessment Report of the Intergovernmental Panel on Climate Change. Cambridge, Cambridge University Press, UK, p. 976.
- NMSA (2007) Climate change: National Adaptation Program of Action (NAPA) of Ethiopia. Ministry of Water Resource, Addis Ababa.


