


Carbon Storage Potential of Ethiopian Highland Bamboo (Arundinaria alpina (K. schum): A Case Study of Adiyo Woreda, South West Ethiopia
Urgesa Teshoma*
Forestry Experts, Researcher Institute in Ethiopia Environmental and Forest Research Institute, Ethiopia
Submission: December 19, 2018;Published: January 31, 2019
*Corresponding author: Urgesa Teshoma, Forestry Experts, Researcher Institute in Ethiopia Environmental and Forest Research Institute, Ethiopia
How to cite this article: Urgesa T. Carbon Storage Potential of Ethiopian Highland Bamboo (Arundinaria alpina (K. schum): A Case Study of Adiyo Woreda, South West Ethiopia. Int J Environ Sci Nat Res. 2019; 16(5): 555949. DOI:10.19080/IJESNR.2019.16.555949.
Abstract
Estimation of above ground biomass are required for better planning, sustainable management and monitoring of change in carbon stock in natural stands of bamboo ecosystem. Biomass assessment, the selection or development of reliable allometric biomass equations is an essential step which determines largely the accuracy of the resulted biomass estimates. Unfortunately, only few studies on biomass estimation and allometric biomass equations have been conducted for Ethiopia Highland bamboo and the results are usually not publicly accessible or well documented. Thus, the objective of this study was to estimate carbon storage capacity of natural bamboo stand and develop species-specific allometric equations for above-ground biomass (AGB) estimations for Ethiopia Highland bamboo (Arundinaria alpine). The study site was divided into three landforms based on slope percent from the bottom to the top of the mountain. Accordingly, the three landforms were categorized as flat-gentle slopping (0-20%) Slope (20-40%) and steep slope (40-60%). In each of three land- forms four plots of size of 10 x10m each were laid at every 200m distance between each plot. A total of twelve study plots were taken from the three land forms. Age and DBH of the plants of each plot was taken and plants were grouped into three age class as <1, 2-3,>3 years of age. Then two plants were randomly selected from each age group and plot. Randomly selected plant were felled and sorted in different components and their height, DBH and fresh weight was taken in the field immediately after felling. A total of 72 bamboo plants were sampled. Dry weight each sampled components of bamboo plants and litter layer and grass were oven dried at constant weight in 85°c then after the dry/fresh weight ratio of each subsample was calculated. The developed allometric equation) as a function of DBH following regression function and sample data collected for each age class. The results of the regression analysis revealed that the power regression model established between age and DBH variable were statistical significant for all age class and it was found that the coefficient of determination and standard error show better when compared to other three models the equations selected were as follow: AGBage<1=1.139*DBH^2.158 (R² = 0.917), AGBage2-3 =0.36*DBH^1.78 (R² = 0.946), AGBage>3 =1.22*DBH^1.22 (R² = 0.909), and for pooled age AGB=1.68*DBH^2.68 (R² = 0.84) for the three age class and pooled age and also the equations used as estimation of the biomass of each age class. The results of this study show that the average carbon stock of aboveground biomass (AGB), below ground, soil organic carbon and litter layer and grass twelve plots was 72.3 t C ha-1,14.46 t C ha-1,205.3 t C ha-1 and 2.17 t C ha-1 respectively. The cumulative amount of carbon and CO2 sequestered throughout the study area was about 294.48 t C ha-1 and 1080.74 tCO2, ha-1 respectively.
Keywords: Carbon storage potential; Allometric equation; Ethiopia Highland bamboo; Total biomass
Introduction
Carbon pools and flux are receiving increased attention as important factor in global climate change. Forest ecosystems are the primary terrestrial actors in atmosphere CO2 up take and store two third of terrestrial carbon stock (Bonnan, 2008). Forest absorbs carbon dioxide from atmosphere and store carbon through photosynthesis process in leaves, stem, roots and branch.
Carbon capture and storage, or sequestration (CCS), is the long-term isolation of carbon dioxide from the atmosphere through physical, chemical, biological, or other engineered processes. This includes a range of approaches including soil-carbon sequestration (e.g., through no-till farming), terrestrial-biomass sequestration (e.g., through planting forests), direct injection of CO2 onto the deep seafloor or into the intermediate depths of the ocean, injection into deep geological formations, and even direct conversion of CO2 to carbonate minerals. All these processes are considered in the 2005 special report by the Intergovernmental Panel on Climate Change (IPCC, 2005).
Anthropogenic activities like industrialisation, deforestation, forest degradation and burning of fossil fuel, has caused an increase in the level of carbon in the atmosphere and disrupted the global carbon cycle (Solomon and Srinivasan, 1996). Climate change or global warming due to the rise in greenhouse gases, primarily carbon dioxide (CO2), is one of the most urgent global problems. If not addressed properly can cause irreversible and disastrous damage to the whole biosphere. Therefore, varieties of strategies are needed to reduce CO2 emissions and remove carbon from the atmosphere in order to mitigate the potential effects of global warming and climate change. Regarding to this, forest can make significant contributions to a low-cost global mitigation portfolio that provides synergies with adaptation and sustainable development (IPCC, 2007).
One of the functions of forest is as storage and sequestration of carbon as well as maintaining the greenhouse effect (Yuniawati et al., 2011). Forest retained the biomass carbon for more than 50% from other vegetation (Brown, 1997, Gibbs, Brown, Niles, & Foley, 2007) therefore, it is important to understand the rate of carbon accumulation that is reserve in this case by the forest ecosystem that has a connection with the climate change (Makila et al., 2001).
The carbon sequestered or stored on the forest trees are mostly referred to as the biomass of the tree or forest. Biomass production in different forms plays important role in carbon sequestration in trees (Chavan and Rasal 2012). Above ground biomass, below ground biomass, dead Wood, witter, and soil organic matter are the major carbon pools in any ecosystem (FAO, 2005; IPCC, 2003; IPCC, 2006). Estimating the amount of forest biomass is very crucial for monitoring and estimating the amount of carbon that is lost or emitted during deforestation, and it will also give us an idea of the forest’s potential to sequester and store carbon in the forest ecosystem and also forest biomass assessment is important for national development planning as well as for scientific studies of ecosystem productivity, carbon budgets, etc [1] (Hall et al., 2006; Zheng et al., 2004; Zianis and Mencuccini, 2004). Biomass is an important element in the carbon cycle, specifically carbon sequestration; it is used to help quantify pools and fluxes of Green House Gases (GHG) from the terrestrial biosphere to the atmosphere associated with land-use and land cover changes (Cairns et al., 2003). Enhancing forest Carbon sequestration as well as the reducing emission for deforestation and forest degradation has therefore been suggested as an effective means of curbing elevated atmosphere CO2 level and mitigating global warming (IPCC,2003,2006). The potential for forest carbon sequestration is a dynamics process and depends on climatic condition, species composition, forest age and management practise (Goodale et al. 2002; pan et al., 2011).
Bamboo is a vital and unique component of forestry and plays a very important role in ecological and environmental improvement, sustainable development, and poverty alleviation. Bamboo is one of the most productive and fastest growing plants on the planet. This unique growing capacity makes bamboo a valuable sink for carbon storage. Bamboo resources have a considerable potential to socio-economic development of the local people; environmental protection such as adaptation to global climatic change through carbon sequestration; biodiversity conservation and wider ecological adaptation (Embaye, 2002, 2004; Kelemwork, 2011). Bamboo species are well-known as proficient silica accumulators, producing phytolith-occluded carbon which is considered to be an important long-term (up to several thousands of years) terrestrial carbon fraction (Parr et al. 2010). Chemically, such a form of carbon is significantly important in storage and sequestration of carbon (Parr et al. 2010).
Bamboo is widely distributed in Southeast Asia, Africa, and Latin America. As a major non-wood forest product and wood substitute, bamboo is of increasing interest to ecologists owing to its rapid growth and correspondingly high potential for mitigating climate change. Ethiopia possesses considerable bamboo resources in Eastern Africa in terms of area coverage. There are two indigenous species of bamboo in Ethiopia: the highland or African alpine bamboo Arundinaria alpina (K. Schum.) synonym Yushania alpina and a monotypic genus lowland bamboo (Oxytenanthera abyssinica (A. Rich.) Munro), (Phillips, 1995; Embaye, 2000). Bamboo is one of the flora resources of the zone. Bamboo naturally occurs in six woreda of the zone covering a total land area of 25,695 hectares. About 56% of the natural bamboo exhibits in Adiyo woreda, which covers around 15,000ha in the study area. In Ethiopia research has been conducted on socio-economic and other benefits of bamboo whereas very few studies have been done on intangible benefits like carbon sequestration. Studying about this species is valuable in various aspects particularly estimating the carbon sequestration potential this bamboo species to be an input for the climate change mitigation activities taking place in green economy of Ethiopia and in the world at large, since climate change is the worldwide issue.
General objective
The general objective of this study was to develop biomass equation to Arundinaria alpina and determine the amount of carbon stock in the above ground, below ground plant parts and soil organic carbon of Arundinaria alpina bamboo stand along topographic gradient.
Specific objectives
To develop bamboo biomass estimating functions to be used for carbon determination for the study area and for future biomass estimation using Diameter at breast height as the primary predictor variable. To quantify the distribution of carbon in the above ground, below ground and soil organic carbon of Arundinaria alpine.
Material and Methods
Description of the study site
The study was conducted in Adiyo district lays in Kafa Zone of south Western Ethiopia. It covers an area of 1748km2. It lies between 35°29’50.55” to 36°47’33.78” East latitude and 35°48’50.57” to 35°44’34.30” East longitude and found at 42Km distance from Bonga town. The elevation varies from 500 to 2800 from above sea level. Due to variation in landscape and altitude, the climate and natural vegetation of the district varies greatly (Figure 1).

Research design and methodology
To achieve the objectives of the study, the following types of sources of data were used. Primary data were generated from the field data collection. The field work was started with the reconnaissance survey of the study area to obtain the basic information need for field work. The boundary line of forest was identified and selecting the study site based on the map obtained from Woreda natural resource division.
During reconnaissance survey the ecological (soil, topography, moisture, etc) and management factors that affect performance (quality and quantity per unit area) of bamboo stands in study site was carried out to complete to estimate the variance of the carbon stock.
Secondary data source was obtained from secondary sources which are relevant to the study problem such as related articles, books, dissertation papers and journals. The data collected from secondary sources was used in analysis of primary data.
Sampling technique
A systematic transect sampling technique was adopted in this study. Sample plots were laid along line transects from the bottom of the mountain to the top of the mountain at different slope range. The study site was divided into three landforms based on slope from the bottom of mountain to top the mountain. The landforms:
a) bottom (0-20%)
b) middle (21-40%) and
c) top (41-60%).
Three transects were laid with an interval at the bottom, middle and the top of the mountains. Transects were laid using GPS and Suunto clinometers.
Shape and size of sample plots
Four A 10m by 10m square sample plots were established along the transect in the natural bamboo forest stand, at each of the three land forms. A total of 12 plots of 100m2 sample plots area were measured. In order to eliminate any influence of the edge effects on the forest biomass, all the plots were laid at least 50 m away from nearest roads. Square plots are preferred for this study since they are easier while delineating working site/ the plots in such moderately dense stands and rope was used for plot delineation.
Diameter measurement and age determination of sampled bamboo plant
DBH of all bamboo plant in the sample plots was measured at 1.3m height and age of each plant was identified and grouped into three age-classes: <1 year, 1-3 years and >3 year. Diameter-tape was used for measuring the DBH whereas height was measured from samples taken from bamboo felled for biomass. Age was identified based on a manual (Ronald, 2005) and local experience. According to the manual and local experience, the main criteria for age determination was internodes colour, internode cover, internode epiphytes, culm sheaths, sheath ring at node and branches.
Biomass function
The allometric relationship between DBH, and total dry weight of biomass (Culm, branch and leave) was then derived for the three-age group, four candidate models shown (Table 1) were selected due to commonly used to estimate AGB in forestry literature and based on their mathematical simplicity and their applied relevance. Model performance was assessed based on various indexes. First, the coefficient of determination (R2) of each model was computed. In all statically analyse, a confidence level p=0.05 was used for statically significance, and the analyses were carried out by using SPSS 16 package. The best fit-model based on R2, SEE and F-value, was selected and used to predict biomass of bamboo.

Notes: AGB bamboo plant is the above-ground biomass per bamboo plant (kg DM bamboo plant-1), the power function, log is logarithm functions, ln is natural logarithm, DBH is the diameter at breast height (cm), and a, b, and are the regression coefficients.
Biomass Measurement
Above- ground biomass measurement
Above-ground biomass was determined destructively by harvesting randomly selected bamboo trees of different sizes. Representative bamboo plant was chosen randomly in from each plot and two bamboo plant was harvested for each the three-age class. Thus, a total of 72 (24 from slope of 0-20%, 24 from 21-40% and 24 from 41-60%) were harvested for this study. DBH was measured 1.3m above the ground level of each bamboo plant was taken before felling (FAO, 2004). Height of the tree was measured with a measuring tape after cutting the tree.
Three transects line along the slope were established and 200m spacing between plots, a total of 12 plots of 10m × 10m was marked in the three slopes (0-20%,21-40, and 41-60). Two bamboo trees randomly cut from each study plot and age class and separated into individual parts (leaves, branches, and culms). The fresh weight of each component was measured immediately, and representative sub-samples was taken to lab oven-dried to constant weight at 105°C in order to calculate the wet-dry weight ratio.
For above-ground bamboo tree biomass (AGB), the diameter at breast height (DBH) (at 1.3m), of individual bamboo trees was measured in each square plot of 100m2, starting from the edge and working inwards, and marking each bamboo tree to prevent accidentally counting it twice. Diameter tape was used for this purpose whereas the height was measured from bamboo felled for estimation of biomass. Bamboo plants were grouped into three age-classes: <1 year, 1-3 years and >3 year and DBH data list was prepared for each age group. Then above ground biomass of bamboo plant in the sample plot was estimated.
To determine the above ground carbon stock of bamboo plant, allometric equations was used. In this study, allometric equations were developed for each age group under this study.
Carbon in dead bamboo
Standing dead bamboo plants are important carbon sinks and carbon source which need to be accounted for. However, carbon in dead bamboo stand was not considered in this study, due to the dead bamboo plants allowed to local community to harvest and used for different purposes, such as for fuel consumption, construction of house and for market etc.
Litter layer and grass (LG) biomass
The forest floor, or litter layer, is defined as all dead organic surface material on top of the mineral soil. Some of this material will still be recognizable (for example, dead leaves, twigs, dead grasses and small branches) and some will be unidentifiable decomposed fragments of organic material. In addition, dead wood with a diameter of less than 2cm is included in the litter layer (Subuied et al., 2010).
Litter layer and grass samples were collected in a 1 x 1m rectangular sub-plot within the larger plot. A total of five sub-plots (four at corners and one in the center) were used for litter layer and grass collection. The accumulated litter and grass within the quadrant were carefully removed and composited together and their fresh weights determined using spring scales. A composite sample of 100g litter and grass samples were brought to the laboratory to determine moisture content, from which total dry mass can then be calculated. A total 12 litter and grass samples were collected from the field during data collection. Each sample was oven dried at 70oC until it reaches constant weight which is the dray mass, then the values of biomass in litter and grass pool was up scaled to an area of one hectare.
BLG = 𝑊 𝑓𝑖𝑒𝑙𝑑 ∗ W Subsample (dry) * 1
𝐴 Subsample (fresh) 10000 (Subuied et al., 2010)
Where: LB = Litter biomass (t ha-1)
W field = weight of wet field sample of litter, destructively sampled within an area of Size 1m2 (g); W subsample, dry= weight of the oven-dry sub-sample of leaf litter, and grass taken to the laboratory to determine moisture content (g), and W subsample, fresh= weight of the fresh sub-sample of litter, taken to the Laboratory to determine moisture content (g)
Carbon stock grasses were estimated in similar equation as litter biomass estimation. The average of carbon in litter and grass were used to know the amount of carbon in litter and grass pool. The carbon content in LG was calculated by multiplying LG with the IPCC (2006) default carbon fraction of 0.47, assuming there is no substantial decomposition of the litter layer to cause substantial losses of carbon.
Estimation of belowground biomass
Rhizome biomass
Belowground biomass estimation is much more difficult and time consuming than estimating aboveground biomass. Measurements of root biomass are indeed highly uncertain, and the lack of Guidelines for measuring carbon stocks in forests empirical values for this type of biomass has for decades been a major weak ness in ecosystem models. To simplify the process for estimating below-ground biomass, ratio of root-to-shoot ratio of was 1:5 was used (MacDicken, 1997) because 20% of the above ground biomass is below ground biomass. Thus, below ground biomass was estimated by multiplying the above ground biomass by a factor of 0.2.
Belowground biomass (tha−1 ) = 0.2 × above − ground biomass (tha−1 )
Soil sampling
The soil Samples were collected from the different depth i.e. (0-20) cm, (21-40) cm, (41-60) cm from the four corner and at the centre of the quadrants. Before collecting the soil samples all the vegetation and litter was removed from the soil surface prior to sampling. The soil sample from each plot was collected by soil sampler for incremental depth at every centre in the quadrants. The samples collected from each depth was weighted in the field and aggregated and pooled into a single composite sample to represent the sample plot. Then, approximately 500g the fresh soil sample was collected from each depth secured, labelled and kept on plastic bag, taken to soil laboratory for soil organic analysis as well as another soil sample were also collected for the determination of the bulk density using core sampler. Each and every collected soil sample was well labelled and transported to Jimma University Soil laboratory for chemical analysis.
Soil organic carbon
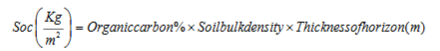
The well labelled soil sample which was collected for the analysis of soil organic carbon (SOC) was air dried and soil passed through the 2mm sieve was prepared for soil sample for determination of the soil carbon. As soil contains two types of carbon, only SOC was determine, which the most important source organic carbon. Soil organic carbon was determined by titration method based on Walkey and Black Methods.
Soil bulk density was determined by using core sampling method of known volume. The soil sample was collected by means core sampler without disturbing the natural structure of soil. Then labelling soil sample and was taken for the analysis of bulk density. Oven dried at 105oc for 24 hours, the weight of oven dried soil sample divided by its volume was given the bulk.
Calculating of soil organic carbon
Soil organic carbon was calculated by following the procedure of (Walkey and Black Method).
Soil carbon stock
The soil organic carbon stock was calculated by using the (Pearson et al., 2005):
Further it was expressed in ton/ha.
Total carbon stock density
The total carbon stock density was calculated by summing the carbon stock densities of the individual carbon pools using the Pearson et al. (2005) formula.
Carbon stock density of the study area:
C density = CAGB + CBGB + C LG + SOC
Where:
C density = Carbon stock density for all pools (t ha-1)
C AGTB = Carbon in above -ground biomass (t ha-1)
CBGB = Carbon in below-ground biomass (t ha-1)
C LG = Carbon in litter and grass (t ha-1)
SOC = Soil organic Carbon (t ha-1)
The total carbon stock is then converted to tons of CO2 equivalent by multiplying it by 44/12, or 3.67 (Pearson et al., (2005).
Data Analysis
The collected data was organized and recorded on the excel data sheet. All necessary biometrical data were obtained on the site and the laboratory this includes data on plot measurement and biomass measurements were checked for measurement errors, outlier and normality using statistical tools such as box plot. Statistical analyses were carried out using Microsoft excel of 2007 and SPSS software 16 version. Descriptive statistics, parameter estimates, and regression coefficients were estimated. One-way ANOVA was used.
Result and Discussion

Based on natural bamboo forest inventory the average Culm density of the surveyed sample plots of bamboo forest stand was 18,333 bamboo plant /ha and varied from 14,800 to 20,500 shown in the Table 1. The plant of age <1-year account for 18%, plant of 2-3 age 25%, and plant of >3 age represent 57% of the total number of bamboo plant in the studied area. The average DBH for plant of age <1, 2-3 and >3 was 5.63cm, 6.09 and 6.29cm respectively. The culms mean stock density (18,333Culm/ha) in this study area which is closer to (11,000- 20,000) reported by Yigardu & Mesresha [2] from the studies Choke mountain Northern western Ethiopia, but greater than that reported from studies in mesha natural bamboo forest stand (8840culm/ha) [3]. The possible reason is that there has been no harvesting of bamboo culm in the study area. The 0-20% slope had higher stand density (19,950) than the slope 21-40% (17,720) and slope 41-60 (17,199) as shown in Table 2 & 3.

Biomass partitioning among plant parts of A.alpina natural bamboostand.
The contribution of different components to the total bamboo plant biomass varied considerably. AGB accounted for most of the total bamboo biomass, with the stems, branches and leaves contributing 77.83%, 15.53% and 8.34% to AGB, respectively. Much of the bamboo plant biomass is held in the stem, which constitutes more than half of the total bamboo plant biomass, followed by branches and leaves. The proportion of stem, branch and leaves biomass from the destructive experiment amounted of the total above ground bamboo biomass was as shown in Table 4-7.


Biomass function
Regression equations were developed to relate total aboveground bamboo plant biomass (AGB) to diameter at breast height (DBH) for the three-age class. Age and DBH are often important predictor variables of bamboo biomass. An allometric relationship between the estimated total dry weight and the DBH was developed from the harvested bamboo trees. Regression models were subjected to analyses to determine the dry weight as dependant variable and diameter at breast height (DBH) as independent variable for all the different Culm age for the Ethiopia Highland. The results of models are shown in Table 8.
AGB=a+b.DBH
AGB=a.DBHb
ln(AGB)=a+b.ln(DBH)
log (AGB) = a+b log DBH
Where AGB is dry weight biomass (Kg), DBH is the diameter at breast height (cm), a and b are the regression coefficients.
Selection of allometric equation
The selection or development of reliable allometric biomass equations is an essential step in estimating the AGB of the forest (Brown et al., 1989; Chave et al., 2001; Chave et al., 2004; Chave et al., 2005). The basic idea of developing allometric equation is to estimate the difficult-to-measure tree characteristics (e.g. biomass) from one that is relatively easy to measure such as DBH (Goetz et al., 2010). Chave et al. (2004) pointed out that the most important source of error in forest biomass studies is the incorrect or inappropriate choice of allometric equation. Species-specific allometric equations, which are commonly used in the biomass study of temperate forest (Jenkins et al., 2003; Zianis et al., 2005), are not applicable to tropical forest which has high number of species per ha.

All relationships were shown statistically significant at p<0.05.
Allometric equations were developed for total biomass for different Culm age classes Ethiopia Highland bamboo using the data collected from the harvested culms. In this study four models have been developed based on destructive sampled bamboo plants, which used DBH as predictive variable and dry weight (kg) as independent variable. Allometric model comparison and selection were based on coefficients of determination (R2) smaller standard error and Significances of t-test and F-test < 0.05. Based on statistical indicators, the most suitable allometric equation model to estimate the amount of biomass and carbon stock of Ethiopia Highland bamboo at different age were as shown in (Table 8) power regression function has higher coefficients of determination (R2) and smaller standard error than those of other functions for different age clum of bamboo. Therefore the allome tric equation AGBage<1=1.139*DBH^2.158 (R² = 0.917), AGBage2-3 =0.36*DBH^1.78 (R² = 0.946), AGBage>3 =1.22*DBH^1.22 (R² = 0.909), and for pooled age AGB=1.68*DBH^2.68 (R² = 0.84) respectively was selected and also used for biomass estimates of the bamboo stand biomass measured non-destructively in this study. These equations were reliable to estimate the biomass and carbon stock of Ethiopia Highland bamboo of Adiyo Woreda.
Biomass and carbon stock in different pools
Biomass and carbon storage above ground
The biomass of each sample plot was calculated by summing up the biomass of bamboo plants existed within the sample plot. Then the carbon stock was assumed to be 45-50% biomass. For this study 50% of the biomass was used to calculate the carbon stock of bamboo. The minimum and maximum the biomass of 0.726 and 1.646 ton per plot and 72.6 and 164.6 per hectare was obtained respectively. The minimum and maximum carbon stock of this study was 0.363 and 0.823 tons per plot 36.3 and 82.3 per hectare respectively. The average biomass of bamboo was 1.446 tons per plot and 144.6 tonnes per hectare respectively. The average carbon stock was 72.3ton per hectare was obtained by combining carbon stock from the three-age group. The estimation mean aboveground biomass carbon stock for A.alpinaM (72.3ha-1), the study sites was higher than with the reported result (52 tone ha-1) by Kasahun Embaye [3], the variation of carbon stock in aboveground dependent on many factors such as the stand structure and composition, topography, altitude, disturbance.
Below ground carbon pool
Rhizome carbon stock
The rhizome carbon stock was calculated after calculating the rhizome biomass assuming it to be 20% of the aboveground biomass of the bamboo (Stokes et.al. 2007). The total Rhizome carbon stock per hectare was 14.46 tons.
Soil organic carbon
Bulk density (Bd)
The range of bulk density in natural Bamboo forest stand based on the entire profile (0-60m) depths is shown in (Table 8). There was large variation in the Bd with respect to depth in the bamboo forest soils. There was a gradual increase in the Bd with the increase in the soil depth in the three slopes selected for the studied. It was found that that as the depth increases the bulk density of the soil in the bamboo forest also gradually increases. The minimum Bd i.e. 0.6034gm/cm3 were found at the top soil (0- 20cm) while maximum 0.6084gm/cm3 at the depth of 40-60cm for the slope of 0-20% and at slope of 20-40% minimum bulk density was also found at top soil 0.6146 and maximum at depth of 40-60cm i.e. 0.7710. Similarly, at slope of 40-60% minimum bulk density was found at top soil i.e. 0.7145gm/cm3 and maximum at the depth of 40-60cm i.e. 0.9059gm/cm3. The Bd depends on several factors such as compaction, consolidation and amount of SOC present in the soil but it is highly correlated to the organic carbon content (Morisa et al. 2004, Leifeld et al, 2004).
Soil organic carbon

Note: SEM = Standard error mean.
The soil organic carbon in forest soil depends upon the forest type, climate, moisture, temperature and types of soil. Table 9 shows the depth wise distribution of SOC stock in the natural bamboo forests stand multiple comparison of means revealed that the SOC was higher at the upper layers in three of slopes of the bamboo forest. Maximum SOC value 83.00 ton/h was found at top layer while minimum 78.07ton/h were found at the lower depth at slope of 0-20%. 81.73ton/h, 68.56 ton/h and 56.40 ton/ ha and 34.10 ton/ha was found at top and bottom layers for the slope of 20-40 % and 40-60% respectively. Thus, it was found that there was effect of soil depth and slope on SOC.
The soil carbon content was highest in the surface horizon and declined with increasing soil depth. It was a common trend for soil carbon concentration to decrease with increasing depth, because the surface soil has more organic matter from litter than the sub soil. Soil organic matter is the same trend as soil organic carbon. Accordingly, these values were coinciding with the literature result recommended for soil organic carbon concentration.
The mean value of the sum of soil carbon stock in all layers along the soil profile is shown in Table 10. The carbon stock in the soil from the top layer of 0-20cm to 40-60cm depth for slope 0-20% of natural bamboo forest stand was found to be 240.69ton/ ha and 219.91ton/h and 156.06ton/ha for the slopes of 20-40 and 40-60% respectively. Observation made from this study indicates that cumulative soil carbon conserved from soil surface to the depth of 60cm ranges from 156.05ton C/ha to 240.69ton C/ha which is equivalent to 572.704ton CO2/ha and 883.332ton CO2/ ha. The SOC is more at top layer of soil because of the decomposition of leaf and litter which accumulates at surface. Only small amount of it reaches to lower layers of soil.

Total SOC in natural bamboo forest the studied area was found to be 205.553ton /ha, which implies bamboo soil has important implications in the manipulation of atmospheric CO2 (Table 11).
The soil organic carbon in forest soil depends upon the forest type, climate, moisture, temperature and types of soil. The laboratory result shown as 1.7% minimum and 6.891% maximum soil organic carbon concentration were recorded for bamboo in study area respectively. The soil carbon content was highest in the surface horizon (0-20cm depth) and declined with increasing soil depth. It was a common trend for soil carbon concentration to decrease with increasing depth, because the surface soil has more organic matter from litter than the sub soil. Soil organic matter is the same trend as soil organic carbon. Accordingly, these values were coinciding with the literature result recommended for soil organic carbon concentration.

Carbon estimation in litter and grasses
Litter layer and grass carbon stock in the three different slopes were shown in Table 7. The carbon content was calculated after calculating the litter layer and grass biomass assuming litter layer and grass biomass use of 47% the default carbon fraction provided by IPCC. The average carbon stock in Litter layer and grass of the bamboo stand studied was 2.17tons /ha.

Note: t = metric ton, h=hector.
The total carbon stock in litter layer and grass natural bamboo forest for the slope 0-20%, 20-40 and 40-60% 7.311t/ha, 6.954t/ ha, and 4.7t/ha respectively. Similarly, the higher litter layer and grass carbon stock was found at the slope range 0-20% i.e. 7.311 t/ha and 6.954 t/ha in 0-20% and 20-40% respectively. The higher value of litter layer carbon stock in the bamboo forest at the slope of 0-20% and 20-40% may be attributed to the higher above ground biomass and dense bamboo tree in the bamboo forest (Table 12).
The consequences of an increased litter layer and grass can increase the soil fertility, the land productivity for greater production and the prevention of land degradation. Therefore, litter layer and grass under bamboo forest have important implications in the manipulation of atmospheric CO2.
Total carbon stock and CO2 sequestered
The cumulative amount of carbon and CO2 sequestered throughout the study area was about 294.48t CO2 and 1080.74t CO2, respectively. This result represents the carbon stock and CO2 presented in aboveground, belowground, litter and soil organic matter. The SOC was accounted for 69.8% of the total carbon sequestered in the study area and the remaining 30.2% of the carbon was by the bamboo plant biomass, litter and grass. The carbon stock natural bamboo stand was found 294.48 that was sum of
Total carbon stock = CAGB + CBGB + C LG + SOC
72.3 +14.46 +2.17 +205.55= 294.48 per ha.
Therefore, the total amount of carbon stock and carbon sequestered was found to be 4,271.73 and 15,675.05 respectively in 14,506ha of Adiyo woreda. The significant amount of carbon sequestered at the study area (with total area of 14,504ha) indicates the potential and significant CO2 sequestration by natural bamboo stand and the soil. Thus, this study confirms that Ethio pia highland bamboo is a potential plant found in the study area in plenty amount that provides a substantial role in cleaning the atmosphere from CO2 [4-22].
Conclusion and Recommendation
Conclusion
Bamboo Forest offers potentially huge ecological and socioeconomic benefits. Especially as a sustainable carbon sink, it has begun to receive increasing attention. Estimation of the bamboo forest carbon stocks will enable us to assess the amount of carbon loss during deforestation or the amount of carbon that a bamboo forest can store when such bamboo trees are regenerated. The principal element for the estimation of forest’s carbon stocks is the estimation of bamboo forest biomass. Much attention is given to precisely measure how much biomass there is in the bamboo forest. Approaches in biomass assessment involve predictive modelling, thus, improving the quality of ground data and precision of models is very important. Above ground biomass assessment is critical to understand the influential role of forest in global carbon cycle and climate change. Precise models, specific to local conditions, and good quality ground data are important for accurate biomass assessment. In addition to determining the best fitting biomass models, based on a reliable and unbiased method of sample tree measurements. Although there have been numerous studies carried out to estimate the forest biomass and the forest carbon stocks, there is still a further need to develop robust methods to quantify the estimates of biomass of all forest components and carbon stocks more accurately.
Finally, the biomass equation developed for this study can be used to assess aboveground biomass in the bamboo forest of Adiyo bamboo forest, south west Ethiopia. Cumulative soil carbon conserved from soil surface to the depth of 60cm in natural bamboo forest ranges from 63,42ton C/ha to 93,81ton C/ha equivalent to 232,54ton CO2/ha and 343,97ton CO2/ha respectively.
Recommendation
a) Based on the conducted research study, following recommendation have been made.
b) Undertake further researches on different aspects, altitude, latitude, locality, climate, soil and elevation range (site quality) should be conducted for Ethiopia highland bamboo to develop general allometric equations that can be applied for AGB estimation of Bamboo forests in other regions where equations are not available.
c) The biomass equation developed for this study can be used to assess aboveground biomass in the natural bamboo forest of Adiyo woreda south west Ethiopia. However, model validation must be done. There are several methods of assessing tree-based biomass, hence can be used to verify the constructed biomass equation.
d) In this research SOC is calculated only up to 60cm depth so research should be conducted up to the 1m depth in different profiles.
e) Economic valuation of CO2 needs to be done at the governmental level so that CO2 can be traded to enhance the national economy.
f) Skill and training should be provided to the local people to enhance bamboo plantation and to improve their livelihood.
Public awareness should be raised about the global and climate change and the role of Bamboo forest in mitigating climate.
References
- Parresol BR (1999) Assessing tree and stand biomass: a review with examples and critical comparisons. Society of Amedcan Foresters 45(4): 573-593.
- Mulatu Y, Fanthun M (2013) Stand structure, growth and biomass of Arundinaria alpine (highland bamboo) along topographic gradient in the choke mountain, northwestern Ethiopia. Ethiop J Biol Sci 12(1): 1-23.
- Embaye K, Weih M, Ledinc S, Christerssona L (2005) Biomass and Nutrient distribution in a highland bamboo forest in southwest Ethiopia: Implications for management. Forest Ecol Manag 204(2-3): 159-169.
- Antonio N, Tome M, Tome J, Soares P, Fontes L (2007) Effect of tree, stand, and site variables on the allometry of Eucalyptus globules tree biomass. Canadian Journal of Forest Research 37(5): 895-906.
- Brown S, Lugo A (1984) Biomass of tropical forests: a new estimate based on forest volumes. Science 223(4642): 1290-1293.
- Clark DA, Brown S, Kicklighter W, Chambers Q, Thomlinson JR, et al. (2001) Net primary production in tropical forests: an evaluation and synthesis of existing field data. Ecological Applications 11(2): 371-384.
- Djomoa AN, Ibrahimab A, Saborowskic J, Gravenhorsta J (2010) Allometric equations for biomass estimations in Cameroon and pan moist tropical equations including biomass data from Africa. Forest Ecology and Management 260(10): 1873-1885.
- Gill SJ, Biging GS, Murphy EC (2000) Modeling conifer tree crown radius and estimating canopy cover. Forest Ecology and Management 126(3): 405-416.
- Heinsoo K, Slid E, Koppel A (2002) Estimation of shoot biomass productivity in Estonian Salix plantations, Forest Ecology and Management 170(1-3): 67-74.
- Holdern JP (1992). The energy predicament in perspective. In: Mintzer IM (Ed.), Confronting climate change: risks, implications and responses. Cambridge, Cambridge University Press, UK, pp. 163-170.
- INBAR (2006) The partnership for a better world - strategy to the year 2015. Beijing, China.
- Komiyama A, Poungparn S, Kato S (2005) Common allometric equations for estimating the tree weight of mangroves. Journal of Tropical Ecology 21(4): 471-477.
- Ketterings QM, Coe R, van Noordwijk M, Ambagau Y, Palm CA (2001) Reducing uncertainty in the use of allometric biomass equations for predicting above-ground tree biomass in mixed secondary forests, Forest Ecology and Management 146(1-3): 199-209.
- Leboeuf A, Beaudoin A, Fournier RA, Guindon L, Luther JE, et al. (2007) A shadow fraction method for mapping biomass of northern boreal black Spruce forests using Quick bird imagery. Remote Sensing of Environment 110(4): 488-500.
- Millard P, Sommerkorn M, Grelet GA (2007) Environmental Change and Carbon Limitation in Trees: A Biochemical, Ecophysiological and Ecosystem Appraisal. New Phytol 175(1): 11-28.
- Nelson BW, Mesquita R, Pereira JLG, de Souza SGA, Batista GT, et al. (1999) Allometric regressions for improved estimate of secondary forest biomass in the Central Amazon. Forest Ecology and Management 117(1-3): 149-167.
- Pidwirny Michael (2006) “Atmosphere layers”. Encyclopedia of Earth. In: Cutler J. Cleveland (Ed.), Environmental Information Coalition (EIC) of the National Council for Science and the Environment (NCSE), Washington DC, USA.
- Razakamanarivo RH, Razakavololona A, Razafindrakoto M, Vieilledent G, Albrecht A (2012), Below-ground biomass production and allometric relationships of eucalyptus coppice plantation in the central highlands of Madagascar. Biomass and Bioenergy 45: 1-10.
- Salazar S, Sanchez LE, Galindo P, Regina IS (2010) Above-ground tree biomass equations and nutrient pools for a para climax chestnut stand and for a climaxoak stand in the Sierra de Francia Mountains, Salamanca, Spain. Scientific Research and Essays 5(11): 1294-1301.
- UNFCCC, Land Use, Land-Use Change and Forestry, United Nations.
- Whittaker RH, Likens GE (1975) The biosphere and man. In: Lieth H, Whittaker RH (Eds.), Primary productivity of the biosphere. Ecological Studies, Vol. 14. Springer, Berlin, Germany, pp. 305-328.
- Zianis D (2008) Predicting mean aboveground forest biomass and its associated variance,. Forest Ecology and Management 256(6): 1400- 1407.


