


Impact of Sustained Discharge of Treated Wastewater Effluent on Wetland Water Quality
Roger Saint Fort*
Department of Environmental Science, Mount Royal University, Canada
Submission: April 03, 2018; Published: April 18, 2018
*Corresponding author: Roger Saint-Fort, Department of Environmental Science, Faculty of Science & Technology, Mount Royal University, 4825 Mount Royal Gate SW, Calgary, Canada, Email: rsaintfort@mtroyal.ca
How to cite this article: Roger Saint Fort. Impact of Sustained Discharge of Treated Wastewater Effluent on Wetland Water Quality. Int J Environ Sci Nat Res. 2018; 10(1): 555777. DOI: 10.19080/IJESNR.2018.10.555777
Abstract
This study investigated the impact on water quality of sustained discharge of treated wastewater effluent on the wetland commonly known as Weed Lake. A field sampling program was conducted during the months of May through September. Various physical, chemical, and biological analyses were performed on retrieved water samples. EC and TDS values increased both spatially and temporally from the south to the north quadrant of the wetland. Similar patterns were also observed for HPC and coliforms CFU enumeration. Turbidity and TSS decreased from May to June and then surged slightly while typically remaining constant from June to September. COD and TKN were found to decrease from May to July and to increase marginally from August to September. Potentially mineralizable nitrogen and phosphorous were ascertained as indices of the wetland sediment capacity for mineralizing both nutrients. Batch isotherms of PO4-3 were conducted for interaction determination with the wetland sediments.
The average value and standard deviation of potentially mineralizable nitrogen for the sediment samples was 15±12.92 mg/kg. Potentially mineralizable P was estimated at 29.67±11.96 mg/kg. The nitrogen pool of NH3-N in the wetland ecosystem was double the NO3-N pool. Langmuir data indicated an average maximum sorbing capacity of 190mg of PO4-3per kg of substrate. The value constants of maximum sorbing capacity ranged from 100 to 294mg of PO4-3 per kg of substrate. Total phosphorus concentration increased significantly from June to July and then decreased in September, these concentration changes were in parallel with algal and plankton blooms. Mass balance analysis indicated that 40 to 80% of phosphorous in Weed Lake is in various complex forms and not readily bioavailable. Labile-P and soluble-P represent a smaller fraction of the total-P. It appears that uncontrollable natural factors will have episodic and direct influence from year to year on the speciation of phosphorous and nitrogen in the wetland and influence also the spatial-temporal relationship status of its water quality. As a natural dynamic ecosystem, implementation and evaluation of best management practices should be continued together with subsequent evaluation.
Keywords: Water quality; Wastewater; Nutrient; Isotherm; Mass balance; Algae
Introduction

Weed Lake is a 6 km2 surface area of historic wetland and highly valued as an important natural feature within the community. Hereafter referred to as Weed Lake or wetland, its orientation is a south-north direction. The subject site is located 20 km east of the City of Calgary and northeast of the Hamlet of Langdon within the Municipality District (MD) of Rocky View No. 44 (Figure 1). Glenmore Trail and TransCanada Highway represent important access roads along the southeastern corner and the northwestern boundary of the Hamlet. Weed Lake was previously a healthy functioning wetland ecosystem characterized by important waterfowl production, breeding habitat and staging area for a large number of shorebirds in transit during migration. The wetland was drained in 1971. However, because of a variety of soil fertility problems, the expected agricultural benefits of draining the original wetland were never achieved.
A Restoration and Rehabilitation Program were initiated in 2006 to restore Weed Lake as a dynamic and fully functioning wetland ecosystem. Currently, Weed Lake is a productive ecological aquatic environment that hosts a variety of aquatic plants, namely: emergent aquatic vegetation, floating leaved plants, submergent aquatic plants and free floating plants. The climate of the area is described as being largely sub-continental characterized by short and moderately warm summers, brief spring and fall seasons. The winter is rather long. The ambient temperature typically ranges between -350C and 250C. Average annual precipitation is approximately 55 cm. The surrounding land uses around the wetland is primarily agricultural comprising mainly of farmstead parcels and un-fragmented quarter sections [1].
The soils of Weed Lake were classified as Rego Gleysols and the major portion of the upland as Solonetznic soils [2]. These soils, while high in soluble salts and sodium, are predominantly heavy glacial tills to clay loam. Soils in the dipressional areas are classified as Rego Gleysols and were developed in fine textured, lacustrine sediments. Weed Lake area is generally flat consisting of sections sloping gently from the west toward the lake at an approximate rate of 0.25%. The upland landscape is gently undulating. Two major depressional areas exist in the center of each SE and NW portions of Weed Lake TP 23 R27 W4. In some areas, the banks of Weed Lake provide a sudden and discernible drop in surface topography. Weed Lake received a constant source of tertiary wastewater effluent influxes from the Hamlet's wastewater treatment facility during the spring, summer and fall seasons. The wetland shore line is relatively flat with the lake depth being less than 1.20 meter over much of its area. Typical annual water level varies from 76 to 55 cm.
Storm water from the Hamlet flows into the lake through a network of major and minor ditch systems. Influx of storm water from the Balzac area also flows into Weed Lake and is routed through the main drainage ditch through the Hamlet. The former may carry considerable amount of sediments and salts, especially in the spring season. Irrigation water is in some instances supplemented to stabilize the wetland water level during periods of drought. Flows out of the wetland are controlled by an outlet located east of the wetland and is mainly drained by Rosebud Creek. The main objectives of this study were to ascertain Weed Lake water quality through the months of May to September, and to gain insights into the relationship between basic physicochemical and biological processes. Hence, the impact on water quality of sustained discharge of treated effluent in Weed Lake can be scientifically evaluated.
Materials and Methods
Weed Lake Surface Water Sampling
The wetland was sampled once a month through the months of May to September. Representative grab samples were retrieved from five sampling locations and their respective global positioning system (GPS) coordinates recorded. Subsequent sampling of the wetland was achieved based on each sampling location precise and unique identifier. All water samples were collected in one liter sterilized glass bottle at depth of 12 cm below the surface water level. The process involved lowering the capped bottle into the water column at the desired depth. The cap was then removed to allow water collection. Once filled, the bottle was capped, brought to surface and appropriately labelled. The water samples were then transported in Calgary and kept refrigerated at 70C for subsequent chemical and physical analysis. Field measurements of water temperature, dissolved oxygen (DO), and water level were performed at each sampling location at sampling time.
The remaining physical, chemical, and biological parameters were performed in the laboratory. Water samples for bacteriological analyses were collected from each sampling location in labeled, 50 mL sterile containers and brought back to Calgary. The sterile containers were transferred into a cooler for transportation. The cooler temperature was maintained at 50C. The samples were then serially diluted and incubated within 3 hours after sampling.
Weed Lake Potentially Mineralizable -Nitrogen (PMN) and -Phosphorous (PMP)
The process involved placing 10 g of air-dry substrate into a 150 mL acid washed Pyrex flask to which 25mL of 0.01mL CaCl2 was added [3]. The suspension in the flask was gently mixed, weighed, capped with Al foil and placed in the autoclave overnight at 1210C and 1500 kPa. Then, the flask and its contents were allowed to cool to room temperature, weighed, and quantitatively adjusted with deionized water. The mixture was transferred in centrifuge tubes and spun for 4 minutes at 4500 RPM and the liquid filtered through Whatman No. 2 filter paper. The difference between the autoclave treatment and the NH3-N, NO3-N and PO43 initially present in the substrate indicates the NH3-N, NO3-N and PO4-3 produced by autoclaving.
Weed Lake Batch Isotherm of Orthophosphate
To carry out the isotherm study, six sediment samples were collected from the bottom of the wetland using a hand Dutch auger. The substrates were transferred in one liter wide mouth glass jar, accordingly labeled and stored in the fridge at 40C. Prior to initiate the batch isotherm study, the samples were allowed to equilibrate with the room temperature. Batch testing was used to obtain the equilibrium sorption capacity of a given sediment sample for a corresponding concentration of phosphorous (PO4 3). This was achieved by developing equilibrium isotherms that describe the sorption capacity of the sediment exposed to various concentrations of aqueous solutions of PO43. Batch studies were conducted by gently mixing a specific amount of the sediment substrate with a specific volume of PO4'3 solution. The latter was prepared with deionized water. Each sorbate/sorbent system was then allowed to equilibrate overnight at room temperature and 80C, respectively. Following equilibration, the suspension was centrifuged at 5000 RPM for 4 minutes.
The supernatant from each system was retrieved and analyzed for the construction of the isotherms. The extent of PO4'3 sorption was estimated as the difference between initial concentration of PO4'3 and final concentration at equilibrium. Corrections were made for PO43 present in the original substrate.
Weed Lake Material Balance Analysis
Several assumptions were made in assessing Weed Lake, being a dynamic system with finite capacity to cope with anthropogenic inputs which can affect its intrinsic quality. A steady state equilibrium conditions exists between precipitation and evaporation,
a) A steady state equilibrium conditions exists between upward capillary groundwater movement and seeping water,
b) Outgoing water released through the gate doesn’t represent a significant enough volume of water to disturb the overall equilibrium status of Weed Lake under current water management,
c) Incoming water from any tributary doesn’t represent a significant enough volume of water to disturb the overall equilibrium status of Weed Lake,
d) The rate of organic matter decay in relation to nutrient mineralization are in equilibrium interaction with uptake by the aquatic vegetation and growth dynamics,
e) Lateral averaging assumes longitudinal and vertical hydrodynamics variations in velocities, constituents, water density, and temperature are negligible,
f) Sediment oxygen demand (SOD) is coupled to the water column dissolved oxygen.
Water quality interactions are by necessity simplified for descriptions of most aquatic ecosystems that are intrinsically complex. Hence, Weed Lake can be scientifically analyzed with considerable flexibility as a steady-state conservative system without any potential technical limitations of great significance. Based on Weed lake geometry and boundary, the major perturbations affecting the Lake hydrodynamics and quality during the investigated months of May through September are created primarily by wind and temperature induced circulation. In that regard, to a lesser extent by hydraulically induced turbulence and circulation. Wind causes Weed lake water column to be mixed through circulatory motion that extends to the bottom. This echoes the technical sentiment that complete water mixing occurs in the wetland boundary within a timeframe of 10 days. As a result, temperature differential between surface and bottom heat exchange is therefore considered conservative.
Analytical Program

*Not applicable; “Chemical oxygen demand; bTotal suspended solids; cTotal dissolved solids; "Dissolved oxygen; eSodium absorption ratio = {[Na/([Ca + Mg]/2)1/2}
The analytical testing program along with the associated quality assurance and control (QA/QC) for the study are depicted in Table 1. Standard recommended holding times were followed for the samples. Bacteriological analyses were performed on water samples collected in sterile jars. Serial dilutions were accordingly performed on the water samples. Subsequently, the diluted samples were incubated using the recommended Millipore media pad for heterotrophic plate count (HPC) and Escherichia coli (E. Coli) & Coliform organisms. The number of colony forming units (CFU) were enumerated and recorded.
Results and Discussions
Weed Lake Potentially Mineralizable Nitrogen (PMN) and Phosphorous (PMP)
The results of PMN as an index of potential mineralization of organic nitrogen to inorganic nitrogen forms of NH3-N or NO3-N are reported in Table 2. Reactive P initial present in these substrates were also evaluated and are reported in Table 3. The data indicate that the substrate found at the bottom of Weed Lake has the potential to contribute to the inorganic pools of N that is present in the water column. Total Kjeldahl nitrogen (TKN) which refers to the combination of ammonia and organic nitrogen ranged from 30 to 1.97mg/L likely contributes significantly to the mineralizable N pool. The average value and standard deviation of PMN for the six samples were 15±12.92 mg/kg while potentially mineralizable P was estimated at 29.67± 11.96mg/kg. Ratio of NH3-N/NO3-N was calculated for each autoclaved substrate and was found to oscillate around a ratio value of 2.


NA=Not applicable.
Therefore, the potential reserve of NH3-N in the wetland pool of PMN and PMP will vary with temperature, plants density, ecosystem is twice more than NO3-N. The dynamic and fate ofthat dissolved oxygen level, water level. Degree of hydrodynamicmixing of mineralized N is expected to be primarily driven by wind conditions. The results further indicate the presence of a pool of PO4'3 in the bottom boundary of the wetland. That pool is relatively bio-available for uptake by the aquatic plants that comprise Weed Lake ecosystem.
Weed Lake Batch Isotherm Study of Orthophosphate
Sorption isotherms are normally obtained by measuring the amount of solute sorbed for a number of different concentrations of sorbate under specific conditions. They often can be described by the Freundlich or Langmuir equations. The Freundlich isotherm, a commonly used curvilinear model has no upper limit to the amount of sorbate that could be sorbed by a system. The Freundlich equation, Equation (1) can be written as:

where X/M is the quantity of PO4'3 sorbed per unit mass of sediment (mg/kg), Ceq is the equilibrium concentration of PO4'3 in the solution (mg/L) and where Kd and n are the constants. The logarithmic form of the Freundlich equation to plot the data is shown in Equation (2):

The logarithm of the concentration of the solute in the sorbate state, X/M in mg/kg, is plotted as a function of the logarithm of the residual solute concentration, Ceq in mg/L. Linear regression of the data points yields a best-fit line with a slope of 1/n and intercept of log [Kd]. The slope, 1/n, is a measure of sorption intensity, and the Kd value, which must be determined by taking the antilog of the intercept, is the partition coefficient, an indicator of the sorptive capacity of the system. A Langmuir plot models a system where there are a finite number sorption sites. The Langmuir equation, Equation (3) may be expressed as follows:

Where X/M and C are the same units as defined above, bis a constant related to the binding energy (L/kg), and a is the maximum amount of solute that can be sorbed by the sorbate, is the soil uptake quantity (mg/Kg). The Langmuir equation can be rewritten in the following linear form shown in Equation (4):

[Ceq]/[X/M] can be plotted as a function of Ceq. The linear regression of the data points yields a best-fit line with a slope of 1/a and 1/ab as the intercept. The maximum amount of PO4'3 that can be sorbed onto the samples can be calculated from the Langmuir linear equation.
The isotherm models coefficients for the representative equilibrium studies are summarized in Table 3. The regression equations and the corresponding coefficient of determination (R2) are given in Table 3. It appears that the P sorption data of solution could be best described mathematically by the Langmuir equation. In this current case, the Langmuir data indicate that the Weed Lake sediment has an average maximum sorbing capacity of 190 mg of PO43 per kg of substrate. The value constants of maximum sorbing capacity ranged from 100 to 294 of PO4'3 per kg of substrate which reflect the heterogeneity in the composition of the sediment substrate. Therefore, the sediment substrate serves as a significant sink for PO4'3 as long as the sorbing capacity is not exceeded nor the pH becomes basic. The latter case has not been observed throughout the duration of the monitoring program.
Weed Lake Water Monitoring
The trend in water quality status of the wetland was compiled in Table 4 in a comparative summary as average values for the parameters tested for years 2009 to 2016, respectively. Under the objectives of this research project, the parameters were compared to current Surface Water Quality Guidelines for Use in Alberta with respect to Freshwater Aquatic Life for long term [4]. The guidelines are numerical concentrations or narrative statements recommended to support and maintain a designated water body. The wetland was scientifically analyzed with flexibility as a steady-state conservative system with limited potential technical limitations of meaningful significance. Based on its geometry and boundary, it is deduced that the major perturbations affecting the hydrodynamics and water quality during the investigated months are created primarily by wind and temperature-induced circulation and to a lesser extent by hydraulically induced turbulence and circulation.

aTurbidity Guideline; bTSS Guideline; cDO Guideline; dLake Temperature Guideline.
Wind causes water column mixing through circulatory motion that likely extends to the lower boundary of the water column. Complete mixing of the wetland water is conceived to occur within a time frame of ten days. As a result, temperature differential between surface and bottom heat exchange is considered conservative as well as spatially throughout the water mass. Observed temperature difference, AT, is less than 20C, both in the water column and spatially, irrespective of the sampling month. Temperature differential between surface and bottom heat exchange is considered conservative [5]. As expected, the importance of hydraulic, thermally, and wind- induced circulation in active interactions and combinations in bringing about dynamic changes in Weed Lake water quality varies depending on the specific parameters. Analysis of water quality indicators show that some parameters are more affected in varying degree in their distribution pattern with respect to spatial and seasonal variations.
Data spatial variability within a sampling event appears not to be significantly different from one sampling point to the next. Annual recorded chemical and physical parameters for grab samples tend to marginally increase spatially and temporally with corresponding standard errors ranging from 1.3% to 15%. This supports the assumption that complete mixing of Weed Lake water column is enhanced through wind induced circulation patterns which negate the geometry effects in inducing intrinsic spatial variability. Biological parameters of HPC-total and E. coli & Coliform colony forming unit (CFU) enumeration tend to decrease from the south to the north quadrant of the wetland. The south quadrant is where the pipe discharges treated effluent from the wastewater plant into the wetland.
Enumeration of CFU for both biological parameters spatially appear to vary randomly, hence no discernible pattern could be denoted. However, the level of CFU enumeration tends to increase with temperature. The lowest level of bacteria and coliform organisms are typically denoted for the months of May and September. CEC and TDS values tend to increase both spatially and temporally from the south to the north quadrant. This could be best attributed to influxes of storm water diverted into the wetland. Turbidity and TSS generally decreased from May to June and then marginally increased to remain constant from June to September. COD and TKN typically decreased from May to July but slightly increased from August to September. The trend observed in relation to turbidity, TSS, COD and TKN clearly reflects the combining effects of hydrodynamic mixing with a high degree of photosynthesis and metabolic synergistic relationships between algae and bacteria.
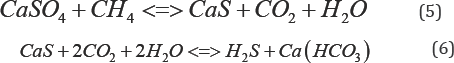
Furthermore, when ascertaining the trend in the data for the average parameters from years 2009 to 2016 (Table 5), a pronounced difference can be observed. Both spatial and temporal variations can be best corroborated to operational changes, natural factors, and seasonal variations. These factors will interact to accordingly create new episodic dynamic equilibrium in the wetland functional systems. According to Table 5, the trend in values for pH, DO, and water temperature remained the most relatively stable as denoted by their respective standard deviation and standard error. The overall stability of the pH is also a good indication of the wetland buffering capacity. Functionally, the ability to resist change in pH can be attributed to the presence of CO2, CO3-2, HCO3- and organic matter whose origins are primarily of natural sources and from operational activities (i.e., wastewater effluents) to a lesser degree. Given the presence of decomposable organic materials at the bottom of the wetland, the following reduction processes may be occurring. They may naturally further sulfate-enrich the water chemistry and contributing to the buffering capacity as depicted in Equation (5) and Equation (6):

The presence of dissolved oxygen is of fundamental importance in maintaining aquatic life and the aesthetic quality of Weed Lake. Because of this importance, oxygen can be regarded as one of the most important water quality parameters.The impact is measured as oxygen demand, a parameter that can be interpreted as a gross measure of the concentration of oxidizable materials present in the water column and as a status of potential organic load. Through the metabolic action of bacteria, organic material (OM) in the water column is oxidized to its lowest energy state through the following mechanisms, Equation (7):

Dissolved oxygen profile in the water column tends to increase from the months of May to June (representative average 8.94 mg/L) and then drastically decrease during July and August (representative average 4.07 mg/L) to subsequently route to a marginal increase in September (representative average 6.42 mg/L). No stratification of dissolved oxygen was denoted in the water column during any of the monitoring programs. Dissolved oxygen at the bottom-water interface was totally lacking, therefore making it an anaerobic, organic matter rich boundary in the wetland. Above the anaerobic substrate layer, an intermediate transition zone was not identified which contained dissolved oxygen. Following episodic discharge of treated wastewater effluent, its mixing through the water column, and after some time has elapsed, several changes occurred.
The various inter and intra relationships between wind action, temperature, precipitation, and sunlight are germane to the wetland intrinsic stabilization processes. In that regard, these factors are natural and not controllable. Based on dissolved oxygen readings, stabilization reactions appear to be aerobically dominated. During the stabilization processes, much of the biodegradable organic matter pool is transformed by bacteria into living organic matter. As a by-product of their metabolism, they release through mineralization into the water column CO2, nitrates, phosphates, sulfates, and other mineral salts. A conceptual framework depicted in Figure 2 provides a fundamental representation of physicochemical and biological dynamics occurring in the wetland. Such conceptual model would aid in long-term nutrient mass balance monitoring and developing a better understanding of nutrient systems behavior.

Aerobic stabilization is highly influenced by the hydrodynamic mixing created by wind action, temperature, and sunlight. However, at lower temperature like during the months of April, May, and October, the overall biological activities and therefore, the stabilization processes in Weed Lake are slower. Consequently, the algae level remains relatively low. As temperature of the wetland water column increases, this triggers in response higher algae metabolic activity. Under the additional favorable natural conditions of peak solar radiation during the months of June and July, algae proliferate. They absorb light and use the mineralized by-products during this highly photosynthetic period. Their cellular material releases oxygen in the water column, often giving rise to supersaturated conditions in some instances. Furthermore, the combination of high temperature, dissolved oxygen and solar radiation as well as the quick stimulation of bacterial activity enhance oxygen consumption.
This therefore stimulates blue-green algae (Cyanophyceae) to grow exponentially relative to the more efficient green algae (Chlorophyceae). As a result, heavy algal blooms are observed in the wetland with thick green mats appearing on the water surface. From this point on, anaerobic conditions arise, the column water is typically turbid and objectionable anaerobic odours are produced and released. The month of August typically produces anaerobic conditions as evidenced by dissolved oxygen average concentration of 2.73 mg/L. Since algal oxygen production is a direct function of photosynthesis, a gradual decrease in water temperature will be accompanied by decreased algal activity and therefore lower oxygen production. Consequently, the floating green mats on the water surface impair light penetration. Consequently, decreased photosynthesis in deeper portions of the water column results in decreased oxygen production together with a decrease in algal activity.
Under these conditions, wind action doesn't mix the water mass sufficiently to transport oxygen from the surface to the lower layers. At this point, the algal mass starts dying off, decaying through induced microbial decomposition, which results in the settling of biomass to the bottom boundary. This leads to the development of an organic layer of substrate that works as an anaerobic digester. It is noteworthy that this chain of events represents the natural ecological order and stabilization processes in the wetland. The COD test was used to ascertain the organic carbon content. Unlike biological oxygen demand (BOD), the COD test does not differentiate between biologically oxidizable and inert organic matter. Based on the overall trend in the data analysis, COD values tend to decrease from May to June as well as July but the COD values then increase or decrease from June to July and tend to increase during the months of August to September.
Typically lower DO readings are observed in July and August because of the past presence of higher level of oxidizable materials in the water column. Minimal DO stratification was observed throughout the depth of Weed Lake indicating significant longitudinal and vertical hydrodynamics mixing in the water column. Anoxic characteristic of the wetland in May results in some degree of objectionable odor as a result of bacterial reduction of NO3-, SO42, NH3-N, and other products of bacterial growth. Algae growth was more abundant during the months of May to July but significantly decreased during the months of August and September. Depicted in Tables 6-10 is the ratio of total-P/NH3-N for the wetland water column and treated effluent as well as the ratio for PO43/NH3-N for selected representative years. The ratios can be used as an important determining factor in assessing on an ongoing basis the management of the water quality with respect to effluent influxes and episodic water release from Weed Lake.


Main Nutrients Budget Analysis
The wetland aquatic environment is the host for a variety of aquatic plants namely emergent aquatic vegetation, floating leaved plants, submergent aquatic plants and free floating plants. The months of May to September mark the periods of active microbial and aquatic growth in Weed Lake. The data indicate that in order to maintain proper water quality and managing algal bloom as well as potential offensive odor, particularly for the critical months of July and August, it would be prudent to maintain a treated effluent discharge with a ratio of total-P/ NH3-N around 0.55. However, an effluent ratio of total-P/ NH3-N between 0.55 and 1.45 should be effectively adequate in maintaining proper water quality of the wetland.
A significant improvement in the wastewater treated effluent quality has been observed from the data recorded between the years 2010 to 2014. The results indicate for the year 2014 a treated effluent ratio of total-P/NH3-N ranging from 0. 05 to 0.74 and a water column ratio of PO43/NH3-N varying from 0.14 to 0.23. With respect to year 2010, the treated effluent ratio of PO43/NH3-N oscillated between 0.13 and 1.22 while the water column ratio of PO4-3/NH3-N varying from 0.26 to 1.02.
Variations in those ratio values were the norm for the other comprising monitoring years. Consequently, the water column ratio of total-P/NH3-N and PO4-3/NH3-N significantly improved from 2010 to 2014. The water column ratio of total-P/NH3-N in 2014 was established to range from 0.30 to 1.88 while it was from 1.07 to 2.68 in 2010. Furthermore, in 2014, the water column ratio of PO43/NH3-N ranged from 0.14 to 0. 23 compared to year 2010 in which case it ranged from 0.26 to 1.02 (Table 7).
In a manner similar to nitrogen, phosphorous in the wetland is expected to cycle between organic and inorganic forms. However, phosphorous unlike nitrogen doesn't cycle as a gas. It has to be assumed that labile-P, the not so strongly sorbed intermediate form by the wetland sediment, represents a smaller fraction of total-P. It may enter in equilibrium with soluble-P to increase the level of orthophosphate in the wetland water column. Hence, the material balance constructed for phosphorous is orthophosphate and will be considered as the only form of phosphorus that is readily used by any aquatic plants and microorganisms in the wetland ecosystem. Therefore, significant amount of orthophosphate is removed through algal and macrophytes growth but more significantly during the months of May, June and July. As result keeping orthophosphate concentration relative low throughout the wetland ecosystem boundary.
Concurrently, conversion of dissolved forms of phosphorus into insoluble forms such as calcium phosphate Ca3(HPO4)2, magnesium phosphate Mg3(HPO4)2, and ferric phosphate FePO4 and AlPO4 complexes will contribute to the removal and control of PO43 concentration level as well as to controlling its buffering capacity. Additionally, phosphorous bioavailability may be significantly affected through organic complex formation with humic and fulvic acids. Given the water pH being greater than 8.50, assumptions must also be made regarding the activities and contribution of Al retention of PO43 onto the sediment as AlPO4 complex. The later complex will be closely related to the contents of acid-extractable Al+3 in the sediment. Total phosphorus (i.e., P-inorganic and P-organic) concentration increased significantly from June to July to decrease in September which parallels algal and plankton blooms (Table 8).
Weed Lake Material Balance Analysis
A simple water budget approach was used to analyze the water level dynamics in Weed Lake Equation (8):
A simple water budget approach was used to analyze the water level dynamics in Weed Lake Equation (8):

R = Volume of present in the wetland at any time,
Pr =Annual precipitation,
Inwt = Incoming water from the wastewater treatment plant, Tr = Tributaries feeding into the wetland,
Ca = Capillary groundwater feeding the wetland,
E = Evaporation of water from the wetland,
vap r '
Se = Seepage water from the wetland,
Out canal = Water released in the canal via the gate.
Therefore, the above water budget equation for the wetland can be simplified and rewritten as Equation (9):
Of special significance to the wetland water quality management program are nitrogen and phosphorous. The interrelationships that exist between these two nutrients are best manifested in their fundamental importance in eutrophication. A mass balance analysis was performed for phosphorous and nitrogen, both being the nutrients of greatest input from the wastewater effluent being regularly discharged into the wetland. The following assumptions were derived in formulating the mass balance analysis for nitrogen and phosphorous (Tables 9,10). Assumptions made for nitrogen:
i. Biological conversion of organic-N ---> NH3-N is not significant from November to April
ii. Mineralization of NH3-N ---> NO3-N is not significant from November to April
iii. Biological reduction of NH3-N ---> NH3 (g) is not significant from November to April and, assumptions for phosphorous:
iv. Biological conversion of organic-P --->PO43 is not significant from November to April
v. Formations of insoluble forms of Ca (HPO4)2 and Mg (HPO4)2 are nominal relative to the overall process of soluble PO4-3 removal by microorganisms, algae and plankton.
vi. Equilibrium reaction exists between soluble PO43 <---> sediment sorbed PO4'3
vii. The material balance equation for can be written Equation (10) for each nutrient of interest:

Total-P, PO4'3and NH3-N are expected to undergo significant biotic and abiotic interactions during the months of May to September. Their decay rate could be modeled as a first-order reaction Equation (11). That is

where K is the reaction rate coefficient with dimensions of 1/ time and C is the nutrient concentration. According to Equation (11), the rate of loss of any of these nutrients is proportional to the amount of available substance that is present in the water column. The integrated first order rate law yields Equation (12):

where C is the initial concentration of NO-N or PO'3 at first

The regression equations for rate constant, K, determination of NO3-N and PO43 for selected years were derived for the wetland most biologically active period (Table 11). Assuming that both nutrients are uniformly distributed throughout the wetland water column, hence the total amount of a nutrient is calculated as CV according to Equation (14). Thus,

where C represents the concentration of nutrient and it is uniformly distributed throughout the volume, V, of the wetland water column. The material balance becomes Equation (15):

Monthly phosphorous and nitrogen load (MLP or N) as a result of effluent discharges can be calculated Equation (16):

Where, EmV represents monthly volume of effluent (L) and CE, effluent concentration (mg/L). Therefore, average volume of water (LV) in the wetland at sampling time Equation (17):
The mass balance analysis reveals a decreasing trend in nutrients level in the wetland. In 2012 the water matrix consisted of 45% of PO4-3 which translated into a load of 1.32 x 10⁶ g with a corresponding load of 8017g of NH3-N meaning a ratio of PO4-3/NH3-N of 165:1. Concurrently, 55% of phosphorus can be assumed to be in the forms of condensed-phosphates and organically bound-phosphates which represent a load of 1.63 x 10⁶g. With respect to 2013, the wetland water matrix was made up of 35% PO43. Which translated into a load of 1.34 x 10⁶ g with a corresponding load of 1.6 x 10⁵ NH3-N. Hence 65% of phosphorous in the water mass can be assumed to be in complex forms. For year 2014, it was determined that 82% of phosphorous status was in various complex forms. The direct impact of various uncontrollable natural factors will influence the speciation of phosphorous and nitrogen in Weed lake from year to year.
Nonetheless, if too much nitrogen enters the wetland through effluent discharge to offset the current nutrient ratio PO4-3/NH3-N, the result will likely be rapid and significant growth of aquatic vegetation in nuisance quantities and eventually lowering DO content due to the death and decay of the aquatic vegetation. As a natural dynamic system, implementation and evaluation of best management practices of Weed Lake should be continued and accordingly evaluated in order to strive to achieve and maintain a healthy wetland ecosystem.
Conclusion
The results of the Weed Lake water quality monitoring program study indicate spatial and temporal variations in the concentrations of the parameters tested. EC and TDS values tend to increase both spatially and temporally from the south to the north quadrant. Similar trend has been observed as it relates to HPC and coliforms CFU enumeration. Mass balance analysis indicates that 40 to 80% of phosphorous in the wetland water column is in various complex forms. Uncontrollable natural factors will have a direct influence from year to year on the speciation of phosphorous and nitrogen in the wetland ecosystem. Any surges or significant departure from the current nitrate inputs will have the potential to adversely affect the water quality and health of the wetland.
Acknowledgment
The author would like to thank the MD of Rocky View No. 44 for supporting this project.
References
- (2016) Rocky View County, Area Structure Plan Langdon. Bylaw C-7564.
- Walker BD, Pettapiece WW (1996) Soils of the Gleichen Area. Alberta Soil Survey, Report No. 821-SW.
- Klute A (1996) Chemical and Microbial Properties. In Methods of Soil Analysis (2nd edn.); American Society of Agronomy, Madison, WI, pp. 167-693.
- (2014) Alberta Government. Surface Water Quality Guidelines and Objectives.
- (2014) Environmental Quality Gudilines for Alberta Surface Waters.


