


Ground Water Quality Index of Growing Smart City of Vadodara
Sazia Barodawala, Pruthviraj Parmar and Bablu Prasad*
Department of Environmental Studies, Faculty of Science, Maharaja Sayajirao, University of Baroda, Vadodara, Gujarat, India
Submission: February 21, 2018; Published: MMarch 15, 2018
*Corresponding author: Bablu Prasad, Department of Environmental Studies, Faculty of Science, The Maharaja Sayajirao University of Baroda, Vadodara, Gujarat, India, Tel: +91 7435909032, Email: akashganga812@gmail.com
How to cite this article: Sazia B, Pruthviraj P, Bablu P . Ground Water Quality Index of Growing Smart City of Vadodara. Int J Environ Sci Nat Res. 2018; 9(2): 555759. DOI: 10.19080/IJESNR.2018.09.555759
Abstract
In current investigation ground water quality were monitored and assessed along the urban area of Vadodara including Gorwa, Nizampura, Harni, Gotri, Sayajiganj, Fatehgunj, Ajwa Road, Tandelja, Lal Baug, Makarpura and Tarsali monitoring station. Electrical conductivity, TDS, turbidity and alkalinity were found to be higher as compared to BIS standards of drinking water due to presence of ions such as Na+, K+, Ca2+, Mg2+, PO43-, SO42, NO3- and Cl-. Ground water quality index (GWQI) was calculated on the basis of BIS standards of drinking water specification. The calculated GWQI for these sampling stations ranges from 41 to 193 with a mean values 100. Based on GWQI, most the ground water samples have been included in good water to poor water category. GWQI analyses showed better ground water quality in the monitoring stations located in the underdevelopment area of the city than those stations located in the developed area. These results evidently indicated the use of water filtration or/and treatment before consumption of ground water of Vadodara city and it is also needs to be protected from contamination.
Keywords: Ground water quality index; Ground water; Drinking water; Water monitoring; Vadodara
Abbreviations: GWQI: Ground Water Quality Index; TDS: Total dissolved solids; TSS: Total Suspended Solids; TS: Total Solids; DO: Dissolved Oxygen; COD: Chemical Oxygen Demand; WQI: Water Quality Index
Introduction
Groundwater has been extensively used in Vadodara on account of its near universal availability, dependability and low capital cost. Dynamic nature of groundwater resources are affected by different factors such as urbanization, industrialization and irrigation activities [1]. The aquifers are highly affected by the introduction of physical, chemical and biological pollutants although, groundwater are filtered through the soil. Rapid urbanization has affected the availability and quality of groundwater due to it’s over exploitation, open defecation, leach ate generation from the sludge, and improper waste disposal [2]. Vadodara is a semi-arid region of Gujarat with 4.1 million human population (according to the 2011 census) and mainly relay on ground water resources. The demand of ground water in Vadodara has increased due to its agriculture expansion; urbanization, industrialization, etc. which lead to depletion of ground water resources. The main goal of the present study is to evaluate the groundwater quality in shallow and deep aquifers with respect to time and place in parts of Vadodara district for the purposes of drinking and irrigation. Local, regional, and global assessments of water quality monitoring are the key component of environmental management of aquatic resources.
Furthermore, it is crucial to understand influence of various activities on water resources both in terms of negative and positive impact. In current investigation, physico-chemical and biological parameters namely temperature, pH, conductivity, total dissolved solids (TDS), total suspended solids (TSS), total solids (TS), dissolved oxygen (DO), free CO2, turbidity, alkalinity, acidity, total hardness, calcium hardness, magnesium hardness, calcium, magnesium, sodium, potassium, sulphate, phosphate, nitrate, chloride, chemical oxygen demand (COD) and total coli forms of ground water samples of Vadodara City were assessed for a period of four months (December 2016 to March 2017). The ground water quality index (GWQI) is one of the major evaluative techniques to quantify the level of water pollution with respect to a specific standard. The GWQI number is a weighted arithmetic index computed by combining selected water quality parameters to assess water state with relative to its desirable water quality objectives and to communicate information on overall quality status of water to the concerned user community, policy makers and to the environmentalists [3,4]. Moreover, it is important to have prior information on the quality of ground water resources available which will aid planning of developmental projects, since restoration of ground water quality takes longer time period than any other water resources. Thus, GWQI becomes an important parameter for the assessment and management of groundwater, especially for growing smart city of India such as Vadodara. Recently, water quality index (WQI) has been extensively used to monitor water quality of various water resources and also used for water resources management [5-12]. In this study, multivariate analysis methodology developed was used to calculate a GWQI.
Materials and Methods
a. Sampling station
The ground water samples were collected from eleven sampling station located at Vadodara district of Gujarat, India (Figure 1). Vadodara is the 18th largest city in India located at 22.30N, 73.190E in western India at an elevation of ~39 meters between two major rivers of Gujarat namely Mahi and Narmada River with an area of ~149 km2. Groundwater in Vadodara district occurs both as confined and unconfined conditions. The depth to water is greater in upland areas whereas in valley portion and shallow grounds, the levels are very close to surface. In hilly terrain of eastern, north east and south east part of the district, spring zones are seen in stream river section; also along the section of the Mahi, the Narmada and the Or sang rivers. In major part of the district, in north and almost in eastern half of the district, the hard rocks, such as phyllite, schist, granite, gneiss, basalt and other sediments such as sandstone, limestone etc., form aquifers, whereas multi layered alluvium deposits form aquifer system in remaining central, south-central and western half of the district. The weathered basalts, granite, gneiss etc., covered by soil and the valley fill & deposits forms potential aquifer in the vicinity of rivers and on vast undulating plains adjacent to hilly terrain but their regional continuity and extent are limited due to heterogeneous nature of deposits with limited thickness and as such rarely exceed a few square kilometres [13].

Vadodara district area has varied ground water extraction structures, appropriate to different hydro geological units and necessity. Various types of dug wells are common to both alluvial / soft rock areas and also in hard rock areas. In unconsolidated formation the depth of dug well is few meter to more than 25m; while in hard rock areas, generally their depth depends upon weathering zone, through which they have curbing and below it have naked zone. With declining water levels along with rapid development, bore well of 30 to 90m depth are drilled at bottom of dried up dug well section and such well are termed as dug cum bore well, are common in both unconsolidated & consolidated formation of the district. In consolidated rock units, especially in Deccan Trap areas, horizontal bores at the bottom of the well, with gentle gradient towards well are common. Large diameter, collector type wells, generally for regional water supply or for industrial uses is common in sandy beds of Mahi and Or sang rivers. To meet large demands bore well / tube wells are common structures. There are shallow bore wells up to 60 to 80 m depth both in consolidated and unconsolidated areas. Such bore well, in hard rock areas are drilled for hand pump and also for irrigation purposes. Samples were taken from bore wells covering almost all the area of Vadodara city including Gorwa, Nizampura, Harni, Gotri, Sayajiganj, Fatehgunj, Ajwa Road, Tandelja, Lal Baug, Makarpura and Tarsali monitoring station (Table 1). The samples were collected in plastic bottles and prior to sampling; all sampling bottles were rinsed and washed with respective ground water.

b. Analyses of water Parameters
The temperature, pH, electrical conductivity and dissolved oxygen of each water sample were measured in situ. The other parameters, namely total suspended solids (TSS), total solids (TS), total dissolve solids (TDS), acidity, alkalinity, sodium (Na+), potassium (K+), calcium (Ca2+), magnesium (Mg2+), nitrate (NO3-), sulphate (SO42') total phosphate (PO43-), chloride (Cl-), Hardness, chemical oxygen demand (COD) and total coli form (MPN) were analysed in laboratory using the analytical techniques following the standard methods [14]. All the samples were analysed in triplicate and mean were compared to the Bureau of Indian Standards of drinking water specification (IS 10500:2012) [15].
c. Ground water quality index (GWQI)
Water quality index were calculated using BIS 10500:2012 standards of drinking water specification listed parameters by assigning a weight (W) of each selected parameters according to its relative importance in the overall quality of water for drinking purpose (Table 2). The maximum weight of 5 was assigned to the parameters like nitrate due to their major importance in water quality assessment [16]. Calcium and magnesium were given the weight of 2 as it plays an insignificant role in the water quality assessment. Other parameters like total dissolved solids, chloride, sulphate, alkalinity and total hardness were assigned weight 3 to 4.

GQWI were computed using the following equation:
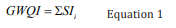
In Equation 1, SI. is the sub index of ith parameters. Sub index of each parameters were computed using the following equation:
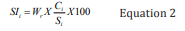
In equation 2, SIi is the sub index of ith parameters, Wr is the relative weight of respective parameters, Ci is the concentration of ith parameters and Si is the standards of ith parameters according to BIS 10500 2012. The relative weight (W) is computed from the following equation:
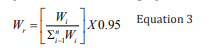
In equation 3, Wr is the calculated relative weight, Wi is the weight of each parameter and n is the number of parameters.
Results and Discussion
Result of water analysis of ground water monitoring stations showed comparable values with a marginal deviation. The pH of the sampled wells was varied from 6.85 to 8.05 indicating neutral to slightly alkaline condition which is suitable for portable purposes. The TDS varied between 440 to 1235 mg/L with a mean value of 887mg/L indicating presence of high amount of minerals. Further analysis of water samples indicated high amount of chloride and hardness. However others ions such as Na+, K+, Ca2+, Mg2+, PO43-, SO42-and NO3- were found to be trace to moderately high. The hardness is an important parameter of water quality whether it is to be used for domestic, agricultural or industrial purposes. Total hardness of the eight sampling stations was above the Indian Standards (IS10500:2012). The Ca and Mg concentrations in one and seven monitoring stations respectively were found above the standards. The nitrate concentrations in all the ground water samples were well within the limit of standards. Nitrate losses from non-point agricultural sources, mainly originated by fertilizers application, have been recognized as one of the most serious threats for pollution of groundwater [17]. Nitrates may themselves be carcinogens or may be converted in the body to a class of compounds known as the nitrosamines, compounds that are known to be carcinogens.
Chloride concentration of four out of eleven monitoring stations was found to be above the standards for drinking water. A report showed that people drinking chlorinated water over long periods have a 21% increase in the risk of contracting bladder cancer and a 38% increase in the risk of rectal cancer [18]. These minerals can be found naturally in groundwater through the weathering of rocks and soil or due to the human activities such as leach ate from dumps or landfills or use of excess chemical fertilizers. These parameters are regarded as pollution indicator in the water bodies [19,20]. The possible reason for this observation could be the leaching of minerals from earth crust and untreated waste disposal. In addition, there are other factors that contribute to the change in physical- chemical status of ground water bodies such as biological uptake, mineralization, transformation, decomposition, rainfall, infiltration rate, number and size of cracks, texture of soil, topography, water table and average flow rate of water inside the soil and ionic exchange [21-23]. The concentrations of total coli form in water of all the sampling stations were found to be high and failed to meet the BIS standards which suggested unsuitability of water for drinking without treatment.
Water which occurs beneath the earth surface is generally considered to be free from contamination because of purification of the former in the soil column through the anaerobic decomposition, filtration and ion exchange. Hence unstable but anthropogenic as well as natural activities affecting the quality as well as quantity of this valuable resources due to unplanned activities for the past few decades. The major impact on water bodies is caused by erosion, mixing of solid waste, contamination and discharge of mine effluent in water bodies. Due to mining operations the major impact is lowering of water table and reduction in overall water quantity (Figure 1).
However the overall degradation of groundwater quality is the function of prevailing conditions of aquifer, types of aquifer, availability of groundwater in aquifer, yield of recharge water to the aquifer during the year, hydro geological conditions of aquifer, level of exploitation of groundwater and influence of other sources of pollution like dumping of industrial waste or domestic waste, etc [24]. In current study, the correlation coefficients among fourteen water quality parameters namely pH, Electrical conductivity (EC), TDS, total hardness, turbidity, Ca2+, Mg2+, Na+, K+, Cl-, SO42-, NO3- and PO43- were calculated for correlation analysis. EC and TDS show good positive correlation with Chloride and Sulphate and also exhibit high positive correlation with Calcium, Magnesium and Nitrate ions. Ground water samples were classified into five categories according to the GWQI values computed using Equations 1 to 3. GWQI values <50, 50 to 100, 100.1 to 200, 200.1 to 300 and >300 were included in excellent, good, poor, very poor and unsuitable for drinking, respectively. The calculated GWQI were found to be in the range of 41 to 193 indicating excellent to poor water with mean values of 100 (under good categories). The results of GWQI analyses showed better water quality in the monitoring stations located in Lal Baug, Tandelja and Gorwa (Figure 2).

However, ground water of monitoring station located at Harni was found to be close to very poor water categories. This is due to very high Chloride (1296±37mg/L) and Hardness (753±24mg/L as CaCO3) present in ground water of Harni water monitoring station. Various water filtration techniques would be crucial before drinking ground water from Harni area. Based on current analyses it is event that the ground water of Vadodara is good and it can be used for drinking purposes after disinfection such as chlorination, UV treatment, solar sterilisation, etc. Based on forgoing discussion, it is evident that the ground water in Lal Baug, Tandelja and Gorwa is suitable for public supply after the disinfection procedure to meet the specification as per the Bureau of Indian Standards for drinking water [15]. On the other hand, ground water quality in all other water monitoring stations are threatened or impaired and conditions usually depart from desirable quality as required under public supply. However, most of the monitoring stations had excellent to good condition/status of water if utilized for agriculture, irrigation and other purposes. Based on current GWQI monitoring of water samples, none of the samples were fall under the categories of very poor water and "unsuitable for drinking water. However, >90% of ground water samples exhibited under the categories of good to poor and rest of the samples were fall under the categories of excellent water quality (Figure 3). To the best of our knowledge, GWQI of Vadodara has not been reported in the literature. However, average GWQI values of Vadodara sampling stations were comparable with the values calculated using water parameters of ground water reported in the literature [25-28]. GWQI of Vadodara was found to be in the categories of good water since year 2013 (Figure 4). It can be also noted that the value of GWQI obtained in year 2015 were very close to the excellent water categories. This is possible due to dilution of ground water by flood water which is reported in the year of 2014 [29].


Despite the fact that the use of this GWQI may not be the best way to understand large-scale ground water quality conditions, for specific use, it would be the best way. It can also overcome communication problems between scientists and water managers or policymakers or environmentalists. Their application should always involve the necessary prudence, as standardization and aggregation of the variables are subjective procedures accompanied by a loss of information. Therefore, the index can never be considered as a final quantitative assessment of capability of groundwater to be used as a reliable source of drinking water but should be applied as a purpose-specific water management tool.
Conclusion
The change in degree of water pollution of ground water has been observed to be insignificant with the exposure of Vadodara urban area in last five years. Based on current investigation, it can be concluding that the growth and development in urban area had insignificant effects on ground water quality in short duration. However, longer duration of development need to be investigated further to understand the correlation of growth and development over ground water resource quality. The information provided by the GWQI is a useful tool for describing the state and trends of the ground water quality. The GWQI is useful as decision tool in decision-making related to water resource protection, improvement, utilization towards a sustainable water resource management and environmental planning. This study also recommends a continuous monitoring of ground water quality of developing nation.
Acknowledgement
The author thanks The Maharaja Sayajirao University of Baroda, Vadodara for providing the necessary infrastructure to conduct present research investigation.
References
- Sukumaran D, Sengupta C, Saha R, Saxena RC (2015) Ground Water Quality Index of Howrah, the Heritage City of West Bengal, India. Appl Ecol Environ Sci 3(1): 5-10.
- Abd El Salam MM, Abu-Zuid GI (2015) Impact of landfill leach ate on the groundwater quality: A case study in Egypt. J Adv Res 6(4): 579586.
- Stigter TY, Ribeiro L, Carvalho Dill AMM (2006) Application of a groundwater quality index as an assessment and communication tool in agro-environmental policies. Two Portuguese case studies J Hydrol 327(3-4): 578-591.
- Vasanthavigar M (2010) Application of water quality index for groundwater quality assessment: Thirumanimuttar sub-basin, Tamilnadu, India. Environ Monit Assess 171(1-4): 595-609.
- Ghosh MK, Ghosh S, Tiwari R (2013) A Study of Water Quality Index Assessment of Ground Water and Pond Water in Sirsakala Village of Bhilai-3, Chhattisgarh, India. Int J Civil, Struct Environ Infrastructure Eng Res Dev 3(5): 63-74.
- Yisa J, Jimoh TO, Oyibo OM (2012) Underground Water Assessment using Water Quality Index. Leonardo J Sci 21: 33-42.
- Reza R, Singh G (2010) Assessment of Ground Water Quality Status by Using Water Quality Index Method in Orissa, India 9(12): 1392-1397.
- Saeedi M, Abessi O, Sharifi F, Meraji H (2010) Development of groundwater quality index. Environ Monit Assess 163(1-4): 327-335.
- Kaur BJ, George MP, Mishra S (2014) Groundwater Quality and Water Quality Index of Delhi City, India. 32(5): 865-871.
- Kumar KS, Prasad KH, Rajesh B, Prasad RS, Venkatesh T (2015) Assessment of Ground Water Quality Using Water Quality Index. Int J Innov Res Adv Eng 2(3): 103-108.
- Singh S, Hussian A (2016) Water quality index development for groundwater quality assessment of greater Noida sub-basin, Uttar Pradesh, India. Cogent Eng 3: 1-17.
- Khosravi R (2017) Use of geographic information system and water quality index to assess groundwater quality for drinking purpose in Birjand city, Iran. Desalin Water Treat 67: 74-83.
- PR Gupte (2005) Vadodara District Hydrogeology Report.
- APHA (2012) Standard Methods for Examination of Water and Wastewater. American Public Health Association, Washington, USA.
- BIS (2012) Indian Standard Drinking Water Specification. Bur Indian Stand IS 10500: 1-11.
- Srinivasa moorthy K (2008) Identification of major sources controlling groundwater chemistry from a hard rock terrain. A case study from Mettur taluk, Salem district, Tamil Nadu, India. J Earth Syst Sci 117: 49.
- Ramakrishnaiah CR, Sadashivaiah C, Ranganna G (2009) Assessment of Water Quality Index for the Groundwater in Tumkur Taluk, Karnataka State, India. E-Journal Chem 6(2): 523-530.
- Villanueva CM, Fernandez F, Malats N, Grimalt JO, Kogevinas M (2003) Meta-analysis of studies on individual consumption of chlorinated drinking water and bladder cancer. J Epidemiol Community Heal 57(3): 166-173.
- Agrahari M, Kushwaha VB (2012) Effect of Domestic Sewage on the Physico-Chemical Quality of River Rapti at Gorakhpur 7: 135-138.
- Das R, Samal N, Roy P, Mitra D (2006) Role of electrical conductivity as an indicator of pollution in shallow lakes. Asian Journal of Water, Environment and Pollution 3(1): 143-146.
- Deshkar S, Khyati M, Deepa G (2014) Spatial difference in pollution levels across Vishwamitri River. Int J Environ Biol 4(1): 51-56.
- Qualls RG, Richardson CJ (2003) Factors controlling concentration, export, and decomposition of dissolved organic nutrients in the Everglades of Florida. Biogeochemistry 62(2): 197-229.
- Duff JH (2009) Phosphorus and nitrogen legacy in a restoration wetland, Upper Klamath Lake, Oregon. Wetlands 29: 735.
- Sharma ND, Patel JN (2010) Evaluation of Groundwater Quality Index of the Urban Segments of Surat City, India. Int J Geol 4(1): 1-4.
- Shah SM, Mistry NJ (2013) Groundwater Quality Assessment for Irrigation Use in Vadodara District, Gujarat, India. Int J Agric Biosyst Eng 7: 719-724.
- Alka P, Harshita G, Nazish K Jitendra D (2015) Study of Ground Water In Vadodara District, Gujarat, India. J Environ Res Dev 9: 773-778.
- Suman A, HM, P Indra P, Ajay P (2016) Ground Water Quality Assessment of Vadodara District, Gujarat, India. Using GIS J Groundw Res 5(1): 13-23.
- Sharma MK, Jain CK, Rao GT, Rao VVSG (2015) Modeling of lindane transport in groundwater of metropolitan city Vadodara, Gujarat, India. Environ Monit Assess 187: 295.
- Ajinkya D, Dhruvi P, Drashti P, Jalpa J, Khushali D (2015) Change in the Land Use Pattern and Water Bodies of Vadodara City , India With Respect To Recurring. J Environ Res Dev 10(1): 175-186.


