


The Effects of Climate Change and Rivers Damming in the Mediterranean Sea during the Twentieth Century
MC Garcia Martinez1, 3*, M Vargas Yanez1, F Moya1, P Zunino2 and B Bautista3
1Instituto Espanol de Oceanografia, Centro Oceanografico de Malaga, Spain
2Univ Brest, Laboratoire d'Oceanographie Physique et Spatiale (LOPS), France
3Universidad de Malaga Departamento de Ecologia, Facultad de Ciencias, Spain
Submission: January 02, 2018; Published: February 02, 2018
*Corresponding author: MC Garcia Martinez, Instituto Espanol de Oceanograffa, Centro Oceanografico de Malaga Puerto pesquero de Fuengirola 29640, Fuengirola (Malaga), Spain, Email: mcarmen.garcia@ma.ieo.es
How to cite this article: MM Garcia Martinez, M Vargas Yanez, F Moya, P Zunino, B Bautista. The Effects of Climate Change and Rivers Damming in the Mediterranean Sea during the Twentieth Century. 2018; 8(4): 555741. DOI: 10.19080/IJESNR.2018.08.555741
Abstract
The Mediterranean Sea transforms Atlantic Waters inflowing through the Strait of Gibraltar into saltier, cooler and denser Mediterranean Waters that outflow into the Atlantic Ocean. A theoretical steady state functioning of the Mediterranean Sea would be the result of the balance between the net heat and volume transports through the Strait of Gibraltar and the heat loss to the atmosphere through the sea surface and the net evaporation. The salt transport for the inflow and outflow should be balanced. Changes in the heat content, temperature and salinity of the Mediterranean waters reveal that the present Mediterranean functioning is out of this equilibrium state. A new analysis for MEDAR data shows that the temperature and salinity averaged for the Mediterranean Waters in the whole basin increased at rates of 0.1 oC/100 yr and 0.02 psu/100 yr during the twentieth century. This temperature trend is equivalent to 0.14 W/m2 heat absorption.
The analysis of RADMED monitoring program in the Spanish Mediterranean and the EN4 data set from the Met Office Hadley Center show that this warming and salting would have increased during the beginning of the twenty first century at the Western and Eastern Mediterranean (0.2 oC/100 yr, 0.09 psu/100 yr), maybe linked to the Western and Eastern Mediterranean Transients. Results from a simple box model using heat, volume and salt conservation laws indicate that the observed changes during the twentieth century cannot be attributed only to an increase of the net evaporation, nor to a salinity increase of the Atlantic Waters flowing through the Strait of Gibraltar as previous hypotheses suggested. A 3.5% increase in the net evaporation combined with a 0.4W/m2 reduction of the heat losses to the atmosphere could explain the observed changes.
Introduction

Because of its reduced dimensions, if compared with the world oceans, and because of its own thermohaline circulation, the Mediterranean Sea has been considered as a natural laboratory for climate change studies [1]. Since the mid 1980s, many works have reported changes in the temperature and salinity of its water masses [2]. These changes have been clearly observed in the deep layers of both the Western and Eastern basins (WMED, EMED, Figure 1) which have increased their temperature and salinity along the second half of the twentieth century [1,3-7]. The origin of the observed trends could be linked to the global warming process [5]. Nevertheless, the Mediterranean Sea is also influenced by other anthropogenic stressors which can also alter the thermohaline properties of the Mediterranean waters, enhancing or masking the effects of climate change.
A clear example of such alterations occurred during the mid twentieth century with the damming of some of the main rivers draining into the Eastern (Nilo) and Western (Ebro) Mediterranean. The consequence of the river damming would have been an increase in the freshwater deficit of the Mediterranean Sea. During the 1990s and beginning of the twenty first century several hypotheses were proposed to explain the deep water warming and salting. The first one considers that these changes are caused by the global warming and the consequent reduction in the heat losses from the Mediterranean to the atmosphere [5]. Another hypothesis considers that the deep water warming is the result of the damming of the river Nilo and of those rivers draining into the Black Sea during the 1950s and 1960s. The result of this reduction in the fresh water inputs to the Mediterranean Sea would be an increase of the surface salinity. As surface waters in the Eastern Mediterranean take part in Levantine Intermediate Water (LIW) formation, this water mass would have also increased its salinity.
Saltier waters would reach the deep water density with a temperature higher than the one previous to the damming of these rivers [7]. According to Krahmann and Schott [6], the warming of the Western Mediterranean Deep Waters (WMDW) has been caused by the increase of the salinity of surface waters, but the origin of such a salinity increase would be the damming of river Ebro in the Western Mediterranean and a rainfall reduction associated to a positive phase of the NAO index from mid 1960s to mid 1990s. Finally, Millot [8] also considers that the factor that triggers the warming of the deep waters in the Western Mediterranean is the surface layer salinity increase. Nevertheless, Millot [8] hypothesizes that the cause for the Mediterranean surface salting is the increment of the salinity of the Atlantic Water (AW) flowing into the Mediterranean Sea through the Strait of Gibraltar. Discerning the accuracy of the different hypotheses is a difficult task. Many works appeared since the mid 1980s deal with the changes observed in the properties of the Mediterranean water masses.
Nevertheless the results presented are in some cases contradictory and different works support different hypotheses. Summarizing the main findings: both temperature and salinity of WMDW have increased along the twentieth century [1,4-9] Some works have found positive trends for the salinity of the LIW [1,4,7]. Other works consider that the LIW salinity has not changed along the twentieth century [10]. Some studies have reported positive temperature trends for the LIW [1,11]whereas others consider that the temperature of this water mass only exhibits decadal variability or even decreasing trends [4,6,10] Concerning AW, Krahmann and Schott [6], Sparnocchia et al. [11] found no changes in its temperature.
On the contrary, Salat and Pascual [12], Skliris et al. [13] reported the warming of this water mass from the mid 1970s. Finally, Krahmann and Schott [6] reported positive salinity trends for the AW while Sparnocchia et al. [11] found no changes for the salinity of this water mass. More recent works have evidenced by means of satellite infrared data the warming of the surface layer, both in the Western and Eastern Mediterranean (WMED and EMED) from the mid 1980s to the first decade of the twenty first century [13-15] and Von Schuckmann et al. [16] have estimated positive trends for the surface temperature of the Mediterranean Sea from 1993 to 2015. Table 1 summarizes the main trends for temperature, salinity and density along the twentieth century, indicating the geographical area, the depth level and the time period for each calculation (confidence intervals are included when available in the original work). This table is updated and completed from the one in Vargas-Yanez et al. [9]. In order to understand the discrepancies outlined above, it has to be considered that monitoring programs in the Mediterranean Sea have been launched mainly during the 1990s and the beginning of the twenty first century (for instance, Hydro changes network, Schroeder et al. [17], MEDARGO program; Poulain et al. [18], RADMED; Lopez-Jurado et al. [19]; Tel et al. [20].

New platforms and data bases have been developed for the compilation of high quality data and products Von Schuckmann et al. [16] SEADATANET, the Met Office Hadley Center Data Sets; Good et al. [21] or the World Ocean Data Base; Boyer et al. [22]. On the contrary, the works outlined above are based on data obtained from different cruises without a common objective or methodology. As a result of the lack of monitoring programs during the last century, oceanographic data are scarce and unevenly distributed. According to Llasses et al. [23], Jorda and Gomis [24], Beuvier et al. [25], data available for the second half of the twentieth century could not be appropriate for the description of the climatic variability of the different depth levels and regions in the Mediterranean Sea. Vargas-Yanez et al. [3,9] have suggested that the data scarcity would make trend estimations in the Mediterranean Sea very sensitive to small changes in the data processing methods.
The present work has a threefold objective: First, Vargas- Yanez et al. [9] have shown that the data processing of time series affects the estimation of temperature and salinity trends in the Mediterranean Sea. Vargas-Yanez et al. [3] analyze the effect of using in situ data versus 3D temperature and salinity fields interpolated by Rixen et al. [26], and Vargas-Yanez et al. [9] checks the dependence of trend estimations on the use of bathythermograph data. The present work summarizes the different methodologies used in previous works. Temperature and salinity time series for the second half of the twentieth century in the Mediterranean Sea are analyzed considering all the different data processing methods used in previous works. In this way, time series include two kinds of errors. First ones are those associated to measurements and to the natural variability at short spatial and time scales, and the second one is the dispersion associated to the different data analysis methods. The first objective of the present work is to provide error estimations for the Mediterranean temperature and salinity time series and to check which trend estimations are not sensitive to the used methodology. Second, using heat, salt and volume conservation laws, a simple box model is developed for assessing the temperature and salinity evolution of the Mediterranean Waters (MW). Using this simple model it is attempted to establish the validity of the different hypotheses proposed for the explanation of the warming and salting of the MWs. Finally, although the main objective of the present work is to study the changes occurred along the twentieth century analyzing the role of different anthropogenic effects such as climate change and river damming, a third objective will be the extension of time series during the twenty first century (up to 2015).
Data and Methods
a. Data and Data Processing
The Mediterranean Sea was divided into eleven geographical areas (Figure 1), seven of them corresponding to the WMED and four more regions for the EMED. Temperature and salinity profiles from MEDAR data base were selected [27]. These data are quality controlled and those profiles labeled as low quality were discarded. Finally each profile was linearly interpolated into 23 pressure levels (0, 10, 20, 30, 50, 100, 150, 200, 300, 400, 500, 600, 700, 800, 900, 1000, 1200, 1400, 1500, 1750, 2000, 2250, 2500 dbar). The first step is the construction of annual temperature and salinity time series for the WMED and EMED. As already explained in the introduction, the data are scarce and time series contain frequent gaps. The data availability decreases considerably with depth (Figures S1 & S2 in supplementary material show the number of available data for the WMED and EMED at some selected pressure levels). Therefore the first difficulty is to handle these gaps
In order to check the influence of possible biases already reported in Bathythermograph data [28-31], two different data sets were constructed. The first one included all the profiles from oceanographic bottles, CTDs and expendable bathythermographs (XBTs) from 1945 to 2000. Hereafter this data set will be referred to as "With". Another data set was constructed using only data from oceanographic bottles and CTDs ("Without" hereafter).The following step was to construct annual time series. Data were grouped and averaged by season of the year: Winter (JFM), spring (AMJ), summer (JAS) and autumn (OND). The existing gaps were filled following the two approaches proposed by Gregory et al. [32]. The first approach is named as "representative anomalies". All data corresponding to the same season of the year and for each pressure level were averaged in order to obtain a climatological value. Climatological values were subtracted to obtain time series of anomalies or deviations respect to the climatological value.
The anomalies corresponding to the same year were averaged obtaining an annual value. The second approach was to fill the data gaps with the climatological values. This method is equivalent to consider that missing values correspond to years with zero anomalies or deviations. Therefore this procedure is named as "zero anomalies" [32]. An initial inspection of annual time series showed that filling gaps with climatological values produced flattened time series. For this reason, a third method was to estimate climatological values and linear trends from seasonal time series. Gaps were filled with the value predicted by the climatology plus the linear trend. Finally a more simple approach was followed. It simply consisted in averaging the seasonal values corresponding to each year without considering possible biases associated to the missing values. Notice that averaging seasonal data would produce an unrealistically high result if autumn or winter values were missing, while the annual mean would be lower than the real one if the missing values were those from summer or spring. Nevertheless if the probability of having a missing value does not depend on the season of the year, that is, the time series are not seasonally biased, this methodology would artificially increase the time series variance but would not alter the trend estimation (although it would reduce the statistical significance). On the other hand, if the time series were seasonally biased and this bias changed with time, it would produce erroneous trends. For instance, if cold seasons were more frequently sampled during the beginning of the time series, and the final part of the series was biased towards warm seasons, then an artificial positive trend would result. Chi-squared tests showed that the time series were not seasonally biased and there were no changes with time in the seasonal distribution of data gaps. This result stands for all the geographical areas in both the WMED and EMED. The above described methods provide four annual time series for temperature and salinity for each geographical area.
In addition a fifth time series was considered using the 3D interpolated fields by In this case the time series have no gaps. All time series were checked for suspicious or anomalous values. An initial review eliminated those data out of the range 12 oC- 28oC for potential temperature and 36psu-40psu for salinity. A second review eliminated those values more than 3 standard deviations from the climatologically mean. Times series from the seven regions within the WMED and from the four regions in the EMED were averaged in order to obtain temperature and salinity time series for the 23 pressure levels for the two basins of the Mediterranean Sea. The average was weighted by the volume of each basin and depth layer. When annual data from some region were missing, the two procedures already described (representative and zero anomalies) were used. For each annual salinity profile corresponding to both the WMED and EMED, it was determined the Atlantic-Mediterranean interface as the mid-point between the salinity minimum corresponding to the AW and the salinity maximum associated to the core of the LIW.
Temperature and salinity data above and below the interface were averaged for the determination of the Atlantic and Mediterranean Water temperature and salinity, Figure 2 shows the position of the Atlantic-Mediterranean interface and the properties of the waters above (AW) and below (MW) from the climatologically mean profiles. Time series constructed using all the different methodologies were obtained for the two data sets considered, that is, for time series "with" bathythermograph data, and for time series "without" such data. Figure S3 in supplementary material shows the large dispersion associated to the different methodologies for the MWs in the WMED and EMED. This can be considered as an estimation of the uncertainty linked to the MEDAR time series. Beside these estimations, standard deviations were calculated for temperature and salinity time series corresponding to each basin and each pressure level (Figure S4-S7 in suppl. material). Notice that in most of the cases the uncertainty associated to the data analysis methods is larger than the standard deviation which represents possible measurement errors and short time and spatial scale variability. Therefore the methodological uncertainty will be considered.

b.Data extension
It has already been explained that the main goal of this work is to determine the changes occurred in the Mediterranean Sea and their causes during the second half of the twentieth century when different anthropogenic factors affected to the Mediterranean Sea. Nevertheless, for the completeness of the present work, time series have been extended until 2015, assessing the changes occurred along the twenty first century. To accomplish the third objective (see introduction) for both the WMED and EMED, the EN4 data set from the Met Office Hadley Centre was used [16]. For the case of the WMED, data from the RADMED monitoring program were also used [20,30].
c.Trend Estimations
Temperature and salinity time series for the AW and MW in the WMED and EMED were considered as made of a linear trend representing possible long term changes and a higher frequency variability (inter-annual to decadal).
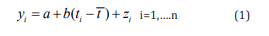
Where y. is the time series value corresponding to time t and z. is the inter-annual variability superimposed to the linear trend, n the number of data. Parameter a is the mean value and b is the slope which represents the average rate of change for the variable y. Parameters a and b were determined by means of least square fit. Confidence intervals for b can be estimated at the a significance level according to the expression [31-34]:
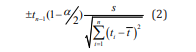
Where tn-1 is the 1-α/2 quantil for a t-student distribution with n-1 degrees of freedom.
The validity of the expression above depends on the normality and the statistical independence of the residuals or z.. The normality of the residuals was checked by means of Chi- squared and Smirnov-Kolmogorov tests [33]. Nevertheless, the residuals are far from being statistically independent due to the high inertia of temperature and salinity in the ocean. The approach followed in the present work was to use expression (2) substituting the degrees of freedom by the effective degrees of freedom [35,36]. The edf were estimated as:
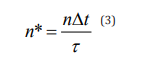
Being Δt the time step (one year in our case) and i the integral time scale which is defined as:
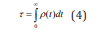
ρ (t) is the autocorrelation function for the residuals z. at lag t. In the practice the integral in (4) is calculated between zero and the first zero crossing of the autocorrelation function. Alternatively the intergral time scale can be estimated as the first maximum of the function [37].

No differences were obtained in the significance of the trends when using the first zero crossing or the expression proposed by Lenschow and Stankov [37].
d. Heat and salt conservation: a box model
Previous works have already used box-models for analyzing in a simple way the main features of the Mediterranean Sea [38] , the changes occurred during the twentieth century [1,39] and their effects on the MW flowing into the Atlantic Ocean [40]. Some of these models attempted to explain the main features of the MW and the water volumes exchanged through the Strait of Gibraltar. In some cases it was assumed that the Mediterranean Sea was in a steady state and the salt, volume and heat fluxes through the Strait of Gibraltar, sea surface and rivers were balanced [38]. In these early works, the Mediterranean outflow was considered proportional to the square root of the reduced gravity and therefore to the square root of the density difference between the Atlantic and Mediterranean waters.
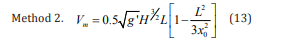
A first attempt to model the Mediterranean outflow considered potential and kinetic energy conservation laws and the Strait geometry [38,41] considered the use of the expression obtained by Whitehead et al. [42] including the effect of the Earth rotation. Lozier and Sindlinger [40] used a box model to study the evolution of the Mediterranean outflow salinity. In this case the volume of Mediterranean waters flowing through the Strait of Gibraltar followed the maximal exchange model by Bryden and Kinder [43], Figure 3 describes schematically the box model used in the present work. Atlantic waters flow into the Mediterranean Sea to compensate for the Mediterranean outflow and the net evaporation, which accounts for the difference between evaporation and precipitation, river runoff and net transport through the Bosphorus and Dardanelles.

The Mediterranean outflow was modeled following Lozier and Sindlinger [40] and Bryden and Kinder [43]. In this box model, EN denotes the net evaporation and Va, Vm de Atlantic and Mediterranean flows:
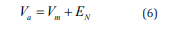
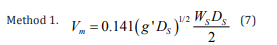
being DS the sill depth (284m)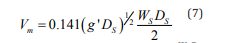 the cross sectional area at the sill (3.16 x 10⁶ m2)
 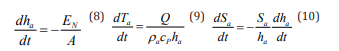 the reduced gravity. After one year, the thickness, temperature and salinity of the Atlantic layer is changed by the effect of heat fluxes through the sea surface (Q) and net evaporation:
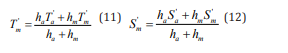
The AW becomes cooler and saltier by the effect of surface fluxes, sinks and mixes with the Mediterranean waters which would alter its temperature, salinity and density according to expressions:
Being Ta , Sa , Tm , Sm the temperature and salinity of Atlantic and Mediterranean waters after being modified by surface fluxes and mixing.
e. Initialization of the Model and Meteorological Forcing
Initially the Mediterranean Sea was filled with AW. Temperature and salinity profiles from the MEDAR data base were selected from a box located west of the Strait of Gibraltar (Figure 1). Considering the sill depth, temperature and salinity data for the upper 300m were averaged to obtain the temperature and salinity of the inflowing AW. The resulting values were 16.4 ± 0.3 °C and 36.3 ± 0.1 psu. A large range of values can be found in the literature for both the net evaporation and the net heat loss in the Mediterranean Sea. An extensive review of the existing literature revealed that estimations for heat fluxes can differ from -7 W/m2 (loss to the atmosphere) to a net gain of 1 W/m2 [44,45] for some of these values). Precipitation, evaporation and river runoff estimations also change in a wide range: 825 to 1335 km3/yr for precipitation, 2320 to 5194 km3/yr for evaporation and 230 to 900 km3/yr for river runoff [46-48].
Different values have also been obtained for the net volume transport through the Dardanelles Strait. These values range from 200 to 300 km3/yr [24,48,49]. Therefore, considering the lower and upper limits of all these estimations, the net evaporation could be between 1065 and 2659km3/yr, which is equivalent to 0.43 m/yr to 1.06 m/yr. Because of the large uncertainty in the freshwater and heat fluxes, the following approach was adopted. Q and EN in the model were considered as adjusted parameters. The time evolution of the MW properties should reproduce those observed in the MEDAR data base. As explained previously, a mean temperature and salinity profile was obtained for the Mediterranean Sea. Considering waters below the interface, the mean temperature and salinity values for the MW were determined as 13.45 ± 0.03 oC and 38.63±0.01 psu respectively.
The Q and EN values in the box model were adjusted in such a way that this simple model was able to reproduce the observed Mediterranean properties. In order to accept the validity of this adjustment, the heat flux and net evaporation obtained in this way should relay within the already observed ranges.
f. Sensitivity test
To check the dependence of our results on the method used to estimate the volumes of water exchanged through the Strait of Gibraltar, three different approaches were followed. The first one, already commented, was to assume the maximal exchange model proposed by Bryden and Kinder [10] already used in the box model by Lozier and Sindlinger [32]. The second one was to use the expression proposed by considering the geometry of the Strait and the effect of the Earth rotation. The third one was simply to consider that the Mediterranean outflow was proportional to the density difference. The three methods are summarized in the following expressions:
In the case of method 3, the heat flux, net evaporation and k coefficient were adjusted parameters. Those values reproducing the observed Mediterranean temperature and salinity were considered as the right ones.
Results
a. Temperature, Salinity and Heat Content Time Series


The climatological profiles in Figure 2 showed an interface at 109 ± 6 dbar with a salinity of 38.05 ± 0.03 psu in the WMED. The average potential temperature and salinity for the AW within the WMED were 15.41 ± 0.29 °C, 37.81 ± 0.03 psu, while the values corresponding to the MW were 12.98 ± 0.02 °C, 38.45 ± 0.01 psu. In the EMED, the interface was located at 49 ± 10 dbar with a salinity value of 38.68 ± 0.03 psu. Potential temperature and salinity mean values for the AW above the interface were 18.83 ± 0.63 °C, 38.58 ± 0.02 psu, and values corresponding to the MW below the interface were 13.87 ± 0.04 °C, 38.75 ± 0.01 psu. When the whole Mediterranean basin was considered, the MW mean temperature and salinity were 13.45 ± 0.03 oC and 38.63 ± 0.01 psu. (Figures 4-6) show the evolution of the temperature, heat content and salinity for the MW for the WMED, EME and MED. Red line is the mean value from all the time series obtained using the different methodologies explained in section 2.1. The upper and lower curves are the maximum and minimum values. The grey area represents the uncertainty associated to methodological factors. All time series (maximum, minimum and mean values) have been smoothed with a five- year moving average. Table 2 summarizes the observed trends for the potential temperature and salinity of the Atlantic and Mediterranean waters in the WMED, EMED and for the whole Mediterranean Sea (Table 3 shows the heat content trends for the WMED, EMED and MED). No significant differences were found between the data sets "with" and "without" bathythermograph data. Therefore the two tables presented correspond to the with bathythermograph data set. A first result arising from Figures 4-6 is the large uncertainty associated to the data analysis method. Depending on the method used for filling gaps in time series, the method used for filling spatial gaps when averaging the different regions of the Mediterranean Sea, or the use of interpolated temperature and salinity fields, the resulting time series can differ substantially. Linear trends were estimated for all the time series and the only factor which influence could be neglected is the inclusion or exclusion of bathythermograph data. If the mean time series were considered (red line in Figures 4-6) the temperature and salinity of the MW in the WMED would have increased along the twentieth century at rates of 0.1 ± 0.03 oC/100 yr and 0.03 + 0.01 psu/100 yr. The temperature increment for the WMED was produced by an increase of the heat content of the MW of 0.19 + 0.06 W/m2. Notice that trends are initially in J/yr. Years are converted into seconds and the resulting trends divided by the surface of the basin. The AW in the WMED also increased its temperature if the mean time series is considered. The estimated trend is 0.79 + 0.34 oC/100yr. This result is statistically significant, nevertheless if each individual time series obtained using the different methodologies were considered, the estimated trends would be in a wide range from negative to positive values. This fact simply reflects the higher variability of the upper layers of the ocean. The linear trend for the mean AW salinity is not statistically significant. Notice that if the lower limit is considered, this trend would even be negative.
Results for the MW in the EMED are similar to those of the WMED with linear trends of 0.1 + 0.05 oC/100 yr and 0.02 + 0.02 psu/100 yr for the mean temperature and salinity time series. The heat content of the MW increased at a rate of 0.17 + 0.11 W/m2. The temperature of the AW decreased (Figure 5 & Table 2) and the salinity changes were not significant.When the whole Mediterranean Sea (MED) is considered (Figure 6) the AW temperature decreased as a result of the larger volume of the EMED, while no trends were detected for the salinity. The MW reflected the warming of both basins with a temperature trend of 0.1 + 0.04 oC/100 yr and a heat content trend of 0.14 + 0.08 W/m2.The RADMED program is devoted to the monitoring of Mediterranean Spanish waters, including the Balearic Islands. The sampling strategy includes deep oceanographic stations with the aim of monitoring LIW and WMDW. The RADMED oceanographic stations are within the boxes labeled in Figure 1 as Alboran Sea, Cape Palos, Balearic Sea and Gulf of Lions [30]. Time series generated by this monitoring program since 1992 were merged with MEDAR data from the corresponding boxes. This allows us to extend the results already presented until 2015, but at the same time it can be checked the capability of this monitoring program for detecting changes affecting to the WMED. Figure 7 shows the Mediterranean water temperature and salinity (waters below the salinity interface) for the RADMED area. The temperature trend for the period 19452000 is 0.18 + 0.07 oC/100 yr, slightly higher than the maximum trend estimated from the MEDAR data for the whole WMED. The time variability of both time series is similar with a significant correlation coefficient of 0.6. The salinity trend for the period 1945-2000 is 0.06 psu/100 yr, but in this case it is not statistically significant at the 95% confidence level (it is significant at the 90% confidence level).


The correlation between RADMED/MEDAR and MEDAR time series is 0.75. If the complete period 1945-2015 is considered the temperature and salinity trends are 0.20 + 0.04 oC/100 yr and 0.08 + 0.01 psu/100 yr, reflecting an acceleration of warming and salting trends during the twenty first century. Trends for the period 1945-2015 and for the AW were 0.53 + 0.30 oC/100 yr and 0.06 + 0.04 psu/100 yr. For comparison with more recent data products, the EN4 objective analyses were used [21] When considering the WMED, linear trends for the temperature and salinity of the Mediterranean waters from 1945 to 2015 are very close to those obtained using RADMED data: 0.20 + 0.04 oC/100 yr and 0.09 + 0.01 psu/100 yr. The temperature and salinity of the AW increased at rates of 1.3 + 0.3 oC/100 yr and 0.03 + 0.04 psu/100 yr. While the temperature trend is double than the one obtained using RADMED data, the salinity trend is lower and not statistically significant (see Figure S8 and Table S3 in supplementary material). Results for the EMED and for the whole Mediterranean Sea using the EN4 data set are similar to those shown for the WMED (Figures S4-S8, Table 3). These results confirm the intensification of the Mediterranean Sea warming during the twenty first century [50].

b. Box model
Using the maximal exchange parameterization for the Mediterranean outflow (see section 2.4), the box model was run for a period of 1000 years. The MW properties were stabilized at 13.45 oC and 38.63 psu after 200 years, coinciding with the values estimated from MEDAR data (Figure 8A). This equilibrium state was reached when the heat flux from the Mediterranean Sea to the atmosphere was fixed at 5.95 W/m2 and the net evaporation was considered as 2340 km3/yr, or equivalently 0.94 m/yr. The volume transport for the AW inflow and the MW outflow were 1.23 and 1.16 Sv. All these values are within the limits found in the literature (section 2.5).The model is not sensitive to the MW outflow parameterization. Using the Whitehead et al. [42] parameterization, the model stabilized after 200 years with MW temperature and salinity values of 13.44 oC and 38.63 psu, being the inflow and outflow 1.1 and 1.03 Sv respectively.
The heat flux and net evaporation in this case were 5.33 W/m2 and 2095 km3/yr, once again within the usually accepted limits. Similar results were obtained using the third parameterization for the Mediterranean outflow. Once accepted the validity of the box model for reproducing the main characteristics of the MW and the heat, salt and volume balance in the Mediterranean Sea, the mechanisms responsible for the MW warming and salting were investigated. Two of the hypotheses explained in the introduction consider that the MW warming is caused by the salinity increase of the surface layers. In one case the triggering factor would be the damming of river Nile and of those rivers draining into the Black Sea. In the other case it would be caused by the damming of river Ebro in the WMED. After analyzing different works found in the literature, it was estimated that the Nilo damming reduced its water runoff in75km3/yr.


The same analysis for the Ebro damming resulted in a reduction of 25km3/yr. These quantities represent a 3.5 % and 1.2 % of the net evaporation in the Mediterranean Sea (see Tables 41 & 5 in supplementary material). Therefore, after a 1000yr run, the net evaporation in the box model was increased in 3.5 %, keeping constant the heat flux to the atmosphere (5.95W/m2). Figure 8A shows the corresponding temperature and salinity increase for the MW, Figure 8B is a zoom for the first 300 yr after the net evaporation increment (Nilo damming). A straight line was adjusted to the first 50 yr after the net evaporation increment for the simulation of the observations during the second half of the twentieth century. The temperature and salinity trends were 0.01 °C/100 yr and 0.06 psu/100 yr. The salinity trend would be slightly higher than the maximum values reported in Table 2.

The temperature trend would be much lower than the mean and maximum trends (0.10 and 0.12 °C/100 yr) and even lower than the minimum one (0.04 oC/100 yr, Table 2). If only the river Ebro reduction was considered (1.2 % of the net evaporation), the MW salinity trends obtained from the box model were comparable to those observed from MEDAR data, but the temperature trends were much lower. In a final experiment both the Nilo and Ebro damming were considered and a 4.7 % increment was imposed for the net evaporation. In this case the salinity trend produced by the box model was 0.078 psu/100 yr, higher than the observed ones, while the temperature trend was 0.014 oC/100 yr, lower than the minimum observed trend. Following Bethoux et al. [51], it was considered that the changes in the Mediterranean Sea were forced by the Nilo damming and a reduction in the heat loss to the atmosphere caused by climate change.
A new box model experiment considered that, after stabilization, the net evaporation was increased in 3.5 % and the heat flux from the sea to the atmosphere was reduced in 0.4 W/m2. In this case the temperature and salinity trends for the MW were higher although comparable to the maximum ones observed for the Mediterranean Sea: 0.16 oC/100 yr and 0.06 psu/100 yr (Figure 9). Finally it was considered the hypothesis proposed by Millot [35], that is, the warming and salting of the MW was caused by the salinity trends observed in the nearby Atlantic Ocean and imported into the Mediterranean Sea through the Strait of Gibraltar. According to Boyer et al. [52] and Reverdin et al. [53], Millot considers that the salinity of AW flowing into the Mediterranean Sea would have experienced a linear trend ranging between 0.1 and 0.4 psu/100 yr. Using the box model, it was imposed a 0.1psu/100 yr linear trend for the salinity of the AW after the stabilization of the model Table 6.


The MW showed a trend of 0.02psu/100yr during the first 50 years after the AW salinity trend was imposed, while the temperature showed no valuable changes. Then a 0.4psu/100yr trend was imposed for the inflowing AW. In this case the MW salinity increase occurred at a much higher rate than the observed ones (0.09psu/100 yr, see Figure 10), while once again the temperature showed no changes. In this case, the time evolution of the MW is far from being linear and the model trends increase with time (Figure 10B). MW trends were also calculated for a 50yr period beginning 75yr after the new AW forcing. The MW salinity trend was 0.24psu/100yr, an order of magnitude higher than the observed ones, and the temperature trend 0.04 oC/100 yr, close to the minimum observed trends.

Discussion and Conclusions
Most of the works analyzed in this study report warming and salting trends for the deep waters of the Mediterranean Sea (Table 1). These trends range between the 0.1 °C/100 yr reported by Lacombe et al. (1985) and the 0.4 oC/100 yr in Bethoux et al. [4]. On the contrary, different results are obtained for the temperature and salinity trends for the upper and intermediate layers, occupied by AW and LIW respectively, during the second half of the twentieth century. The discrepancy between the different results concerning AW and LIW seems to be associated to the high time and spatial variability of these water masses and the inappropriate sampling strategy during the last century. The lack of monitoring programs and the data scarcity made the results very sensitive to the data processing methods [29]. According to these authors, the monitoring programs existing during the twentieth century were not suitable for describing the time variability of the different layers and geographical regions of the Mediterranean Sea. Llasses et al. [29] consider that the existing data sets could only provide a description of the basin average properties. Rixen et al. [42] only describe the temperature and salinity evolution of the upper (0-150dbar), intermediate (150-600 dbar) and deep layers (600 dbar-bottom) of the WMED and EMED from a qualitative point of view. Rixen et al. [42] only provide quantitative results for the temperature and salinity averaged for the whole Mediterranean Sea. In this case the temperature trend obtained was 0.19 oC/100 yr Table 7.

The present work estimates annual temperature and salinity values for the different depth levels from the surface to 2500 dbar for the WMED and EMED and for the MED. Each annual value has been calculated with an estimation of its standard deviation which can be considered as representative of its associated error. Nevertheless, time series contain frequent gaps. Gaps in time series can be filled following different approaches: filling the gaps with climatological values, using climatological values and linear trends, averaging residuals or anomalies instead of temperature and salinity values, or using 3D interpolated products which contain no gaps. When averaging different regions, once again spatial gaps have to be taken into account and two approaches have been used: representative anomalies and zero anomalies [18]. Finally, the time series obtained for the WMED, EMED and MED present a large dispersion depending on the data analysis method used for the time series construction. As all the methodologies are based on previous works and sound science it cannot be established a priori which method should be considered. The dispersion associated to these methodological aspects is larger than the standard deviation of the annual temperature and salinity data and therefore it is considered as the uncertainty of the analyzed time series. In this way, the mean value estimated from all the temperature and salinity time series have been considered and the minimum and maximum values provide upper and lower limits which can be considered as the uncertainty of the annual time series (Figures 4-7). If the mean time series are considered, the upper layer of the WMED increased its temperature from 1945 to 2000 at a rate of 0.79 ± 0.34 oC/100 yr. considering the upper and lower limits of these time series (Table 2), this warming trend could reach 1.36 oC/100 yr. Nevertheless, if each of the time series generated using the different methodologies are considered, some of these time series show positive trends, while others show negative and significant trends. If the salinity of the AW in the WMED is considered, the lower limit of these time series shows a negative trend, while the mean time series and the upper limit show positive trends. Notice that the result for the mean time series (Table 2) is not statistically significant at the 95 % confidence level. Once again, if each individual time series is analyzed, positive and negative results are obtained. For the case of the AW in the EMED, the mean temperature and both the lower and upper limits show negative and significant trends (-1.25 ± 0.55 oC/100 yr for the mean temperature, Table 2). If each time series is checked, negative and positive results alternate. The mean salinity time series shows a non significant trend. These results could indicate that the AW temperature and salinity trends in both the WMED and EMED are not very robust results coinciding with the conclusion extracted from the review of the existing literature (Table 1). When temperature time series are considered in a fixed point with a constant methodology, as for instance, the l'Estartit oceanographic station in the Catalan continental shelf, very clear and robust results are obtained with a warming trend of 2.7 oC/100 yr (Table 1) [46]. Nevertheless it has to be taken into account that the period of time covered by Salat and Pascual [46] is 1974-2005, different from the one analyzed in the present work and summarized in (Table 2). Another objection to the direct comparison with results in Salat and Pacual [46] is the very local character of l'Estartit station. Recent works based on satellite data and the combination of satellite and in situ data show intense warming trends for the surface waters of the WMED and EMED [30, 36,52]. The upper 700 m of the world ocean seems to have absorbed most of the heat absorbed by the Earth because of the global warming process [54]. These results suggest that the upper layer of the Mediterranean Sea could have also suffered a warming process along the twentieth century. Nevertheless, satellite based works extend from the beginning of the 1980s. It cannot be established if the lack of significant positive trends in the MEDAR time series is the result of data scarcity and the absence of systematic and periodic measurements or it is simply a consequence of the different period of time covered by both data sets. If this second possibility was right, it would indicate an intensification of the warming trends during the end of the twentieth century and the beginning of the twenty first one. The salinity of the AW in both the WMED and EMED shows lack of significance for the mean time series. This result is coincident with the discrepancies outlined from the revision of previous works in Table 1. Unlike the upper layer, robust results are obtained when the MW is analyzed. The temperature and salinity trends for the MW were positive and significant in the WMED and EMED. Consequently, the behavior of the MW averaged for the whole Mediterranean Sea also showed positive trends (Tables 2-8). The heat absorbed by the MW during the second half of the twentieth century positive and negative trends depending on the methodology used. This is reflected in the negative trends obtained for the lower limit of MEDAR time series (Table 2), the positive trend for the upper limit and the increased at a rate ranging between 0.11 and 0.30 W/m2.
If each individual time series for each different data processing method is considered, most of them showed positive warming and salting trends, supporting the result that the MW increased its temperature and salinity along the last century. The temperature and salinity of the deep waters in the Mediterranean Sea are the result of deep convection during severe winter conditions. The water masses taking part in this formation process are the AW and the LIW. At the same time LIW is the result of intermediate winter convection acting over the AW in the EMED. Therefore it is difficult to reconcile the warming of the Mediterranean waters with the lack of robust warming trends in the AW. Some hypotheses have been proposed that could solve this problem. According to Rohling and Bryden [44], Krahmann and Schott [22] and Millot [35], the MW warming would be the result of the salinity increase of the AW. Saltier AW would reach the deep water density with temperatures higher than those ones previous to the AW salting. These authors differ in the origin of the AW salinity increase. Rohling and Bryden [44] attribute it to the damming of river Nilo and those rivers draining into the Black Sea. Krahmann and Schott associate it to the damming of river Ebro, while Millot [35] considers that the cause is the positive salinity trend of the AW inflowing through the Strait of Gibraltar. A simple box model has been used for trying to check the validity of these hypotheses. The box model used in this work is based on integral heat, salt and volume conservation laws and is similar to the conceptual model used by Bethoux et al [5] or the box model used by Bethoux et al. [1] or Lozier and Sindlinger [40]. The model is able to reproduce under steady state conditions the basin average temperature and salinity of the MW obtained from MEDAR observations in the present work (13.45 oC, 38.63 psu). This agreement is achieved when the net evaporation is fixed between 2010 and 2340km3/yr (0.8 to 0.94 m/yr) and the heat loss through the sea surface is between 5.12 and 5.95W/ m2. The uncertainty associated to the model net evaporation and heat loss comes from the different parameterizations used. Nevertheless, all these values are in agreement with those found in the literature [44]. The water volumes exchanged at the Strait of Gibraltar for this model steady state are between 1.06 and 1.23 Sv for the Atlantic inflow and between 0.99 and 1.16 Sv for the outflow, with a net inflow ranging from 0.06 to 0.07 Sv, once again in a reasonable agreement with observed values [55]. A review of the existing literature allowed us to establish that the river Ebro damming would be equivalent to a 1.2% increase in the Mediterranean net evaporation. According to the box model, this net evaporation increase would produce a salinity increment of the MW similar to those observed in MEDAR data, but the temperature trends would be much lower. If the net evaporation was increased in 3.5 %, equivalent to the river Nilo damming, the salinity trends predicted by the box model were 0.06 psu/100 yr, higher than the observed ones, but the temperature trend still remained lower than the observed ones. The same result was obtained when the net evaporation was increased in 4.7 %, considering both the damming of rivers Ebro and Nilo Figures 11-14.


If a linear trend was imposed for the salinity of the AW flowing into the Mediterranean Sea through the Strait of Gibraltar (0.1 psu/100 yr), the MW experienced a salinity trend of 0.02 psu/100 yr, similar to the observed one, but the temperature trend was practically negligible. Imposing a higher linear trend for the inflowing AW (0.4 psu/100 yr) produced a salinity trend for the MW higher than the observed one, but the temperature trend remained an order of magnitude lower than the MEDAR trends. A MW temperature trend lower, although comparable to the MEDAR ones was obtained if such trends were estimated 75 years later than the beginning of the inflowing AW salinity trends (Figure 10). The results of the box model show that the increment of the salinity of the AW can produce a warming of the MW, but lower than the observed one. The cause of this warming can be inferred from the heat and volume conservation laws and the density change induced by the salinity increase, Figure 8C shows the volume transport for the Atlantic inflow and the Mediterranean outflow in the Strait of Gibraltar (blue lines) and the associated heat transports (red lines), Figure 8D shows the net volume and heat transport. As the salinity of the deep water increases, its density also increases and so the Mediterranean outflow does. The Atlantic inflow also increases to compensate for the new outflow and net evaporation: V = Vm + En relevant for this discussion is that the net transport through Gibraltar must increase, that is, the increment for the inflow must be higher than the increment for the outflow. The net heat transport through the Strait of Gibraltar is PacVaTa -PmcVmTm . The Atlantic inflow temperature remains constant. Therefore, if the Mediterranean temperature did not change, the net heat transport through the Strait of Gibraltar would increase and would not be balanced by the sea surface heat loss, which has not been altered. This higher net heat transport would produce the warming of Mediterranean waters until a higher Tm produced a new equilibrium state. Beside this explanation for the warming of the MW associated to a higher net evaporation, it has been shown that this process is not able to reproduce the warming trends estimated from the observations. When both the net evaporation is increased in 3.5 % and the heat loss to the atmosphere is reduced from 5.95 W/m2 to 5.55 W/m2, the linear trends reproduced by the box model for the first 50 years after the change are 0.16 °C/yr and 0.06 psu/ 100 yr. These values are higher but comparable to the observed ones. Notice that the reduction in heat loss to the atmosphere is also close to the 0.3 W/m2 observed for the heat absorbed by the MW and is similar to that reported by Levitus et al. [27] for the heat absorbed by the upper 700 m of the world oceans. These results suggest that the warming of the MW is the result of an increment of the net evaporation and a reduction of the heat fluxes to the atmosphere. Data from RADMED monitoring program in the westernmost Mediterranean Sea and the EN4 data set [16] have been used for checking the possible acceleration of the warming and salting trends of the Mediterranean Waters during the beginning of the twenty first century. The RADMED program monitors in a periodic and systematic way the Spanish Mediterranean waters including deep oceanographic stations. Time variability in the RADMED region is similar to that observed for the whole WMED with a 0.6 correlation coefficient for the MW temperature from both time series and a 0.75 correlation coefficient for the salinity (Figures 7C & 7D). According to RADMED data, the temperature and salinity of the MW for the period 1945-2015 in the WMED increased at rates of 0.2 oC/100 yr and 0.08 psu/100 yr (Figure 7). RADMED data were merged with MEDAR ones and the uncertainty were estimated using the different methodologies already described. These trends are robust (do not depend on the methodology) and they are mainly forced by a dramatic salinity and temperature increase of the deep waters of the WMED which could be linked to the Western Mediterranean Transition [5660]. The AW also increased its temperature and salinity for the period 1945-2015 with trends of 0.53 ± 0.30 °C/100 yr and 0.06 ± 0.04 psu/100 yr. In this case these trends were not affected by the data analysis method and the large uncertainty associated to them. These results suggest on one hand that the inclusion of new and systematic observations favors the long term changes detection. On the other hand, it seems that the beginning of the twenty first century is characterized by an acceleration of the warming and salting trends. For the estimation of trends in both the WMED and EMED the EN4 objective analysis has been used. Figure S8 shows the MW temperature and salinity for both basins from 1945 to 2015. The corresponding uncertainty intervals from MEDAR time series for the period 1945-2000 are also included for comparison. Table TS3 in supplementary material shows the trends for the AW and MW for the WMED, EMED and the MED Figures 15 & 16.


Both basins and the whole Mediterranean Sea have increased their temperature and salinity with larger trends than those previously reported for the second half of the twentieth century. In the case of the WMED the temperature trend for the AW is clearly higher than that estimated from RADMED/MEDAR data. The AW salinity and the temperature and salinity for the MW exhibit trends very similar to those obtained from RADMED data, supporting the previous conclusions. That is, the warming and salting of the Mediterranean Sea seems to have been accelerated. The EMED and the whole Mediterranean have a very similar behavior to the one already described for the WMED. In this case the acceleration of temperature and salinity trends for the last decade of the twentieth century and the beginning of the twenty first one could be linked to the spreading phase of the Eastern Mediterranean Transient [39]. In summary, the analysis of temperature and salinity time series during the twentieth century shows the warming and salting of the Mediterranean Waters. This result is robust and not affected by the large uncertainty of these time series. The main source of the uncertainty is the data scarcity and the different data analysis methods used to fill time and space gaps and to construct time series. On the contrary, the possible existence of positive temperature and salinity trends in the AW within the Mediterranean Sea is not such a robust result. Some hypotheses have suggested that the origin of the MW warming is the salinity increase of the AW. A box model considering heat, salt and volume conservation laws shows that the increment of the freshwater deficit in the Mediterranean Sea or the increase of the salinity of the AW flowing into the Mediterranean Sea through Gibraltar could produce a certain warming and salting of the MW. Nevertheless these changes cannot explain the observed temperature trends. The temperature and salinity trends observed during the second half of the twentieth century can be explained by a combination of the increase of the freshwater deficit in the Mediterranean Sea and a decrease of the heat losses to the atmosphere. Finally, RADMED monitoring program in the Spanish Mediterranean and the EN4 objective analysis show that the temperature and salinity trends have increased during the beginning of the twenty first century Table 8. Temperature trends estimated for the extended period 1945-2015 for the AW are between 0.53 oC/100yr and 1.3 oC/100 yr and those for salinity are between 0.03 and 0.06 psu/100 yr depending on whether the RADMED or EN4 data sets are used. The MW increased their temperature and salinity at rates around 0.2 oC/100 yr and 0.09 psu/100yr. New platforms for the compilation of oceanographic data and new monitoring programs are invaluable tools for assessing future changes in the Mediterranean Sea thermohaline properties Figures 17 & 18.

References
- Bethoux, JP, B Gentili, P Morin, E Nicolas (1999) The Mediterranean Sea: a miniature ocean for climatic and environmental studies and a key for the climate functioning of the North Atlantic Prog Oceanogr 44: 131-146.
- Lacombe H, JC Gascard, J Gonella, JP Bethoux (1981) Response of the Mediterranean to the water and energy fluxes across its surface, on seasonal and inter annual scales Oceanologica Acta 4 : 1-12.
- M Vargas Yanez, E Mallard, M Rixen, P Zunino, Mc Garcia Martinez (2012) The effect of interpolation methods in temperature and salinity trends in the Western Mediterranean. Medit Mar Sci 13(1): 118-125.
- Rixen M, JM Beckers, S Levitus, J Antonov, T Boyer (2005) The Western Mediterranean Deep Water: a proxy for climate change. Geophys Res Lett p. 1-32.
- Bethoux JP, B Gentili, J Raunet, D Taillez (1990) Warming trend in the Western Mediterranean deep water. Nature 347: 660-662.
- Krahmann G, F Schott (1998) Long term increases in Western Mediterranean salinities and temperatures: anthropogenic and climatic sources. Geophys Res Lett 25(22): 4209-4212.
- Rohling EJ, HL Bryden (1992) Man-induced salinity and temperature increase in Western Mediterranean Deep Water. J Geophys Res 97(C7): 11191-11198.
- Millot C (2007) Interannual salinification of the Mediterranean inflow Geophys Res Lett: 34.
- Vargas Yanez M, P Zunino, A Benali, M Delpy, F Pastre (2010) How much is the Western Mediterranean really warming and salting? J Geophys Res: 115.
- Painter SC, MN Tsimplis (2003) Temperature and salinity trends in the upper waters of the Mediterranean Sea as determined from MEDATLAS data set. Cont Shelf Res 23: 1507-1522.
- Sparnocchia S, GMR Manzella, Paul E La Violette (1994) The interanual and seasonal variability of the MAW and LIW core properties in the Western Mediterranean Sea. In Seasonal and Interannual variability of the Western Mediterranean. Coastal and Estuarine Studies. PE La Violette (Ed.) American Geophysical Union, Washington, USA.
- Salat J, J Pascual (2006) Principales tendencias climatologicas en el Mediterraneo Noroccidental a partir de mas de 30 anos de observaciones oceanograficas en la costa catalana. En Clima, Sociedad y Medio Ambiente JM Cuadrat Prats, MA Sanchez, SM Vicente Serrano, S Lanjeri, N De Luis Arrillaga, JC Gonzalez Hidalgo Publicaciones de la Asociacion Espanola de Climatologi'a (AEC), serie A: 284-290.
- Nikolaos Skliris, Sarantis Sofianos, Athanasios Gkanasos, Anneta Mantziafou, Vasilis Vervatis (2012) Decadal scale variability of sea surface temperature in the Mediterranean Sea in relation to atmospheric variability. Ocean Dynamics 62(1): 13-30.
- Lopez Garcia MJ (2015) Recent warming in the Balearic Sea and Spanish Mediterranean coast. Towards an earlier and longer summer. Atmosfera 28(3): 149-160.
- Nykjae L (2009) Mediterranean Sea surface warming 1985-2006. Climate Research 39: 11-17.
- Von Schuckmann K, PY Le Traon, E Alvarez Fanjul, L Axell, M Balmaseda, et al. (2016) The Copernicus Marine Environment Monitoring Service Ocean State Report. Journal of Operational Oceanography 9: s235-s320.
- K Schroeder, C Millot, L Bengara, S Ben Ismail, M Bensi, et al. (2013) Long-term monitoring program of the hydrological variability in the Mediterranean Sea: a first overview of the Hydro changes network. Ocean Sci 9: 301-324.
- Poulain PM, R Barbanti, J Font, A Cruzado, C Millot, et al. (2007) Med Argo: A drifting profiler program in the Mediterranean Sea. Ocean Sci 3: 379-395.
- JL Lopez Jurado, R Balbin1, F Alemany, B Amengual, A Aparicio Gonzalez, et al. (2015) The RADMED monitoring programme as a tool for MSFD implementation: towards an ecosystem-based approach. Ocean Science 11: 897-908.
- Elena Tel, Rosa Balbin, Jose Manue Cabanas, Maria Jesus Garcia, M Carmen Garcia Martinez , (2016) IEOOS: The Spanish Institute of Oceanography Observing System. Ocean Sci 12: 345-353.
- Simon A Good, M J Martin, N A Rayner (2013) EN4: quality controlled ocean temperature and salinity profiles and monthly objective analyses with uncertainty estimates. Journal of Geophysical Research Oceans 118: 6704-6716.
- Boyer TP, JI Antonov O, K Baranova, C Coleman, HE Garcia, et al. (2013) World Ocean Database 2013, NOAA Atlas NESDIS 72, S Levitus, Ed, A Mishonov, Technical Ed Silver Spring MD pp. 1-209.
- Llasses J, G Jorda, D Gomis (2015) Skills of different hydrographic networks in capturing changes in the Mediterranean Sea at climate scales. Climate Research 63: 1-18.
- Jorda G, D Gomis (2013) Reliability of the steric and mass components of the Mediterranean Sea level as estimated from hydrographic gridded products. Geophys Res Lett 40: 3655-3660.
- Beuvier J, F Sevault, M Herrmann, H Kontoyiannis, W Ludwig, et al. (2010) Modeling the Mediterranean Sea inter annual variability during 1961-2000: Focus on the Eastern Mediterranean Transient. J Geophys Res: 115.
- Rixen M, JM Beckers, JM Brankart, P Brasseur (2000) A numerically efficient data analysis method with error map generation. Ocean modeling 2: 45-60.
- MEDAR Group 2002 - MEDATLAS 2002 database Mediterranean and Black Sea database of temperature, salinity and bio-chemical parameters. Climatological Atlas.
- Levitus S, JI Antonov, TP Boyer, RA Locarnini, HE Garcia, et al. (2009) Global ocean heat content 1955-2008 in light of recently revealed instrumentation problems. Geophys Res Lett: 36.
- Ishii M, M Kimoto (2009) Reevaluation of historical ocean heat content variations with time-varying XBT and MBT bias. J Oceanogr 65: 287299.
- Domingues CM, JA Church, NJ White, PJ Gleckler, SE Wijffels, et al. (2008) Improved estimates of upper-ocean warming and multi- decadal sea level rise. Nature 453: 1090-1093.
- Gouretski V, KP Koltermann (2007) How much is the ocean really warming? Geophys Res Lett 34.
- Gregory JM, HT Banks, PA Stott, JA Lowe, MD Palmer, et al. (2004) Simulated and observed decadal variability in ocean heat content. Geophys Res Lett: 31.
- Zar, J H (1984) Biostatistical Analysis, (2nd Edn). Englewood Cliffs, NJ Prentice-Hall, Inc, New Jersey, USA.
- Draper NR, H Smith (1981) Applied Regression Analysis (2nd Edn.) New York, USA.
- Emmery WJ, RE Thomson (1998) Data Analysis methods in Physical Oceanography. Elsevier, New York, USA.
- Chelton DB (1983) Effects of sampling errors in statistical estimations. Deep Sea Res Part A 30: 1083-1103.
- Lenschow DH, BB Stankov (1986) Length scales in the convective boundary layer. J Atmos Sci 43: 1198-1209.
- Bethoux J P (1979) Budgets of the Mediterranean Sea. Their dependence on the local climate and on the characteristics of the Atlantic waters. Oceanol Acta 2: 157-163.
- Bethoux J P, B Gentil (1996) The Mediterranean Sea, coastal and deep- sea signatures of climatic and environmental changes. J Mar Syst 7: 383-394.
- Lozier M S, Sindlinger L (2009) On the source of Mediterranean Overflow water property changes. Journal of Physical Oceanography: 39.
- Kullenberg B (1953) Les echanges d'eau a travers le Detroit de Gibraltar. B Inf Com Oceanogr Et cotes Paris: 298-302.
- Whitehead JA, A Leetma, RA Knox (1974) Rotating hydraulics of strait and sill flows. Geophys Fluid Dyn 6: 101-125.
- Bryden HL, TH Kinde (1991) Steady 2-layer exchange through the Strait of Gibraltar. Deep-Sea Res 38S: 445-463.
- Criado Aldeanueva F, FJ Soto Navarro, J Garcia Lafuente (2012) Seasonal and interannual variability of surface heat and freshwater fluxes in the Mediterranean Sea: budgets and exchange through the Strait of Gibraltar. Int J Climatol 32: 286-302.
- Ruiz S, D Gomis, Sotillo, MG, Josey SA (2008) Characterization of surface heat fluxes in the Mediterranean Sea from a 44-year high resolution atmospheric data set. Global and Planetary Change 63: 258-274.
- Ludwig W, E Dumont, M Meybeck, S Heussner (2009) River discharges of water and nutrients to the Mediterranean and Black Sea: Major drivers for ecosystem changes during past and future decades. Prog In Oceanogr 80: 199-217.
- Struglia MV, A Mariotti, A Filograsso (2004) River discharge into the Mediterranean Sea: Climatology and aspects of the observed variability. J Clim 17: 4740-4751.
- Boukthir M, B Barnier (2000) Seasonal and inter-annual variations in the surface freshwater flux in the Mediterranean Sea from the ECMWF re-analysis Project. J Mar Syst 24: 343-354.
- Tixeront J (1970) Le bilan hydrologique de la Mer Noire et de la Mer Mediterranee. Cah Oceanogr 22: 227-237.
- Ozsoy E, U Unluata (1997) Oceanography of the Black Sea: A review of some recent results. Earth-Science Reviews pp. 231-272.
- Bethoux JP, B Gentili, D Tailliez (1998) Warming and freshwater budget change in the Mediterranean since 1940s, their possible relation to the greenhouse effect. Geophys Res Lett 25(7): 1023-1026
- Boyer T P, S Levitus, J I Antonov, R A Locarnini, H E Garca, et al. (2005) Linear trends in salinity for the world ocean, 1955-1998. Geophys Res Lett p. 1-32.
- Reverdin G, E Kestenare, C Frankignoul, T Delcroix (2007) Surface salinity in the Atlantic Ocean (30° S-50° N). Prog In Oceanogr 73: 311340.
- Levitus S, JI Antonov, TP Boyer, OK Baranova, H E Garcia, et al. (2012) World ocean heat content and thermosteric sea level change (0-2000 m), 1955-2010. Geo phys Res Lett p. 1-39.
- Sanchez Roman A, Sannino, J Garcia Lafuente, A Carrillo, F Criado- Aldeanueva, et al. (2009) Transport estimates at the western section of the Strait of Gibraltar: A combined experimental and numerical modeling study. J Geophys Res: 114.
- K Schroeder, J Chiggiato, S A Josey, M Borghini, S Aracri, S (2017) Rapid response to climate change in a marginal sea. Scientific Reports 7: 4065.
- Schroeder K, J Chiggiato, HL Bryden, M Borghini, SB Ismail, et al. (2016) Abrupt climate shift in the Western Mediterranean Sea. Scientific Reports 6: 23009.
- Pinardi N, Marco Z, Mario Adani, G Coppini, Clauda F, et al. (2015) Mediterranean Sea large-scale low-frequency ocean variability and water mass formation rates from 1987 to 2007: A retrospective analysis. Prog Oceanogr.
- Zunino P, K Schroeder, M Vargas Yanez, G P Gasparini, L Coppola, et al. (2012) Effects of the Western Mediterranean Transition on the resident water masses: Pure warming, pure freshening and pure heaving. J Mar Syst 96-97: 15-23.
- Herrmann M, F Sevault, J Beuvier, S Somot (2010) What induced the exceptional 2005 convection event in the north western Mediterranean basin? Answers from a modeling study. J Geophys Res pp.1- 115.


