Comparison of Satellite Data and Ground Based Weather Data in Masvingo, Zimbabwe
*Simba Farai Malvern and Chiturumani Maurice
Department of Physics, Geography and Environmental Science, Great Zimbabwe University, Africa
Submission: January 08, 2018; Published: January 23, 2018
*Corresponding author: Simba Farai Malvern, Department of Physics, Geography and Environmental Science, Great Zimbabwe University, Africa, Email: faraimsimba@gmail.com
How to cite this article: Simba Farai Malvern and Chiturumani Maurice. Comparison of Satellite Data and Ground Based Weather Data in Masvingo, Zimbabwe. Int J Environ Sci Nat Res. 2018; 8(4): 555739. DOI: 10.19080/IJESNR.2018.08.555739.
Abstract
Recording of weather data is important in any economy and providing accurate data sets is critical in modelling and research work. A comparison of satellite data and ground based weather data offers an opportunity to increase useful and accurate weather data. The study compares rainfall and temperature data at GZU, obtained from an automated weather station and Mesa satellite earth station. All of the comparisons are based on daily rainfall totals and maximum temperatures, as the season of 2016/2017 had significant rains and marked maximum temperatures. The comparisons are based on visual interpretations of the time series of diurnal rainfalls, as well as simple statistics (R2 and slope) of the best fit linear regression line between the time series pairs. There is a marked similarity in temperature and rainfall trend patterns of the two, with ground based data leading satellite data by a marked 2-4 days difference. However the regression analysis for both temperature and rainfall gave R2 values of 0.0241 and 0.0016 respectively. It was observed that satellite data was for areal data whereas ground based gave point data. Ground data took into account topographical differences which the remotely sensed data did not hence the differences. Therefore the comparisons for the two data sets can be restricted to trend validations and not calibrations.
Keywords: Ground; Satellite; Rainfall; Temperature; Weather station; Remote sensing
Abbreviations: MSD: Meteorological Services Department; GZU: Great Zimbabwe University; GPCP: Global Precipitation Climatology Project; GMDC: GPCP Merge Development Centre; PERSIANN: Precipitation Estimation from Remotely Sensed Information using Artificial Neural Networks; MODIS: Moderate Resolution Imaging Spectroradiometer; ITCZ: Inter Tropical Convergence Zone; GPS: Global Positioning System.
Introduction
Within many developing countries and specifically parts of southern Africa, networks of ground-based rainfall or temperature observations have always been relatively sparse. Particularly Zimbabwe and neighbouring countries, the situation is not improving and the density of many networks is decreasing, the amount of missing data is increasing and the reliability of some of the data is becoming increasingly suspect. Part of the reason for this trend is the lack of commitment to funding hydro-meteorological gauging networks in countries that have many more immediate economic issues. However, these are the very countries where economic and social development depends, to a certain extent, on the availability of sound water resources information. Without an adequate network of river flow gauging stations, it is common practice to make use of hydrological models. However, the successful application of such models relies heavily on, inter alia, an accurate representation of basin precipitation inputs. It is increasingly evident that new approaches need to be adopted to provide these inputs as future gauge networks are unlikely to meet the requirements [1]. The Meteorological Services Department (MSD) in Zimbabwe has the preserve for recording and issuance of weather data and forecasts in the country. MSD manages five weather stations in Masvingo (study area), a town in the south east part of Zimbabwe.
Masvingo province has five weather stations namely Chisumbanje, Zaka, Makoholi, Masvingo Airport and Buffalo Range [2]. Due to lack of resources, the weather stations are sparse (one in an area of 100 km2) and this compromises the accuracy of the weather data recorded for the province. There is need for private organisations, farmers and research institutions to invest in with weather recording equipment. Great Zimbabwe University (GZU) a university in Masvingo has an automated and manual weather station to complement MSD in the provision of weather data using standardised weather instruments. The university also have a MESA earth receiving satellite which provides satellite weather data. Satellite-sensed weather data have been proposed as an alternative when weather station data are not available [3,4]. Satellite weather data have been used for crop yield simulations [5] and evapotranspiration estimation [6]. NASA has recently established an online database of satellite- and model-derived weather data [7]. It is imperative for validation of the ground based weather station at GZU to be done against satellite and provide more accurate data for modelling of rainfall and temperature for the area.
Calibration and validation
Calibration of instruments is of paramount importance for determining the spatial and temporal variations of climate. The relative accuracy of measurement of individual sensors in use in a network at one time can be measured and periodically checked. Similarly the performance of replacement sensors and systems can be related to that of those replaced. Trend validation is equally as important as it reflects any possible relationship between ground data and satellite data. This study considers the weather station at GZU as a source for ground based point data and satellite data received by the MESA earth station receiver whose spatial resolution pixel is 5km x 5km, and temporal resolution is 24 hrs. Plotting time series graphs and regression analysis will help to establish any relationship between the two datasets of both temperature and rainfall.
Near global satellite precipitation products
There are a number of references to satellite precipitation estimation methods and products in the hydrological and meteorological literature. These include TAMSAT [8], TOVS [9], GPCP [10,11] and PERSIANN [12,13]. The two that appear to be the most straightforward to access (via internet links) and process into readily usable information are the GPCP and PERSIANN data sets. The GPCP (Global Precipitation Climatology Project) 1DD dataset is based on merged information from several sources:
a) GPCP Geostationary Satellite Precipitation Data Centre (IR Tb histograms),
b) GPCP Merge Development Centre (GPCP SG Merged precipitation estimate and GPROF 6.0 SSM/I fractional occurrence), and
c) GSFC Satellite Data Utilization Office (TOVS precipitation estimates [11]).
The temporal resolution is 1 day, the spatial resolution 1° and the period of record of available data is currently October 1996 to January 2005. Various groups prepare precipitation estimates from individual data sources, while the GMDC (GPCP Merge Development Centre at the NASA Goddard Space Flight Centre) are tasked with combining these into the final product. Each data file (7.4 MB) on the website consists of 1 month of data for the entire globe and it is a relatively simple matter to develop a computer program to extract the data required for a specific region. The PERSIANN (Precipitation Estimation from Remotely Sensed Information using Artificial Neural Networks) datasets have a temporal resolution of 6 h, a spatial resolution of 0.25° and covers regions between 50°N and 50°S [12]. The estimates are based on grid infrared images from geosynchronous satellites (GOES-8, GOES-9/10, GMS-5, Metsat-6 and Metsat-7) and TRMM TMI instantaneous rain from NASA.
The 6 h data files (2 MB) for complete months can be downloaded (between 112 and 124 individual files zipped) from the University of California, Irvine website and, as with the GPCP data, are straightforward to process and extract the data required. An inspection of the individual 6 h data indicates that there are missing data in most of the months for the southern Africa regions of interest. However, they are frequently single 6 h periods, not biased to any specific time of the day or season of the year and result in less than 5% of the accumulated days being missing. The assumption has been made that they will not substantially affect accumulated monthly totals. The PERSIANN data are available for March 2000 to December 2004. For both satellite data sources, the amount of time to download the complete datasets is quite substantial and at commercial internet fee rates would be very expensive. It does not seem to be currently possible to select a specific region on the websites and download only the data for a specific region of interest.
The temporal resolution is 1 day, the spatial resolution 1° and the period of record of available data is currently October 1996 to January 2005. Various groups prepare precipitation estimates from individual data sources, while the GMDC (GPCP Merge Development Centre at the NASA Goddard Space Flight Centre) are tasked with combining these into the final product. Each data file (7.4 MB) on the website consists of 1 month of data for the entire globe and it is a relatively simple matter to develop a computer program to extract the data required for a specific region.
Remotely sensed temperatures
Remotely sensed surface temperature values are available from the measurements of the multi-spectral radiometer sensor called MODIS (Moderate Resolution Imaging Spectroradiometer), which is one of the sensors on-board satellites Terra and Aqua. They were launched to polar orbit as part of the NASA's Earth Observing System in December 1999, and in May 2002, respectively. Seven thermal infrared channels (3660-3840 nm [20], 3929-3989 nm [22], 4020-4080 nm [23], 8400-8700 nm [29], 10,780-11,280 nm [31], 11,770-12,270 nm [32], 13, 185-13,485 nm [33]) of MODIS can be applied to calculate surface temperature. Satellite Terra (Aqua) provides surface temperature fields around 09-10 UTC (12-13 UTC) and 20-21 UTC (02-03 UTC) with 1 km spatial resolution. The pixel values certainly represent larger area than the ground-based measurements. The whole agglomeration has been divided into urban and rural pixels using the MODIS Land Cover Product categories, distance from the city centre, satellite images of the Google Earth, and GTOPO30 global digital elevation model. However, the main disadvantage of this method is that for UHI analysis, data can be used only in case of clear sky conditions, which occurs less frequently in the Carpathian basin during winter than summer [14-18].
Objectives
a) To observe trend relationship between ground based point data and satellite for rainfall and temperature
b) To establish correction factors for the satellite data for modelling purposes
Study location and climate
The entire Zimbabwe generally experience unimodal rainfall pattern. The unimodal nature of rainfall corresponds with the southward migration of the Inter-Tropical Convergence Zone (ITCZ) that follows the position of the overhead sun. Small holder farmers have in many years been depended on favourable rainfall patterns for a good yield. Zimbabwe is an agro-based landlocked country at the base of the African continent. Its neighbours are Mozambique (to the east), South Africa and Botswana (to the south and west), and Zambia (to the north). Zimbabwe lies on a high plateau, and its terrain consists primarily of grasslands bordered on the east by mountains. Masvingo is a province in Zimbabwe found in the south-eastern section of the country. Despite the aridness, the residents of the province are proud tillers of the earth and like most tribes in Southern Africa they practice animal husbandry to supplement their diets. The climate is tropical, although markedly moderated by altitude. There is a dry season, including a short cool season during the period May to September when the whole country has very little rain [19-21].
The rainy season is typically a time of heavy rainfall from November to March. The whole country is influenced by the Inter-tropical Convergence Zone during January. The agro and other economical activities rely mainly on weather information. Some farmers in Masvingo have manual rain gauges and thermometers which they use. Lack of funds and sophistication of automated weather equipment cause them to resort to manual equipment. The experiment was carried in Masvingo Province at Great Zimbabwe University (GZU) in Zimbabwe. GZU is located on longitude 30, 860 and latitude 20, 100 (Figure 1). Masvingo borders Mozambique on its eastern borders, South Africa to the southern boundary, and Matabeleland South province to the south-west, Midlands's province to the north-west and Manicaland to the north east. The province has an area of 56,566 km2 and a population of approximately 1.3 million in 2002 [2]. The province is largely populated by members of the Karanga tribe, who are the most populous tribe in Zimbabwe, and are a sub-group of the Shona speaking tribes that also include the Zezuru, Manyika and Ndau.

Materials and Methods
Meteorological instruments used in this study were:
i. The Rain Wise MKIII Weather Transmitter (AWS) and data logger.
ii. Computer
iii. Global Positioning System(GPS) 60 Garmin receiver
iv. Stevenson Screen
v. MESA Satellite Earth receiver
Accuracy of the measured parameters
Accuracy of the AWS data depends on the two most important characteristic of a sensor which are precision and resolution. There are a lot of good sensors these days and many are 'good enough' out of the box for many non-critical applications. But in order to achieve the best possible accuracy, a sensor should be calibrated in the system where it will be used. This is because no sensor is perfect and the sensor is only one component in the measurement system. Temperature measurements are subject to thermal gradients between the sensor and the measurement point. Precision and resolution are the real 'must have' qualities. But there are a couple of other 'nice-to-have' qualities like linearity and speed.
The MESA Satellite Earth station
Is a satellite receiver at Great Zimbabwe University in Masvingo. It provides various data parameters that include fire activity data, rainfall, temperature and wind patterns. It reads data for Southern Africa up to southern Europe countries, part of the Indian Ocean, and part of the Pacific Ocean. The data used in this study had a pixel resolution of 5km x 5km.
Methodology
The data used for the study was taken from ground based weather station at GZU and satellite data from the MESA earth station. The weather station is a Rain wise model, which has a thermocouple thermometer and a tipping bucket rain gauge. The satellite data is remote sensed data. The data ranges over a period from 1 December 2016 (day 1) to 28 February 2017 (day 84). The data was normalised and tested for randomness using auto-regression analysis with Minitab software before use in the analysis. Analysis has been undertaken and is based on pairwise comparisons of the gauge data with the satellite data. All of the comparisons are based on daily rainfall totals and maximum temperatures, as the season of 2016/2017 had significant rains and marked maximum temperatures. The comparisons are based on visual interpretations of the time series of diurnal rainfalls, as well as simple statistics (R2 and slope) of the best fit linear regression line between the time series pairs. No further statistical measures of fit have been used during this phase of the study, although it is recognized that additional measures may be useful prior to the use of the data within a hydrological model.
Results
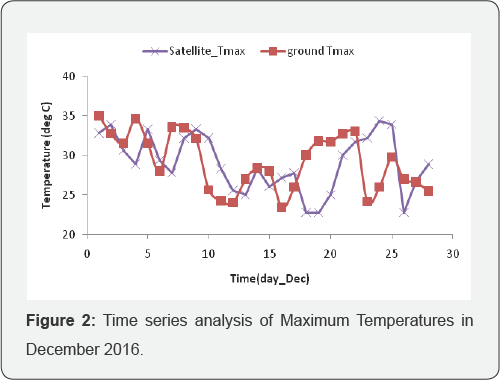
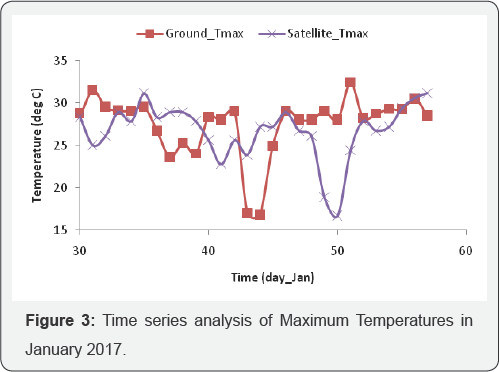
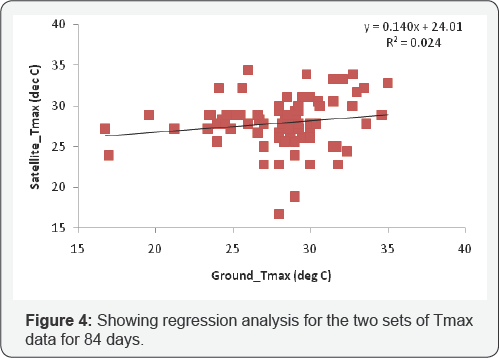
Figure 2 shows trends of satellite data and ground based temperature measurements. There is a marked similarity in trend patterns of the two, with ground based data leading satellite data by a marked 1-1.5 day's difference. Maximum Tmax recorded is on the first day of December for ground and on the second day of December for the satellite. (Figure 3) shows trends of satellite data and ground based temperature measurements. There is a marked similarity in trend patterns of the two, with ground based data leading satellite data by a marked 4-6 days difference. The first trough of Tmax recorded is on day 37 for ground and on day 41 for the satellite. The deepest troughs are recorded at day 44 for the ground and 50 for the satellite. There is a weak daily relationship between the ground based data and the satellite data with an R2 value of 0.0241. However time series graphs in (Figures 2 & 3) shows how the two data sets are related. A correction factor or multiplier of the given R2 can be applied when handling ground based data against satellite especially in modeling (Figure 4).
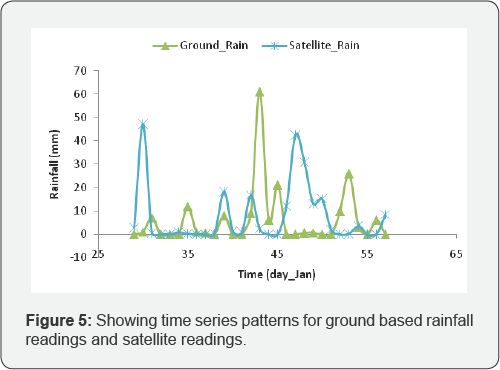
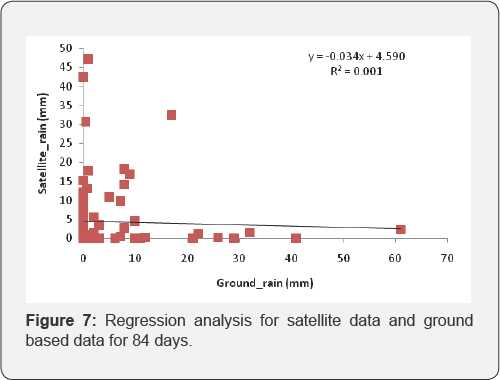
There is a marked similarity in rainfall trends, with ground based readings leading satellite readings. However with rainfall marked patterns can be seen when huge totals i.e >20 mm are recorded. The satellite rainfall readings seem to be suppressed as compared to the ground based gauge data (Figure 5). There is a similarity in rainfall trends for the month of February, with ground based readings leading satellite readings. However with rainfall marked patterns can be seen when huge totals i.e >20 mm are recorded. The satellite rainfall readings seem to be suppressed as compared to the ground based gauge data (Figure 6) . There is a very weak relationship on the diurnal variation of ground gauge data and the satellite remote sensed rainfall with an R2 value of 0.0016. Satellite readings do not normally take into account topographical variations that exist, hence the marked difference (Figure 7).

Discussion and Conclusion
It is recognized that the satellite data represent a real rainfall and temperature, while the gauge data represent point rainfall and that this point needs to be taken into consideration in making the comparisons. Rainfall recorded by the rain gauge and temperature by the thermocouple thermometer are influenced by the wind speed and direction, topography and fetch parameters whereas satellite data is independent of all this. Satellite data will only read remotely sensed rainfall, whether on ground, vegetation, water body etc. Another attribute for the differences lie in the area over which the data is recorded. The ground based data is confined to the orifice size of the gauge which in diameter is 30 cm. the satellite data is averaged over an area of 5km x 5km. Therefore the comparisons can for the two data sets be restricted to trend validations. If there was a network of ground based stations whose data was available and can be compared with the satellite, then calibrations and more accurate correction factors could be generated for modelling purposes.
The trend patterns which were in phase step for temperatures with ground data leading the satellite can be interpreted as due to wind patterns. A certain weather pattern that was at some point A, can be transferred by air motion to point B depending on the wind direction and speed. Therefore satellite readings strongly suggested a later recording of the ground based readings. Temperature comparisons can be taken to be more related to each other in this case than rainfall and a simple correction factor, obtained from the regression analysis can be employed when using the data sets.
References
- DA Hughes (2006) Comparison of satellite rainfall data with observations from gauging station networks. J of Hydrology 327(3-4): 399-410.
- Simba FM, Matorevhu A, Chikodzi D, Murwendo T (2013) Exploring Estimation of Evaporation in Dry Climates Using a Class 'A' Evaporation Pan. Irrigat Drainage Sys Eng 2: 109.
- Pinker RT, R Frouin, Z Li (1995) A review of satellite methods to derive surface shortwave irradiance. Remote Sens Environ 51(1): 108-124.
- Lakshmi V, J Susskind (2000) Comparison of TOVS derived land surface variables with ground observations. J Geophys Res 105(2): 2179-2190.
- De Wit, AJW, CA van Diepen (2008) Crop growth modelling and crop yield forecasting using satellite-derived meteorological inputs. Int J Appl Earth Obs Geo 10(4): 414-425.
- Bois B, P Pieri, C Van Leeuwen, L Wald, F Huard, et al. (2008) Using remotely sensed solar radiation data for reference evapotranspiration estimation at a daily time step. Agric For Meteorol 148(4): 619-630.
- Stackhouse P (2006) Prediction of worldwide energy resource. NASA Langley Research Center, Hampton, USA.
- DIF Grimes, E Pardo Iguzquiza, R Bonifacio (1999) Optimal areal rainfall estimation using rain gauges and satellite data. J Hydrol 222(1- 4): 93-108.
- J Susskind, P Piraino, L Rokke, L Iredell, A Mehta (1997) Characteristics of the TOVS pathfinder path A dataset. Bull Am Meteorol Soc 78: 14491472.
- GJ Huffman, RF Adler, PA Arkin, A Chang, R Ferraro, et al. (1997) The Global Precipitation Climatology Project (GPCP) combined precipitation data set. Bull Am Meteorol Soc 78: 5-20.
- GJ Huffman, RF Adler, MM Morrissey, S Curtis, RJ Joyce, et al. (2001) Global precipitation at one-degree daily resolution from multi-satellite observations. J Hydrometeorol 2: 36-50.
- K Hsu, HV Gupta, X Gao, S Sorooshian (1999) Estimation of physical variables from multi-channel remotely sensed imagery using a neural network: Application to rainfall estimation. Water Resour Res 35(5): 1605-1618.
- S Sorooshian, K Hsu, X Gao, HV Gupta, B Imam, et al. (2000) Evaluation of PERSIANN system satellite-based estimates of tropical rainfall. Bull Am Meteorol Soc 81: 2035-2046.
- JM d Herbes, C Valentin (1997) Land surface conditions of the Niamey region: Ecological and hydrological implications. J Hydrol 188: 18-42.
- GW Kite, P Droogers (2000) Comparing evapotranspiration estimates from satellites, hydrological models and field data. J Hydrol 229(1-2): 3-18.
- RNP Valentijn, R Hoeben, NEC Verhoest, FP De Troch (2001) The importance of the spatial patterns of remotely sensed soil moisture in the improvement of discharge predictions for small scale basins through data assimilation. J Hydrol 251(1-2): 88-102.
- WCRP (1986) Report of the workshop on global large scale precipitation data sets for the World Climate Research Programme. WMO Switzerland 94(2): 1-45.
- X Xiang, EA Smith (1997) Feasibility of simultaneous surface temperature-emissivity retrieval using SSM/I measurements from HAPEX-Sahel. J Hydrol 188: 330-360.
- Bartholy J, Pongracz R, Lelovics E, Dezs'o Zs (2009) Comparison of urban heat island effect using ground-based and satellite measurements. Acta Climatologica et Chorologica, Universitatis Szegediensis Tomus 42: 7-15.
- Dezs'o Zs (2009) Analysis of urban heat island effect in Hungarian and Central-European cities using high-resolution satellite imagery. PhD thesis, Eotvos Lorand University, Budapest. Supervisors: Bartholy J Pongracz R pp. 1-112.
- R Pongracz, J Bartholy, E Lelovics, Zs Dezs'o (2011) Analysis of the urban heat island effect-comparison of ground-based and remotely sensed temperature observations in: 91st AMS Annual Meeting on "Communicating Weather and Climate”/23ri Conference on Climate Variability and Change, 163: 1-5.


