


Forecasting By Discriminant Function Weather Based Analysis
KK Pandey*1, BVS Sisodia2 and VN Rai2
1Department of Agricultural Statistics, VCSG College of Horticulture, India
2Department of Agricultural Statistics, Narendra Dev University of Agriculture and Technology, India
Submission: August 26, 2017; Published: September 01, 2017
*Corresponding author: KK Pandey, Department of Agricultural Statistics, VCSG college of Horticulture, Uttarakhand University of Horticulture and Forestry, Bharsar, Pauri-Garhwal, India, Email: kkpandeystat@gmail.com
How to cite this article: KK Pandey, BVS Sisodia, VN Rai. Forecasting By Discriminant Function Weather Based Analysis. Int J Environ Sci Nat Res. 2017;4(4): 555643. DOI: 10.19080/IJESNR.2017.04.555643
Abstract
In this present study, an attempt to be made on an application of discriminant function analysis of meteorological parameters for developing suitable statistical model to forecast rice yield for Faizabad district of eastern Uttar Pradesh has been demonstrated. Time series data on rice yield for 21 years (1990 to 2010) have been divided into three groups, viz. congenial, normal and adverse based on de-trended yield distribution. Considering three groups as three populations, Discriminant function analysis using weekly data of crop season on seven meteorological parameters has been carried out. The Discriminant scores obtained from this have been used as regress or variables along with time trend in development of statistical model. In this procedure using weekly weather data have been proposed. For the development of the model the data (1990 to 2008) has been used and rest two year (2009 and 2010) data has been used for the validation of model. It has been found that the model provide reliable forecast of the rice yield about two months before the harvest. This model is newly proposed model. However, the model has been most suitable on the basis of Radj2 (87.5%) and RMSE (0.4688).
Keywords: Forecast model; Meteorological parameters; Rice yield; Radj; RMSE
Introduction
Weather is one of the most important factors influencing crop growth. It may influence production directly through affecting the growth structural characteristics of crop such as plant population, number of tillers leaf area etc., and indirectly through its effect on incidence of pests and diseases. The effect of weather parameters at different stages of growth of crop may help in understanding their response in term of final yield and also provide a forecast of crop yields in advance before the harvest. Changes in the timing of phonological events are among the most important indicators of global warming Parmesan and Yohe [1]. The extent of weather influence on crop yields depends not only on magnitude of weather parameters but also on their frequency distribution. Menzel and Fabian [2] reported on phonological change due to increasing of temperature.
The alternation in global warming has dramatically affected agriculture and its productivity. The increase in temperature has significantly led to change in the agricultural zones and shift in the growing season. Fisher [3] has been used by biologists to solve the classificatory problems involving multiple measures in different contexts. Models based on weather parameters can provide reliable forecast of crop yield in advance of harvest Agrawal and Mehta [4]. The forecasting equations have also been developed for wheat yield in Kanpur district U.P. Agarwal [5], Rai, Chandrahas [6] made use Discriminant function of weather variables to develop statistical models for pre-harvest forecasting of rice yield in Raipur district of Chhattisgarh. The model on the basis of weather variable have been done by Agrawal [7,8] A lot of works have been done for the development of the model with the weather variables but no work has been done in this direction for the eastern Uttar Pradesh for rice crop. In the present paper, an attempt has been made to develop suitable statistical model for forecasting of pre-harvest rice yield in faizabad district using Discriminant scores from Discriminant functions obtained from the weekly data on weather variables with a few modifications.
Materials and Methods
The study has been conducted for Faizabad district of Eastern Uttar Pradesh, which is situated between 260 47’ N latitude and 820 12’ E longitudes. It lies in the Eastern Plain Zone (EPZ) of Uttar Pradesh. It has an annual rainfall of about 1002 mm. Time series data pertaining to yield of rice crop for Faizabad district of Uttar Pradesh for 21 years (1990 to 2010) has been procured from Directorate of Agricultural Statistics and Crop Insurance. Govt of Uttar Pradesh. Weekly weather data on respective years on the weather variables of Faizabad district of Uttar Pradesh during the rice crop have been obtained from the department of Agro meteorology, N.D. University of Agriculture & Technology Kumarganj, Faizabad. The data have been collected up to the first 14 weeks of the crop cultivation which includes 23rd standard meteorological week (SMW) to 36th SMW. The data on seven weather variables viz. Minimum Temperature, Maximum Temperature, Relative Humidity, Rainfall, Wind-velocity, Pan Evaporation and Sun-shine hours have been used for the study. We will first describe briefly the technique of Discriminant function analysis. The Discriminant function analysis has been discussed in many books, to mention a few, Anderson [9], Hair [10], Sharma [11], Johnson, Wichern [12] etc.
Consider a linear function of the form
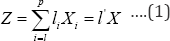
Where Z is discriminant Function, l'= (l1,l2,.....lp) X'= (X1,X2, Xp) Xi is the ith weather variable used to discriminate the groups and li is the corresponding discriminant coefficient, p is the number of variables.
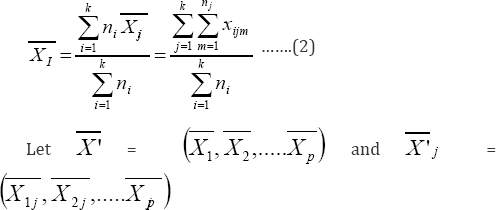
Let nj be the size of jth group ( j = l,.....,k) and xijm be the mth observation of ith variable for jth group. Then mean of jth group for invariable is xij =  xijm and overall average for ithvariable is given by
Let 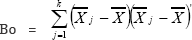 be between group matrix of sum of squares and cross products, and let W =
 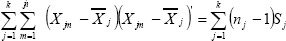 be the pooled matrix of Sum of squares and Sum of products, where Sj is the matrix of sum of squares and product in jth group.
The Fisher’s sample linear Discriminant functions can therefore, be obtained as follows.
Let denote the S ≤ min (g-1, p) non-zero Eigen Values of and be the corresponding eigenvectors (scaled so that ).
Then the vector of coefficients  that maximize the ratio
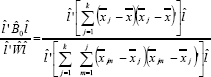
is given by  . The linear combination
  is called the simple first discriminant. The choice
  produce the sample second discriminant,
  continuing
  is the sample kth discriminant function, k ≤ s. For example, if g=3 and p=4, the number of discriminant function will be 2.
The entire Fisher’s discriminant function can be expressed as Anderson’s classification function (statistic) for the purpose of discriminant scores as follows:

Development of forecast models
The crop years have been developed into three groups namely, congenial normal and adverse on the basis of crop yield, which is adjusted for trend effect. Here, only the first 19 year data from 1990 to 2008 have been utilized for the model fitting and remaining two years were left for the validation of the model. Weekly data on weather variables corresponding to three pre defined groups have been used for the development of scores for each year through function analysis technique. In the present study the number of groups is three and number of weather variable is seven. Therefore only two scores will be obtained. Discriminant analysis approach predicts the future observations qualitatively in different groups. For quantitative forecasting, regression models are fitted by taking the scores and the trend variable as and crop yield as the entire 19 weeks data from 23rd to 36th (Standard meteorological week) have been utilized for development of the model.
Development of the Model
In this procedure, function analysis have been carried out using the data on the first weather variables spread over 14 weeks using 23rd to 36th SMW. Using two scores obtained function of the data on the first weather variable and 14 week data on second variable, function analysis has been again performed and two sets of scores are obtained (here the discriminating variables will now become 16). Using these two sets of scores and 14 week data of third variable have been again used to analysis and subsequently two sets of scores have been obtained. up to seventh weather variables, and ultimately we get two set of scores. These two sets of scores and the trend as the variable and crop yield as were utilized to develop forecast model by fitting the following model:

Where y is detrended crop yield βi's ( i =1,2,3) are model parameters, ds1 and ds2 are two sets of discriminant scores, T is the trend variable and e is error term assumed to follow N (0, σ2). This model utilized the complete data over 14 weeks and also considers relative importance of weather variables in different weeks.
Comparison and validation of forecast models
Different procedures have been used in the present study for the comparison and the validation of the developed models. These procedures are given below.
a) Radj2 : The significance of the model can evaluate on the basis of adjusted coefficient of determination (Radj2) which is as follows:
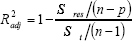
Sres/(n-p) is the residual mean square and St/(n-1) is the total mean square.
.b) The percent deviation of the forecast yield from actual yield have been computed by the following formula:

c) Root Mean Square Error (RMSE):
It is also a measure for comparing two models. The formula of RMSE is given bellow
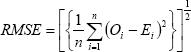
Oi and the Ei are the observed and forecasted value of the crop yield respectively and n is the number of years for which forecasting has been done.
d) Percent Standard error of forecast:
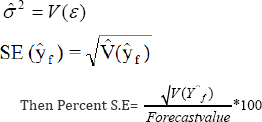
Let ŷf be forecast value of crop yield and X 0 be the column vector of P independent variable at which y is forecasted then variance ŷf is given by (Draper and Smith, 1998) is obtained as
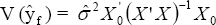
where X’X is the dispersion matrix of the sum of square and cross products of regressors (independent variables) and is the estimated residual variance of the model. Therefore the Percent Standard Error (C.V.) of forecast value is given by

Note: figures in brackets denote Standard error of regression coefficient. **P< 0.01,*P < 0.05, +P<0.10

Note: figures in brackets denote percent deviation of forecast. CV: Coefficient of variation.
Results and Discussion
The forecast models for the rice crop yield have been developed under this procedure along with Radj2 and RMSE are given in (Table 1). First Discriminant score ds1 has been found to be significant at one percent probability level of significance (p < 0.01) in the model and the second discriminant score has been found to be significant at one percent probability level of significance (p < 0.01) in model. Adjusted coefficient of determination (Radj2) has been found to be 87.5% in the model. The root mean square error (RMSE) of forecast model has been found 0.4688 for model. Based on forecast model, the forecasted yield for the year 2008-09 and 2009-10 were obtained and the results are presented in (Table 2).
It is evident from result that percent deviation of forecast yield 1.77 in 2008-09 and 2.43 in 2009-10. The percent standard error (CV) for forecasted yields has been also computed for the model and i.e. presented in (Table 2). The percent standard error of forecast model has been found to be 2.87 for the year 2008-09 and 2.99 for the year 2009-10.
Thus, it can be concluded that the proposed model is most suitable model to forecast rice yield in Faizabad district of Eastern Uttar Pradesh. Hence, a reliable forecast of rice yield about two months before the harvest can be obtained from the proposed model.
Minhajuddin [13] proposed a method to simulate the joint distribution which have equal to positive pair-wise correlations and the method was illustrated for the p-dimensional families of beta and gamma distributions. Sever [14] compaired fisher's discriminant analysis under normal and skewed curved normal distribution based on the apparent error rates, which were used as a measure of classification performance and found that fisher’s linear discriminant analysis to be highly robust under skewed curved normal distribution. Rausch, Kelley [15] compared different methods for discriminant analysis with respect to classification accuracy under non normality through Monte Carlo simulation. Pandey [16] compared different distribution as normal, lognormal, and pearson’s type on the basis of weather variable on wheat yield for Faizabad district of Eastern U.P. Raman [17] compared non-normal rice and maize yield with linear discriminant function analysis under multivariate analysis for New Delhi. Ito and Schull [18] discuss the robustness of T02 Statistics, when the conditions of equality of covariance matrices are not satisfied.
The Dirichlet distribution is a multivariate generalization of beta distribution Kotz [19]. Almost similar results, as observed in this study, have also been reported by Kandiannan [20] for Coimbatore in Tamil Nadu, where temperature, rainfall and radiation entered significantly in a stepwise prediction equation of rice yield. In Andhra Pradesh also, rainfall and temperature have been reported to affect rice yield significantly Barnwal and Kotani [21], Lal [22] also observed that maximum temperature, minimum temperature and moisture stress were crucial weather variables affecting soybean yield. Temperature, rainfall and relative humidity were found significantly correlated with sugarcane yield, Srivastava [23,24].
References
- Paramesan C, G Yohe (2003) A globally coherent fingerprint of climate change impacts across natural systems. Nature 421: 37-42.
- Menzal A, P Fabian (1999) Growing season extended in Europe. Nature 397: 659.
- Fisher RA (1936) The use of multiple measurements in taxonomic problems. Ann Eugenics 7(2): 179-88.
- Agrawal R, SC Mehta (2007) Weather based forecasting of crop yields, pests and diseases - IASRI models. Journal of Indian Society of Agricultural Statistics 61(2): 255-263.
- Agrawal R, Chandrahas, A Kumar (2012) Used discriminant function analysis for forecasting crop yield. Mausam 63(3): 455-458.
- Rai T, Chandrahas (2000) Use of discriminant function of weather parameters for developing forecast model of rice crop. Publication of IASRI, India.
- Agrawal R, RC Jain, D Singh (1980) Forecasting of rice yield using climatic variables. Indian Journal of Agricultural Sciences 50 (9): 68084.
- Agrawal R, RC Jain, SC Mehta (2001) Yield forecast based on weather variables and agricultural inputs on agrioclimatic zone basis. Indian Journal of Agricultural Sciences 71(7): 487-490.
- Anderson TW (1998) An introduction to multivariate statistical analysis. John Wiley & Sons, USA.
- Hair JF, JRE Anderson, RL Tatham, C William (1995) Multivariate data analysis with readings. PRENTICE HALL, US.
- Sharma S (1999) Applied Multivariate Techniques. John Wiley & Sons, USA.
- Johnson RA, DW Wichern (2006) Applied multivariate statistical analysis. Pearson Education.
- Minhajuddin AM, IR Harris, WR Schucany (2004) Simulating multivariate distribution with specific correlation. Journal of Statistical Computation and Simulation 74 (8): 599-607.
- Sever M, J Lajovic, B Rajer (2005) Robustness of Fisher's discriminant function to skewed normal distribution. Metodolisiki Zvezki 2(2): 23142.
- Rausch RJ, Kelley (2009) A comparison of Linear and Nonlinear models for discriminant analysis under non-normality. Behaviour Research Methods 41(1): 85-98.
- Pandey KK, RP Kaushal, AN Mishra, VN Rai (2009) A study on Impact of weather variables with different distributions. International Journal of Agricultural and Statistical Sciences 5(1): 139-53.
- Raman RK, SD Wahi, AK Paul (2012) Linear discriminant function under multivariate non-normal rice (oriza sativa) and maize (zea mays) data. Indian journal of Agricultural Sciences 82(5): 426-29.
- Ito K, WJ Schull (1964) On robustness of T02 test in multivariate analysis of variance when covariance matrices are not equal. Biometrica 51(1- 2): 71-82.
- Kotz S, N Balakrishnan, NL Jhonson (2000) Continuous multivariate distribution, USA pp. 485-541
- Kandiannan K, R Karthikeyan, R Krishnan, C Kailasam, TN Balasubramanian (2002) Crop weather model for prediction of rice (oryza sativa l) yield using an empirical-statistical technique. Journal of Agronomy and Crop Science 188(1): 59-62.
- Barnwal P, K Kotani (2010) Impact of variation in climatic factors on crop yield: a case of rice crop in Andhra Pradesh, India. Economics & Management Series. 17 International University of Japan.
- Lal M, KK Singh, G Srinivasan, LS Rathore, D Naidua, CN Tripath (1999) Growth and yield responses of soybean in Madhya Pradesh, India to climate variability and change. Agricultural and Forest Meteorology 93(1): 53-70.
- Srivastava AK, PK Bajpai, RL Yadav, SS Hasan (2007) Weather based sugarcane yield prediction model for the state of Uttar Pradesh. Journal of Indian Society of Agricultural Statistics 61(3): 313-327.
- Draper NR, H Smith (1998) Applied Regression Analysis. 3rd edition, John Wiley & Sons Inc.


