Influence of Different Land Use Types and Soil Depths on Selected Soil Properties Related to Soil Fertility in Warandhab Area, Horo Guduru Wallaga Zone, Oromiya, Ethiopia
Mengistu Chemeda1, Kibebew Kibret2 and Tarekegn Fite3*
1Department of Natural Resource Management and Environmental Science, Haramaya University, Dire Dawa, Ethiopia
2Department of Plant Science, Jimma University, Ethiopia
Submission: July 17, 2017; Published: August 22, 2017
*Corresponding author: Tarekegn Fite, Department of Plant Science, Jimma University, Ethiopia, Email: tfduressa@gmail.com
How to cite this article: Mengistu C, Kibebew K, Tarekegn F. Influence of Different Land Use Types and Soil Depths on Selected Soil Properties Related to Soil Fertility in Warandhab Area, Horo Guduru Wallaga Zone, Oromiya, Ethiopia. Int J Environ Sci Nat Res. 2017;4(2): 555634. DOI: 10.19080/IJESNR.2017.04.555634
Abstract
Background: Inappropriate land use system in Ethiopia, leads to extensive deforestation which exacerbates soil erosion and other soil degradation.
Methods and Materials: The study was conducted at Warandhab area, Jimma Rare District, Wallaga Zone, Oromiya Region, with the objective to identify the influence of different land use types and soil depths on selected soil physical and chemical properties related to soil fertility.
Results: Soil physical properties, pH, SOM, total nitrogen, available P, exchangeable Mg, K, Na, CEC and micronutrients observed were significantly affected (P ≤0.05) by land use. All land use types were clayey but clay loam for forest land. The highest and lowest mean BD was obtained in subsurface of cultivated and surface layer of grazing land respectively. The highest soil water content at FC and AWHC and lowest was recorded in subsurface and surface of forest and cultivated land, respectively. The highest pH = 6.47 and lowest pH = 5.29, were obtained in subsurface of grass land and surface layers of cultivated land, respectively. The range of pH in surface and subsurface layers of all and use types were strongly acidic to slightly acidic. The higher (16.00, 20.04, 89.03, 2.49, 3.39) mg/kg available P, Fe, Mn, Zn, Cu, respectively and CEC (32.80 cmol(+)/kg) were recorded in surface layer of cultivated land than in subsurface. Values of exchangeable bases (Na, K, Ca and Mg) were lower on surface of cultivated land than subsurface of forest land, respectively.
Conclusion: The inappropriate land use management led to disturbance of soil nutrient status, indicating that the soil condition in the cultivated land is getting below the condition of soils under forest and grazing lands. Therefore, reducing intensity of cultivation, adopting integrated soil fertility management and application of organic fertilizers could maintain the existing soil condition and replenish degraded soil properties.
Keywords : Land use types; Soil depths; Soil fertility; Soil productivity; Soil physical properties; Soil chemical properties; Micronutrients; Soil Organic Matters; Grass land; Cultivated land
Abbreviations: SOM: Soil Organic Matter; GPS: Global Positioning System; GIS: Geographical Information System
Introduction
With the rapid growth of African population, soil fertility is a major concern of the world, including Ethiopia which is the second populous African country. High quality soils not only produce better food and fiber, but also help to establish natural ecosystems and enhance air and water quality [1]. Soil fertility changes and the nutrient balances are taken as key indicators of soil quality [2]. It is well known that in traditional farming systems, farmers use bush fallow, plant residues, household refuse, animal manures and other organic nutrient sources to maintain soil fertility and soil organic matter. Soil fertility varies spatially from field to larger region scale, and is influenced by both land use and soil management practices [3]. Revealing spatial variability of soil fertility and its influencing factors are important to improve sustainable land use strategies [4]. It is reported that differences in fertilization, cropping system and farming practices were the main factors influencing soil fertility quality at field scale [5].
The physical conditions and variations in altitude have resulted in a great diversity of climate, soil and vegetation Asrat [6] which constitutes the high mountains, deep gorges, flat- topped plateaus, and rolling plains of Ethiopian topographical feature. Due to such typical feature and cultivation pattern such as on steep and fragile soils with inadequate investments in soil conservation, erratic and erosive rainfall patterns, declining use of fallowing, limited recycling of dung and crop residues to the soil, limited application of external sources of plant nutrients, deforestation and overgrazing Belay [7] and Hurni [8] were the main causes of land degradation in Ethiopia. Inappropriate use of land, mainly characterized by extensive deforestation and conversion into agricultural land, is the most widespread change in land use in Ethiopia [9,10]. All these contribute to the change in chemistry, biology and hydraulics of the soil.
Smith et at. [11] reported that deforestation and cultivation of the same land as the main cause of changes in soil pH and acidifications. Although soil organic matter (SOM) are crucial in regulating the supply of plant nutrients, water flow and determines the physical properties of the soil Cotrufo et al. [12], its altered by soil managements and types, land uses systems and types and the climate [13-15]. As reported by Genxu et al. [16] the availability and distributions of P in soil profile is determined by the different land use types, management practices such as level of SOM, biomass production in the soil, vegetation cover and nutrient cycling in the ecosystems. In another study, in the sub-humid highlands of South-western Ethiopia, shift of land use changes from natural forest to cultivation led to depletion of P [9]. Because of the study area are facing agricultural challenges such as shortage of land for crop cultivation and livestock grazing, decline of soil fertility and rainfall variability resulting in low yield production, determining the soil property is crucial for further soil management and improvement. Therefore, this study was initiated with the objective to investigate the influence of different land use types and soil depths on selected soil physical, chemical properties and organic matter in Warandhab areas of Jimma Rare District.
Materials and Methods
Description of the Study Area
The study was conducted at Warandhab area in Jimma Rare District, Horo Guduru Wallaga Zone, Oromiya Regional State. It is about 255 km away from the capital, Addis Ababa, and located in the mid-west of Ethiopia and 10 km away from the district town, Wayu, to the west. Geographically, it is located between 9o 13' 26” to 9o 15' 58” north latitude, and 37o 15' 14” to 37o 16' 02” east longitude with an elevation ranging 2224-2243 metres above sea level (Figure 1). It covers an area of about 800 hectares and shares commonly with Dile Kolba Peasant Association to the west, Biqiltu Babala and GudataDobi PA in the east, Bada Warqe PA in the south and swamp/marsh area in the north. Jimma Rare District shares boundaries in the west with Jimma Ganati and BakoTibe Districts, in the north with Guduru District, in the south and east with Caliya District. This district possesses a total area of 340.78 km2 (Figure 1).
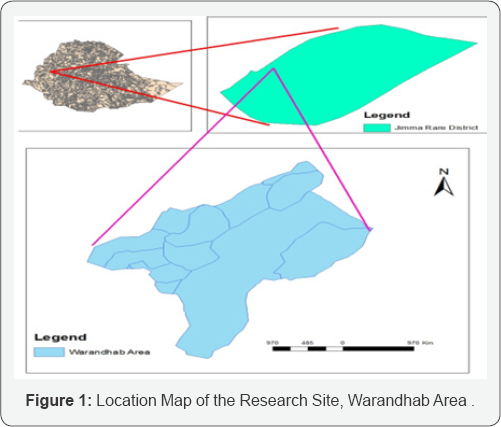
Climate
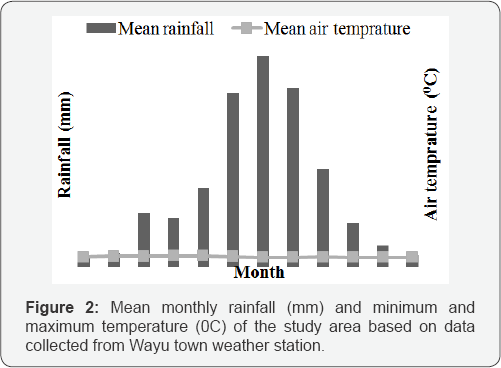
The average weather data recorded at the weather station located at Wayu town near the study area from the year 20042010 indicates that the study area has a uni-modal rainfall pattern with mean annual rainfall of 1530.9 mm. The rainy season covers the period from mid-April to October and the maximum rain is received in the months of June, July and August (Figure 2). The annual mean minimum and maximum and the annual average air temperature for the year 2010 are 11.5, 23.8, and 17.625 0C, respectively (Figure 2).
Site Selection, Soil Sampling and Preparation
Planning, surveying and appropriate sampling are important considerations when attempting to measure changes in surface soil chemical and physical properties to accommodate spatial variation. Primarily, a general visual field survey of the area was carried out to have a general view of the variations in the study area. Representative soil sampling site were then selected based on vegetation cover and cultivation history. Following this, three representative land uses (cultivated, forest and grass lands) were selected and Global Positioning System (GPS) and clinometers were used to identify the geographical locations and slopes of the sampling sites, respectively. Using Geographical Information System (GIS) and geographical coordinates for each sampling site, the sampling site was sketched. Composite soil samples were collected from the depths of 0-20 and 2040 cm. Each composite soil samples was made from 5-10 subsamples collected from within the respective area delineated as a replication of such land use. Dead plants, furrow, old manures, wet spots, areas near trees and compost pits were excluded during collection of samples. This was minimizing differences, which may arise because of the dilution of SOM due to mixing through cultivation and other factors.
The soil samples collected from representative land uses with its replications were then air-dried, mixed well and passed through a 2 mm sieve for the analysis of selected soil physical and chemical properties. Separate soil core samples from the 0-20 and 20-40 cm depths were taken with a sharp-edged steel cylinder forced manually into the soil for bulk density determination. To make one composite soil sample the subsamples were mixed well and about 1 kg of the mixed subsamples was properly labeled. Finally eighteen total composite soil samples were prepared and packed in a plastic bowl, and transported to Soil Testing Centre for further analysis.
Analysis of Soil Properties
Soil texture was determined by the Bouyoucos hydrometer method after destroying organic matter and dispersing the soil by using sodium hexametaphosphate as described by [17]. Bulk density was determined from undisturbed soil samples by the core method after drying a defined volume of soil in an oven at 105 °C to constant weight [18]. It was calculated as the ratio of mass of oven dried soil to the volume of the sampling core. The soil water content at PWP and FC was determined after soils were subjected to required pressures (15 and 1/3 bars, respectively) by the pressure plate apparatus. Soil pH (H2O) and pH (KCl) were measured by using a pH meter in a 1:2.5 soil: water and soil: KCl ratios, respectively [19]. Soil organic carbon was estimated by the Walkley-Black wet oxidation method and converted to organic matter by multiplying the percent organic carbon content by a factor of 1.724, assuming that organic matter is composed of 58% carbon [20].
Total nitrogen was determined by the micro-Kjeldahl digestion, distillation and titration method Sahlemedhin and Taye [21] and available P was determined using the standard Olsen extraction method [22]. Total exchangeable bases were determined after leaching the soils with ammonium acetate [23]. Amounts of Ca2+ and Mg2+ in the leachate were analyzed by atomic absorption spectrophotometer and K+ and Na+ were analyzed by flame photometer. Cation exchange capacity was determined at soil pH level of 7 after displacement by using 1N ammonium acetate method in which it was estimated titrimeterically by distillation of ammonium that was displaced by sodium [24]. Percent base saturation was calculated by dividing the sum of the base forming cations (Ca, Mg, Na, and K) by the CEC of the soil and multiplying by 100. Total exchangeable acidity was determined by saturating the soil samples with potassium chloride solution and titrated with sodium hydroxide as described by [25]. Extractable micronutrients (Fe, Cu, Zn, and Mn) were extracted by diethylene triamine penta acetic acid (DTPA) as described in [21]. Finally, the amounts of all these micronutrients were measured by atomic absorption spectrophotometer at their respective wave lengths.
Statistical Analysis
The general linear model (GLM) ANOVA procedure of statistical analysis system SAS [26] was used for performing the significance of differences in soli parameters. A post hoc separation of means was done by least significant difference (LSD) test after main effects was found significant at P ≤0.05. The analysis was performing for each land use types (cultivated, grass and forest lands) in six combined treatments.
Results and Discussion
Soil Physical Properties
Soil texture
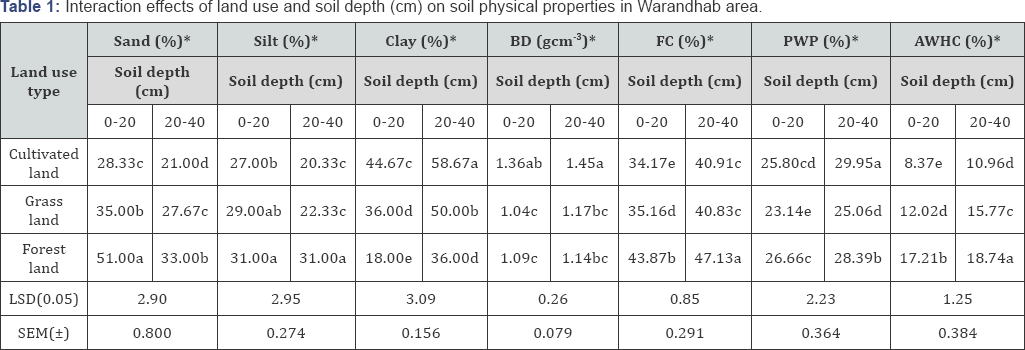
The sand and clay fractions were significantly (P ≤ 0.01) affected by the interaction of land use and soil depth. Similarly, the silt fraction was significantly (P≤ 0.01) affected by land use and soil depth (Table 1). Considering the interaction effects of land use and soil depth, the highest (51%) sand and (31%) silt contents were recorded at the surface layer of forest land than cultivated land. In contrast, the highest (58%) clay content was recorded at the subsurface layer of the cultivated land, whereas the lowest (18.00) clay content was observed in the surface layer of the forest land (Table 1). The current result is in agreement with the findings of Shiferaw [27] who reported an increase in clay content with depth under cultivated lands due to long period of cultivation.
In a similar way Boke [28]; Alemayehu and Sheleme [29] reported that high sand content in grass land soils in Southern Ethiopia. Buol [30] also observed that the accumulation of clay in the subsurface horizon could also be contributed by the in situ synthesis of secondary clays or the residual concentration of clays from the selective dissolution of more soluble minerals of coarser grain size in the B horizon. Agoume and Birang [31] similarly found that land-use systems and soil depths significantly affected the sand, the clay and the silt fractions of the soils size distributions in Cameroon and even by land use alone Jaiyeoba, VoundiN, kana and Tonye [32-36] reported that continuous cropping and intensive land use affected the particle size distribution and that these changes related to cultivation time, but the current finding is in contradict to the result reported by Shepherd et al. [35] who found that land use systems were no effect on soil particles. Sand and silt content decrease while clay content increases across depth from surface to subsurface soils. The increase in clay contents with depth under all land use types may be due to translocation of clay from surface to subsurface layers, which ultimately increase the proportion of sand and silt contents in the surface soil layers.
Soil water characteristics
Water retention at both FC and PWP was significantly affected by main effects (P ≤0.01) and their interaction (Table 1). Moreover, AWHC was significantly (P ≤ 0.01) affected by land use and soil depth but not significantly (P > 0.05) affected by their interactions (Table 1). Significant difference in FC and PWP due to the interaction of land use and soil depth as observed in the study area was high at subsurface layers of the forest and cultivated lands and low at the surface layers of the cultivated and grass lands, respectively (Table 2). On the other hand, the highest (17.98%) and the lowest (9.67%) AWHC among the land use types was obtained in the forest and cultivated lands, respectively. The soil water content at FC, PWP and AWHC increased with soil depth (Table 2). The result of this study is in agreement with Wakene [37] and Ahmed [38] who reported that soil water content at FC, PWP and AWHC were found to increase with depth for soils under different management practice. As per AWHC rating developed by Beernaert [39], the AWHC of the surface soils of the study area was in the range of low in cultivated land to medium in forest land (Table 2). Moreover, various studies also examined the effects of land use and land cover change on soil physico-chemical properties [31, 32,39-41]. *Main effect means within a column followed by the same letter are not significantly different from each other at p ≤ 0.05 LSD = least significant difference; SEM = standard error of the mean; BD = bulk density; FC = field capacity; PWP = permanent wilting point; AWHC = available water holding capacity.
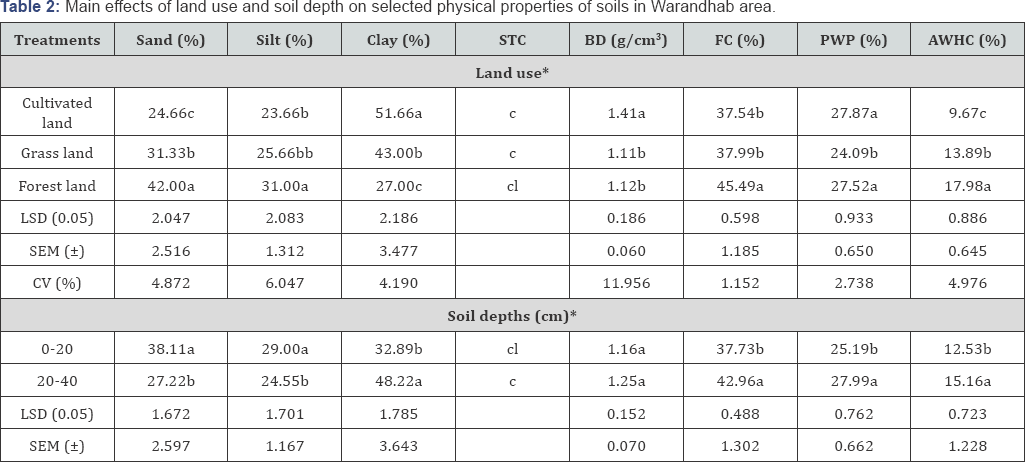
Bulk density value was significantly (P ≤ 0.05) affected by land use types (Table 2). The highest (1.41 g/cm3) mean value of bulk density was recorded on the cultivated land and the lowest (1.11 g/cm3) mean value under the grass land (Table 2).
Compaction resulting from intensive cultivation might have caused the relatively higher bulk density values in the surface soil layers of the cultivated land than that of the respective soil depths in the grass land. Liu [5] and Celik, [36] reported that land use and soil management practices influence the soil nutrients and related soil processes, such as erosion, oxidation, mineralization and leaching etc. Moreover, in non-cultivated land, the type of vegetative cover is a factor influencing the soil organic carbon content as reported by Liu et al. [5]. Land use change also produces considerable alterations Fu et al. [42] and usually soil quality diminishes after the cultivation of previously untilled soils [38]. The reason for the relatively low soil bulk density on the grass and forest lands as well as surface soil layer could be due to the highest SOM content and low clay content, respectively. Similarly, Gol [43] also investigated the effects of land use change on soil properties and organic carbon at Dagdami river catchment in Turkey and bulk density as affected by land use in Ethiopia [40]. *Main effect means within a column followed by the same letter are not significantly different from each other at p ≤ 0.05; NS = not significant; STC = soil texture class; c = Clay; cl = Clay loam; BD = Bulk density; FC = Field capacity; PWP = Permanent wilting point; AWHC = Available water holding capacity; LSD = least significant difference; SEM = Standard error of the mean; CV = Coefficient of variation.
Soil Chemical Properties

Soil pH values measured in a suspension of soil to water ratio are greater than that of in soil to KCl solution ratio. The pH (H2O) value of the soils content was significantly (P ≤ 0.01) affected by all land use types and their interaction effects (Table 3). The highest (6.47) and the lowest (5.29) soil pH-H2O values were recorded under the grass and the cultivated lands at 2040cm and 0-20cm soil depths, respectively (Table 3). Continuous cultivation practices, excessive precipitation, and application of inorganic fertilizers could be some of the factors which are responsible for the variation in pH in the soil profiles [42-45]. In line with the findings of this study, soil pH increased with depth of soil profile and relatively high pH was observed at subsoil horizons in Alfisols of Bako area Wakene [37] and in Vertisols of the central highlands of Ethiopia [46]. Agoume and Birang [31] also reported that pH of the soil as affected by land use system of an Oxisol in the Humid Forest zone of the Southern Cameroon. In other study conducted by Nega and Heluf [47] they found that pH the soil was affected by the interactions of land use changes and the soil depths in Western Ethiopia. Alemayehu and Sheleme [29] also found an increment of soil pH at two depths (0-15 and 15-30cm) under enset cultivations and. Generally, the pH (H2O) values observed in the study area were within the ranges of moderately acidic to slightly acidic (5.50-6.23) and pH (KCl) values ranged from very strongly acidic to strongly acidic (4.305.21) soil reactions as classifications indicated by Brady and Weil [48].
Soil organic matter/SOM content was significantly (P ≤ 0.01) affected by the interaction of land use type with soil depth (Table 3). The interaction effect of land use by soil depth, on the variability of SOM was significantly higher (8.37%) at surface layer of the forest land and lower (1.83%) at subsurface layer of cultivated land (Table 3). The reason may be due to intensive cultivation of the land and the total removal of crop residues for animal feed and source of energy. Based on the distribution of SOM ranges suggested by Berhanu [49], the soils of the study area were ranged from medium in cultivated land to very high in forest land. Urioste et al. [50] suggests thatroots of the grass and fungial hyphae are probably responsible for the high amount of total organic matter in grassland. This result is in agreement with Eylachew [51,52] and who reported that SOM content under grazing and cultivated soils were lower than those under natural vegetation's/forest. Malo et al. [53]; Nega and Heluf [47] also reported less organic carbon in the cultivated soils than grassed soils and high in the surface soils of forest land while least were from subsurface layers of the cultivated soils, respectively.
Total nitrogen content of soils was significantly (P ≤ 0.01) affected the interaction of land use by soil depth (Table 3). On the other hand, carbon to nitrogen (C/N) ratio of the soils at the study area was significantly affected by the interaction of land use with soil depth (P ≤ 0.01). On the other hand, it was not significantly (P > 0.05) affected by soil depth (Table 3). The effect of land use by soil depth on total N was significantly higher (0.42%) at the surface layer of the forest land than (0.09%) in the subsurface layer of the cultivated land (Table 3). The mean total N content of the surface soils of the study area was within the range of low in soils of cultivated land to very high in soils of forest land as per total N rating suggested by Berhanu [49,47]. The very high total N content in soils of the forest land could be associated with the high available P and CEC contents of these soils. In their study,Alemayehu and Sheleme [29] also found higher total nitrogen in grassland fields followed by that of enset at 0-15 and 15-30cm soil depths. Moreover, this study was in agreement with Ukaegbu and Akamigbo [54]; Agoume and Birang [31] and Iwara et al. [55] they found that total nitrogen as affected by land use systems.
Carbon to nitrogen ratio of the subsurface layer of the cultivated land was significantly higher (11.65) than those under forest and grazing lands at 20-40cm soil depths (Table 3). The C/N ratios were numerically high in the subsurface than surface soil layers. Our current result contradicts the finding of Nega and Heluf [47] who found that land uses did not variant in C/N ratio but these ratios varied across soil depth. Yihenew [56] indicated that the optimum range of the C/N ratio is about 10:1 to 12:1 that provides nitrogen in excess of microbial needs. Accordingly, the C/N ratio of the soil across the study area may be considered to be within the optimum range in all land use types and soil depth. *Main effect means within a column followed by the same letter are not significantly different from each other at p < 0.05 LSD = least significant difference; SEM = standard error of the mean; SOM = soil organic matter; total N = total nitrogen; C/N = carbon to nitrogen ratio; AvP = available phosphorus; EA = exchangeable acidity.
Available Phosphorus
The available phosphorus (P) was significantly (P ≤ 0.01) affected by the interaction of the two factors (Table 3 and Appendix I). The content of available P in the cultivated land appeared to be significantly higher than the other two land use types. The higher in available P contents in soils of cultivated land were due to continuous application of mineral P fertilizer for few years as indicated by different farmers in the area. Van der Eijk et al. [57] have also reported that the high content of P under maize farms than of grass land soils could be due to the continuous application of phosphorus fertilizer applications. Similarly, Boke [28] also found that high availability of P under enset farms which is due to rapid mineralization and additions of manure and crop residue. Accordingly, by considering the interaction effect of land use with soil depth, the highest (16.00 mg kg-1) and the lowest (1.67 mg kg-1) available P contents were recorded at the surface soil layer of the cultivated and subsurface soil layer of the grass lands, respectively (Table 3). This result is in agreement with the findings reported by Nega and Heluf [47]; Ekukinam [58]; Alemayehu and Sheleme [29] that soil available P was significantly affected by land use types. The mean available P content of the soils of the study area was within the range of low in soils of grass land to high in soils of cultivated land as per available P rating suggested by [22].
Exchangeable Acidity and Basicity
The exchangeable acidity was not significantly (P >0.05) affected by land use and soil depth interaction (Table 3). Considering the absolute figures, relatively higher EA was recorded in soils of the cultivated land as compared to the other land use types (Table 3). These results show that intensive cultivation and application of inorganic fertilizers leads to the higher exchangeable acidity content under the crop field than the other land uses.
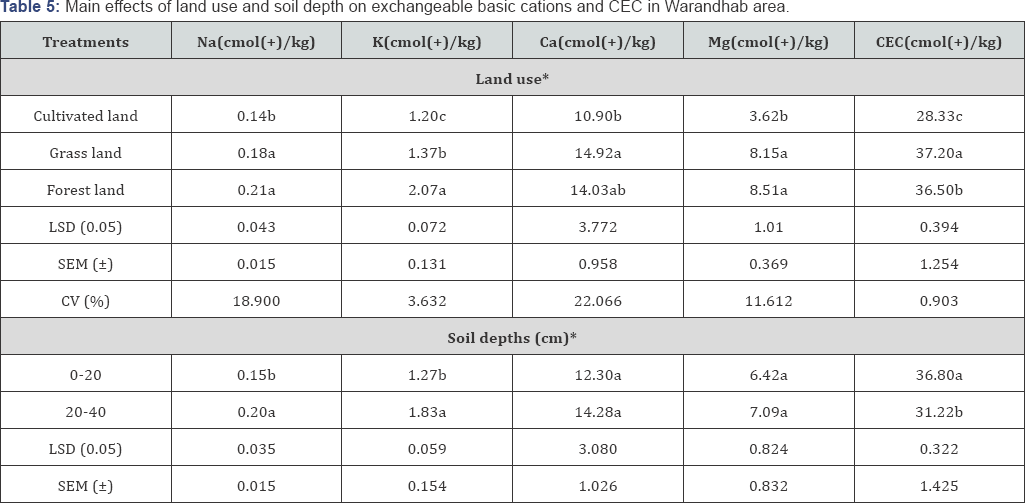
The content of exchangeable calcium (Ca) was not significantly (P > 0.05) affected by the interaction of land use with soil depth (Table 4). Based on the data obtained in the study area, relatively higher exchangeable Ca was recorded in subsurface soil layer of the forest land as compared to the other land use types and their depths (Table 4). According to the rating set by Landon [59], the Ca contents of soils in the study area ranged from high in surface cultivated land to very high in subsurface forest land (Table 4). The present study was in contradicted with Agoume and Birang [31]; Iwaraet al. [55]; Gebeyaw [32] who reported exchangeable calcium (Ca) was significantly affected by land use systems. However, Alemayehu and Sheleme [29] found higher Ca exchangeable under enset field at 0-15cm soil depths.
Exchangeable K content was significantly (P ≤ 0.01) affected by the interaction of land use and soil depth (Table 4). Considering the interaction effects of land use by soil depth, the highest (2.15 cmol(+)/kg) and the lowest (0.77 cmol(+)/ kg) exchangeable K contents were recorded at the subsurface layers of the forest land and the surface layers of the cultivated land, respectively (Table 4). The low exchangeable K contents observed under cultivated land could probably due to continuous cultivations and inorganic farming practices in the study area which is supported by previous findings that indicate intensity of weathering, cultivation and use of acid forming inorganic fertilizers affect the distribution of K in the soil system and enhance its depletion [53].
The concentration of exchangeable potassium (K) followed trend of being enset field > grass land >maize farms for the three land uses and depths (0-15 and 15-30cm) and highest cation exchange capacity (CEC) under grassland [29].With the exceptions of the surface layers of the forest land and the subsurface layer of the grass lands, the mean exchangeable K contents of the remaining treatment combinations were significantly different (P≤ 0.05) from each other due to the interaction effects. The rate of mean exchangeable K values observed in this study ranged from high in cultivated land to very high in forest land Wang et, al. [60,61] (Table 4). Urioste et al. [50] reported that, the addition of organic matter increases the amount of exchangeable cations bases and the low cations bases in cultivated fields are due to the intensive cultivations and continues use of inorganic fertilizers which enhances the loss of base cations through erosion, crop harvest and leaching [62].
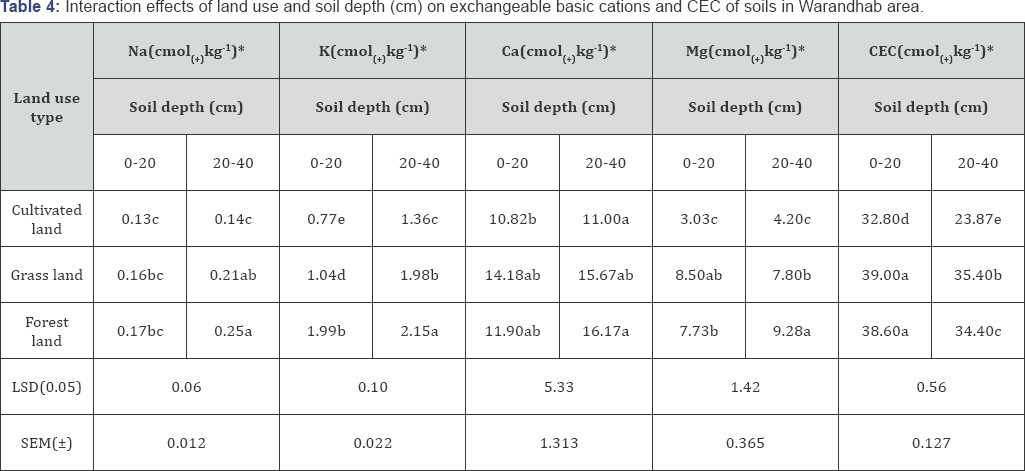
The content of exchangeable Na was significantly (P ≤0.01) affected by the interaction of land use by soil depth (Table 4). The effects of land use by soil depth on exchangeable Na was significantly high (0.25 cmol(+)/kg) under subsoil layer of the forest land and low (0.13 cmol(+)/kg) under surface soil layer of the cultivated land (Table 4). According to the rating set by Landon [59], the Na contents of soils in the study area is low. Alemayehu and Sheleme [29] reported higher exchangeable Na exists in the 15-30cm depth in grassland soils under enset field.The increase in basic cations concentration as well as percent base saturation with depth may suggest the existence of downward movement of these constituents exchangeable Ca, Mg, Na and K within the profile. Generally, the lower available exchangeable Na cation under cultivated land is an indicative for the depletion of the surface soils of the study area. Moreover, Negassa [62] reported that intensive cultivation and continuous use of inorganic fertilizers in the cultivated fields that will enhance loss of base cations through leaching, erosion and crop harvest.
Cation Exchange Capacity
The CEC values of the soils in the study area were significantly (P ≤ 0.01) affected by the interaction of land use with soil depth (Table 4). Significant difference in CEC contents due to the interaction of land use and soil depth was observed in the study area as highest (39.00 cmol+/kg) in surface soil layer of the grass land and lowest (23.87 cmol+/kg) in subsurface soil layer of the cultivated land. CEC values decreased from the surface to the subsurface layer under different land use types (Table 4). Based on CEC ratings developed by Landon [59], the CEC content of soils of the study area was rated as high in their CEC. It was generally low in the cultivated land than in the other land use types (Table 4). As indicated by Mesfin [63]; Negassa [62]; Boke [28] the depletion of exchangeable bases as the result of intensive cultivation and application of acid forming inorganic fertilizers which reduced the CEC under the cultivated land. Reid and Dirou [64] reported that oils with large amounts of clay or OM have higher exchange capacities than sandy soils, which are usually low in organic matter. Alemayehu and Sheleme [29]; Wasihun et al. [40] also reported high cation exchange capacity (CEC) values under grassland and grazing land compared to cultivated land respectively.
Exchangeable magnesium (Mg) was significantly (P ≤ 0.01) affected by land use, but not significantly (P > 0.05) affected by soil depth and the interaction of land use with soil depth. The mean values of exchangeable magnesium (Mg) was higher (8.51 cmol(+)/kg) under the forest land and lower (3.62 cmol+/kg) under the cultivated land. As per exchangeable Mg rating set by Landon [59], the Mg contents of soils in the study area was in the range of high in cultivated land to very high in forest land (Table 5). The result of study was in agreement with those reported by Wakene [41], who reported that inorganic fertilizer application is the root cause of soil acidity. In addition, Wang et, al. [60]; Iwara et al. [55] also indicated that climate and geological history are the main important factors affecting soil properties.
Extractable micronutrients (Fe, Mn, Zn and Cu)
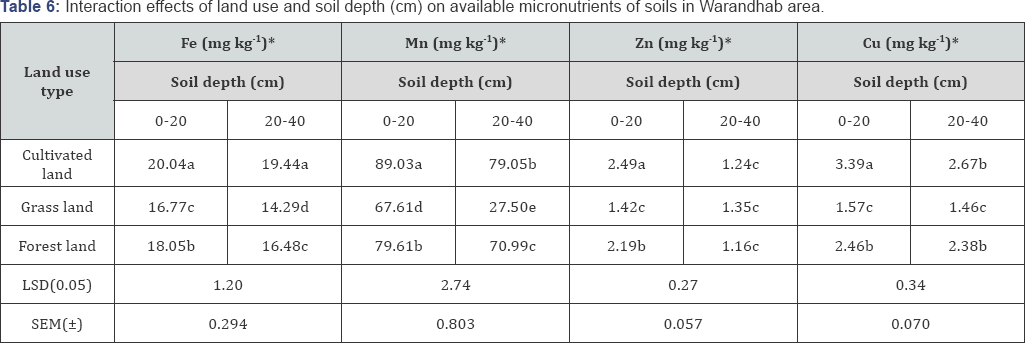
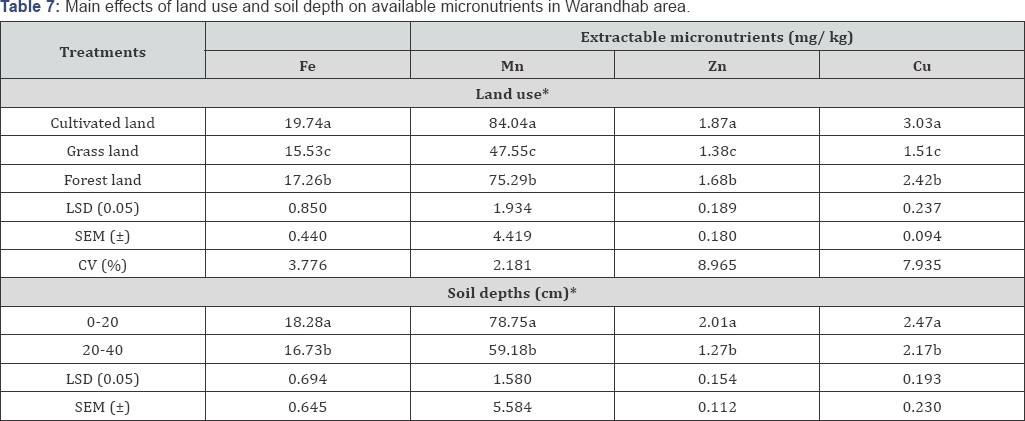
The contents of extractable micronutrients (Zn, Mn and Cu) were significantly (P ≤ 0.01) affected by the interaction of land use by soil depth (Table 6), while Fe was significantly (P ≤ 0.01) affected by land use and soil depth, but not significantly (P > 0.05) affected by the interaction of land use with soil depth (Table 7). As to the ratings of Sims and Johnson the critical level of soil available (DTPA extractable) Fe, Cu, and Mn are 2.5-4.5, 0.1-2.5 and 1-50 mg/kg, respectively. Therefore, the soil contents of extractable micronutrients in all land use types with depth were above the critical levels indicating that there is no deficiency of these micronutrients in the study area (Table 6). According to the report of Alemayehu and Sheleme [29]; Wasihun et al. [40] in that micronutrient status was significantly influenced by different land use systems and soil depth. Accordingly, the contents of all these micronutrients were higher at the surface (0-20 cm) layer than in the subsoil layer of all land use types (Tables 6 & 7). This is due to the lower contents of exchangeable bases in the surface layer which is decreased as the result of leaching. In study conducted by Wasihun et al. [40] at Itang-Kir Area of Gambella Region, Ethiopia, higher extractable micronutrient cations (Fe, Mn, Zn and Cu) were available in grazing land use compared to cultivated land. Laiho et al. [65] also studied the variability in extractable micronutrient (Fe, Mn and Zn) within floristically defined peat land sites. Considering the main effects of land use, the highest contents of Fe (19.74mg/kg), Mn (84.04 mg/kg), Zn (1.87 mg/kg), and Cu (3.03 mg/kg) were recorded under the cultivated land, while the lowest Fe (15.53mg/kg), Mn (47.55 mg/kg), Zn (1.38 mg/kg), and Cu (1.51 mg/kg) were observed under the grass land (Table 7). *Main effect means within a column followed by the same letter are not significantly different from each other at p ≤ 0.05 LSD = least significant difference; SEM = standard error of the mean; CV = coefficient of variation.
Conclusion
The result of this finding suggests that the textural class of cultivated and grass land were clayey, whereas it was clay loam for forest land. The mean bulk density value of cultivated land was significantly greater than the value in the forest and grass land. Soil water content were highly significantly affected by land use and soil depth whereas the mean exchangeable Mg and K content of the soil were highly significantly affected by land use but not by soil depth. On the other hand, Ca was not affected by both land use and soil depth. The mean value of exchangeable Na, K, Ca and Mg were relatively lower in the surface and higher in the subsurface soil layers of cultivated and forest lands, respectively. The value of exchangeable bases relatively increases with soil depth. The mean CEC content of the soil were highly significantly affected by both land use and soil depth. However, it was greater in the surface grass land and lower in subsurface cultivated land. The values of available Fe, Zn and Cu observed were highly significantly affected by land use and soil depth while the mean value of available Mn was highly significantly affected by land use but not with soil depth.
Acknowledgment
First of all, we would like to express our gratitude to the School of the whole Natural Resource Management and Environmental Science, Soil Science Section of Haramaya University. The staff of Nekemte Soil Laboratory Center and Holetta Agricultural research Center all soil laboratory team members, are highly acknowledged for their open and genuine approach and their kindness in allowing using resources of the center and laboratory analysis for this study.
References
- Griffiths BS, Ball BC and Bohanec M (2010) Integrating soil quality changes to arable agricultural systems following organic matter addition, or adoption of a ley-arable rotation. Appl Soil Ecol 46(1): 4353.
- Jansen DM JJ, Stoorvogel, RA Shipper (1995) Using sustainability indicators in agricultural land use analysis: An example from Costa Rica. Neth J Agr Sci 43(1): 61-82.
- Sun B, Zhou SL, Zhao (2003) Evaluation of spatial and temporal changes of soil quality based on geostatistical analysis in the hill region of subtropical China. Geoderma 115: 85-99.
- Qi YBJL, Darilek (2009) Evaluating soil quality indices in an agricultural region of Jiangsu Province, China. Geodema 149: 325-334.
- Liu XL, YQHe HL, Zhang (2010) Impact of land use and soil fertility on distributions of soil aggregate fractions and some nutrients. Pedosphere 20: 666-673.
- Asrat A (1992) Assessment of runoff and soil loss under different cover crops and slope lengths. pp. 45-50.
- Belay S (2003) Integrated watershed management approach to sustainable land management (Experience of SARDP in East Gojjam and South Wollo pp.127-136.
- Hurni H (1988) Degradation and conservation of the resources in the Ethiopian highlands. Mountain Research and Development 8 (3): 123130.
- Solomon D J, Lehmann M, Tekalign F, (2002) Phosphorus forms and dynamics as influenced by land use changes in the sub-humid Ethiopian highlands. Geoderma 105: 21-48.
- Mulugeta L (2004) Effects of land use changes on soil quality and native flora degradation and restoration in the highlands of Ethiopia:Implication for sustainable land management. PhD Thesis Presented to Swedish University of Agricultural Sciences, pp. 64.
- Smith CJ, G Goh (1995) Effects of organic and inorganic calcium compounds on soil solution pH and Al concentration. European Journal of Soil Science 46: 53-63.
- Cotrufo F, Conant R and K Paustian (2011) Soil organic matter dynamics: land use, management and global change. Plant Soil 338: 1-3.
- Post W, Kwon (2000) Soil carbon sequestration and land-use change: processes and potentials. Global Change Biology 6(3): 317-327.
- Sanchez M, Soriano G, Delgado R (2002) Soil quality in Mediterranean mountain environments: effects of land use change. Soil Sci Soc Am J 66: 948-958.
- Powers JS, Read JS( 2004) Estimating soil carbon fluxes following land- cover change: a test of some critical assumptions for a region in Costa Rica. Global Change Biology 10(21): 170-181.
- . Genxu W M, Haiyan (2004) Impact of land use changes on soil carbon, nitrogen and phosphorus and water pollution in an arid region of northwest China. Soil Use and Management 20(1):32-39.
- Day PR (1965) Hydrometer method of particle size analysis. pp. 562563. In: C.A. Black (eds), Methods of soil analysis. Agron, India.
- Black CA, (1965) Methods of soil analysis. Part I, American Society of Agronomy. Madison, Wisconsin, USA, pp. 1572.
- Peach M (1965) Hydrogen ion activity: In "Methods of soil analysis.” pp. 374-390
- Walkley A, Black (1934) An examination of the Degtjareff method for determining soil organic matter and a proposed modification of the chromic acid titration method. Soil Sci 37: 29-38.
- Sahlemedhin S, Taye (2000) Procrdures for soil and plant anlysis. National Soil Research Centre, Ethiopian Agricultural Research Organization, Ethiopia, pp.110.
- Olsen SR CV, Cole FS, Watanable L, Dean (1954) Estimation of avariable phosphorus in soil by extraction with sodium bicarbonate. USDA Circular 939: 1-19.
- Thomas,GW (1990) Exchangeable cations. In: Methods of soil analysis 17 (1): 9-16.
- Chapman HD (1965) Cation exchange capacity. In: CA Black LE Ensminger and FE pp. 1569.
- McLean EO (1965) Aluminum Methods of Soil Analysis. Agron Wisconsin, USA 102(2): 978-998.
- SAS (Statistical Analysis System) Institute (1996) The SAS system for windows, version SAS Institute Inc Cary NC, USA.
- Shiferaw Bole (2004) Soil phosphorous fractions influenced by different cropping system in Andosols and Nitisols in Kambata- Tenbaro and Wolaita Zones, SNNPRS, Ethiopia. MSc Thesis Submitted to School of Graduate Studies, Alemaya University, Ethiopia, pp. 126.
- Alemayehu K (2013) Effects of different land use systems on selected soil properties in South Ethiopia. J. Soil Sci. and Env Man 5: 100-107.
- Boke S (2004) Soil phosphorus fractions as influenced by different cropping systems in Andosols and Nitosols in Kembata-Tembaro and Wolayta Zones, pp. 131.
- Buol SW (1997) Soil genesis and classification. The Iowa State University Press, Ammes pp. 360.
- Agoume V, Birang (2009) Impact of Land-use Systems on some Physical and Chemical Soil Properties of an Oxisol in the Humid Forest Zone of Southern Cameroon. Tropicultura 27: 15-20.
- Gebeyaw (2015) Assessment of Soil Fertility Variation in Different Land Uses and Management Practices in Maybar Watershed, South Wollo Zone, North Ethiopia. International Journal of Environmental Bioremediation & Biodegradation 1: 15-22.
- Jaiyeoba I (2001) Soil rehabilitation through afforestation: Evaluation of the performance of eucalyptus and pine plantations in a Nigerian savanna environment 12: 183-194.
- VoundiNkana JC, J Tonye (2002) Assessment of certain soil properties related to different land-use systems in the Kaya watershed of the humid forest zone of Cameroon. Land Degradation and Development 1 4(1).
- Shepherd G, Bureh (2000) Land use affects the distribution of soil inorganic nitrogen in smallholder production systems in Kenya. Biology and Fertility of Soil 31: 348-355.
- Celik (2005) Land-use effects on organic matter and physical properties of soil in a southern Mediterranean highland of Turkey. Soil Tillage Res 83: 270-277.
- Wakene (2001) Assessment of important physicochemical properties of DystricUdalf (DystricNitosols) under different management systems in Bako area, western Ethiopia. MSc Thesis Submitted to School of Graduate Studies, Alemaya University, Ethiopia, p. 93
- Ahmed H, (2002) Assessment of spatial variability of some physicochemical properties of soils under different elevations and land use systems in the western slopes of Mount Chilalo, Arsi. MSc Thesis Submitted to the School of Graduate Studies, Alemaya University, Ethiopia, pp. 111.
- Beernaert (1990) Simple and practical methods to evaluate analytical data of soil profiles. Maputo, Mozambique 3(2): 123-125.
- Neris Jiménez (2012 ) Vegetation and land-use effects on soil properties and water infiltration of Andisols in Tenerife 98: 55-62.
- Offiong, Iwara (2009) Effects of Land Use Change on Soil PhysicoChemical Properties in a South-Southern Nigeria. African Journal of environment, Pollution and Health 7: 47-51.
- Fu B L, Che (2000) The relationships between land use and soil conditions in the hilly area of the loess plateau in northern Shaanxi, China. Catena 39: 69-78.
- Gol (2009) Effects of Land Use Change on Soil Properties and Organic Carbon at Dagdami River Catchment in Turkey. Journal of Environmental Biology 30: 825-830.
- Wasihun M, Muktar (2015) Evaluation of the Effect of Land Use Types on Selected Soil Physico-Chemical Properties in Itang-Kir Area of Gambella Region, Ethiopia. Journal of Biology, Agriculture and Healthcare 11: 2224-3208.
- ZhaoQ, Zeng (2008) Effect of Land Cover Change on Soil Phosphorus Fractions in SoutheasternHorqin Sandy Land, Northern China Pedosphere 18: 741-748.
- Tamirat T (1992) Vertisols of the Central Highlands, Ethiopia - Characterization, Classification, and Evaluation, of the Phosphorus status.
- Nega E, Heluf (2013) Effect of land use changes and soil depth on soil organic matter, total nitrogen and available phosphorus contents of soils in Senbat watershed, western Ethiopia. ARPN Journal of Agricultural and Biological Science 8 (3): 1990-6145.
- Brady N, Weil (2002) The nature and properties of soils. (13th edn), The Iowa state, India.
- Berhanu D (1980) The physical criteria and their rating proposed for land evaluation in the highland region of Ethiopia. Land use planning and regulatory department, MoA, Addis Ababa, Ethiopia 8(3): 19906145.
- Uriost A, Hevia (2006) Cultivation effects on the distribution of organic carbon, total nitrogen and phosphorus in soils of the semiarid region of Argentinian Pampas. Geoderma 136: 621-630.
- Eylachew Z (1999) Selected physical, chemical and mineralogical characteristics of major soils occurring in Chercher highlands, eastern Ethiopia. Ethio J Natu Resource 2: 173-185.
- Dawit S, F Fritzsche, M Tekalign, J Lehmann, W Zech (2002) Soil organic matter composition in the sub-humid Ethiopian highlands as influenced by deforestation and agricultural management. Soil Sci Soc Am J 66: 68-82.
- Malo DD, Schumacher TE, JJ Doolittle (2005) Long-term cultivation impacts on selected soil properties in the northern Great Plains. Soil Tillage Res 81: 277-291.
- Ukaegbu EP, For Akamigbo (2005) Influence of Physiography on the Properties and Use of Soils of the Cross River Plain: A Case Study of a Strip of Land at Isiagu, Ebonyi State. In Proceedings 29th Ann Conf Soil Sc Soc, Nigeria pp. 103-109.
- Iwara AI, Ewa EE, Ogundele FO, Adeyemi JA, CA Out (2011) Ameliorating Effects of Palm Oil Mill Effluent on the Physical and Chemical Properties of Soil in Ugep, Cross River State, South-Southern Nigeria. International Journal of Applied Science and Technology 1: 106-112.
- Yihenew G (2002) Selected chemical and physical characteristics of soils Adet Research Center and its Testing Sites in North-Western Ethiopia. Ethiopian Journal of Natural Resources 4: 199-215.
- Van der Eijk D, BH Janssen, O Oenema (2006) Initial and residual effects of fertilizer phosphorus on soil phosphorus and maize yields on phosphorus fixing soils A case study in south-west Kenya. Agric Ecosys Environ 116: 104-120.
- Ekukinam UE (2010) Effects of Rubber (Heveabrasiliensis) Monoculture Cultivation on Variations in Soil Fertility. Unpublished M.Sc. Thesis, University of Ibadan, Nigeria.
- Landon JR (1991) Booker tropical soil manual: A Handbook for Soil Survey and Agricultural Land Evaluation in the Tropics and Subtropics. Longman Scientific and Technical, Essex, New York, USA, pp. 1-474.
- Wang J, B Fu, Y Qiu, L Chen (2001) Soil nutrients in relation to land use and landscape position in the semi-arid small catchment on the loess plateau in China. J Arid Environ 48: 537-550.
- FAO (Food and Agriculture Organization) (2006a) Plant nutrition for food security: A guide for integrated nutrient management. FAO, Fertilizer and Plant Nutrition Bulletin 16. FAO, Rome, Italy
- Negassa W (2001) Assessment of Important Physicochemical Properties of Nitosols under Different Management Systems in Bako Area, Western Ethiopia. M.Sc. Thesis, Alemaya University, Alemaya, Africa, p. 109.
- Mesfin A (1998) Nature and management of Ethiopian soils. Alemaya University of Agriculture, Ethiopia ILRI, Addis Ababa 2(4).
- Reid G, J Dirou (2004) How to Interpret Your Soil Test.
- Laiho R, Penttila T, J Laine (2004) Variation in soil nutrient concentrations and bulk density within peatl and forest sites. Silva Fennica 38: 29-41.


