The Effect of Encroachment on Ecosystem Services Provided By the Owabi Wetland and Wildlife
Ameyaw Y* and Dapaah GS
Department of Biology Education, University of Education, Africa
Submission: July 31, 2017; Published: August 08, 2017
*Corresponding author: Yaw Ameyaw, University of Education, Winneba, Biology and Herbal Medicine, Ghana, Africa, Tel: 233(0)243156647; Email: syameyaw@yahoo.com
How to cite this article: Ameyaw Y, Dapaah G.The Effect of Encroachment on Ecosystem Services Provided By the Owabi Wetland and Wildlife. Int J Environ Sci Nat Res. 2017;4(1): 555628. DOI: 10.19080/IJESNR.2017.04.555628
Abstract
Farming activities, continued sand winning operations, and the allocation of plots of land to prospective developers in and around the catchments of the Owabi Dam pose a serious threat to the forest covers and the lifespan of the dam. This study sought to investigate the effects of encroachment on the ecosystem services provided by the Owabi wetland and wildlife in the Ashanti Region of Ghana. The Owabi catchment was specifically acquired for the production of potable water for Kumasi and its environs in the Ashanti Region, Ghana. Fifty (50) community members answered the questionnaire and at the same time were interviewed. The data gathered was analyzed using SPSS version 16.0 to convert them into graphs and tables. They were analyzed for various physicochemical parameters and bacteriological indicators using the World Health Organization (WHO) standard methods.
Physical parameters such as pH, turbidity, colour, free and total chlorine were also investigated. The results obtained showed that the pH values ranged from 6.4 to 7.9. Most of the individual turbidity values read were above the Ghana Standards Board and WHO permissible limit of 5.0 NTU. All the water samples showed temperature and free chlorine above the WHO permissible limits. We recommend to the GWCL to form a patrol team to help in protecting the Owabi dam from encroachment. Again, both stakeholder institutions and the surrounding communities should also ensure the protection of the water body from human interference.
Keywords: Encroachment; Ecosystem; Owabi; Wetland; Wildlife
Introduction
Ecosystem services have been defined as the benefits to humans from nature or, direct and indirect contributions of ecosystems to human wellbeing. For the purposes of accounting, ecosystem services have been distinguished further as those that can be turned directly into benefits (called 'final ecosystem services’) and those that support other services (called 'intermediate ecosystem service’). While still far from perfect, these distinctions are increasingly gaining acceptance in assessment processes around the world Maynard, James and Davidson 2010.
Humankind benefits from a multitude of resources and processes that are supplied by ecosystems. Collectively, these benefits are known as ecosystem services and include products like clean drinking water and processes such as the decomposition of wastes. Scientists and Environmentalists have discussed ecosystem services for decades, these services were popularized and their definitions formalized by the United Nations (2005) Millennium Ecosystem Assessment (MA), a four-year study involving more than 1,300 scientists worldwide. They grouped ecosystem services into four broad categories: provisioning, such as the production of food and water; regulating, such as the control of climate and disease; supporting, such as nutrient cycles and crop pollination; and cultural, such as spiritual and recreational benefits.
Ecosystems are complex interactions among living and nonliving components of the environment (e.g forests, grasslands, marine ecosystems). These interactions mediate processes that achieve major transformations of resources, many rivaling or exceeding what can be cost effectively achieved by humans (e.g regulation of atmospheric gases, large scale filtration and purification of water). These transformations (ecosystem services) support and enrich human life, but are often overlooked in decision making because decision makers lack information about them, and they (mostly) are outside economic markets and have not had an economic value attached to them limited, but also that they are threatened by human activities. The need to better consider long-term ecosystem health and its role in enabling human habitation and economic activity is urgent. To help inform decision-makers, many ecosystem services are being assigned economic values, often based on the cost of replacement with anthropogenic alternatives. The ongoing challenge of prescribing economic value to nature, for example through biodiversity banking, is prompting trans-disciplinary shifts in how we recognize and manage the environment, social responsibility, business opportunities, and our future as a species.
On a global basis, the aggregate value of the ecological services generated by wetlands has been estimated to be $4.9 trillion/year [1,2]. Reported that wetlands provide habitat for more aquatic, terrestrial, and avian species on an area basis than any other habitat type, making them one of the most ecologically and economically important ecosystems on earth. In fact, more than 35,000 rare plants and animals are found in wetlands in the U.S. alone [2]. Almost half of all federally threatened and endangered species rely on wetlands directly or indirectly during some stage of their life cycle, and all federally listed amphibians, fish, clam, and crustacean species depend on wetlands Nature Serve, 2003.
Coastal wetlands also serve as important nursery grounds for many recreationally and commercially important fish and shellfish, including shrimp. Some riparian and river in e wetlands in the Pacific Northwest are critical in the lifecycle of listed salmon runs. Wetlands often form the remaining structure of wildlife corridors and open space in urban watersheds. The corridor function can be degraded, as shown by direct and indirect wetland impacts that commonly occur in urban watersheds. As documented in Section 2, changes in wetland hydrology from upland development can have significant consequences on downstream aquatic species [3-5]. The supply of safe potable drinking water in Ghana is characterized by seasonal and persistent shortages. Such shortages are widespread, often the result of poor management of water resources, irregular rainfall patterns, prolonged drought and inefficient use of available technology Kumasi, 2007. To enable us to control the processes and to locate the points, and to improve our water resource, it is important to have a good knowledge about the quality of the water.
The importance of water as a resource to improve the social well-being of a people and for national development cannot be over emphasized. Fast urbanization and industrial development during the last few years have provoked some serious concerns for the environment. Excessive fertilization (eutrophication) is one of the most significant causes of water quality deterioration in lakes and reservoirs in many countries [6]. The concentrations of nitrogen and phosphorus are known to play a key role in determining the ecological status of aquatic systems Jarvie, 1998. These nutrients in excess may lead to diverse problems such as an increase in the occurrence and extent of algal blooms, loss of oxygen, taste and odour problems, fish deaths and loss of biodiversity. Nutrient enrichment seriously degrades aquatic ecosystems, impairing the use of water for drinking, industry, agriculture, recreation and other purposes [5].
Contamination of aquatic ecosystems with heavy metals has received much attention due to their toxicity, abundance, and persistence in the environment and subsequent accumulation in aquatic habitats Arnason & Fletcher [7]. Elevated levels of heavy metals in environmental compartments, such as aquatic sediments, may pose a risk to human health due to their transfer in aquatic media and uptake by living organisms, thereby entering the food chain. Heavy metals may enter a freshwater reservoir from a variety of sources, either natural or anthropogenic [8,9].
The driving forces of encroachment are believed to be diverse. The two key factors however, considered to be the driving forces for the encroachment of land are the demand for residential space and agricultural production [10]. The rapidly growing global population has resulted in the increased demand for land. However, the rapid growth of population and urbanization and the consequent pressure on land and water bodies are over the year's means that land is not so easily or readily available. Most urban lands are almost fully developed yet demand for land in these areas continues to be on the ascendancy.
It has been identified that three categories of indigenous strategies do advertently or inadvertently conserve biodiversity in Ghana. First, it can be used to protect particular ecosystem or habitats (such as sacred grooves, royal burial grounds, sacred rivers); secondly, to protect particular animal or plant species (such as totem and tabooed species); and lastly to regulate exploitation of natural resources (such as closed seasons for harvesting or hunting) [11]. Climate change, affluence and population growth have resulted in vast requirements of water for use in domestic, industrial and agricultural settings. There exists a growing demand for centralized systems of water delivery in urban local due to the continuing trend of population migration to larger cities. In these densely populated areas, the government (or a privately contracted company) has often installed the infrastructure necessary to deliver treated water. This type of potable piped water is necessary to ensure that all residents have convenient and continual access to a clean drinking water supply.
The importance of water as a resource to improve the social well-being of a people and for national development cannot be over emphasized. That is why the quality and quantity of water supplied to a community is crucial in determining their health status, standard of living and level of development [12]. According to [13], The Owabi catchment area had seen encroachment over the years, and it is still on-going. The site has been sub-divided, allocated and developed mostly for private residential and farming purposes. For example, out of the 4,134.5 acres of land acquired for the Owabi dam and its catchment, about a third of it that is 1,378.2 had been grossly encroached upon GWCL 2011.
The major problems identified that have necessitated the need for this study, and which pose a challenge to the management of the catchment area include the following:
a) Massive encroachment in the form of unauthorized development and illegal activities including farming and sand winning, which do not conform to the zoning of the area.
b) General disregard for building rules and regulations with some developments found very close to some of the major tributaries feeding the Owabi dam.
For this reason, it has been observed recently that the following activities have been taken place: illegal felling of trees, hunting, sand winning, dumping of residual waste, building and farming in and around the catchment of the wetland and the wildlife, which is against this background, that being investigated into to provide the management, and the needed strategies that can be used by the community, government agencies, stakeholders, GWCL to deal with the associated problems.
Therefore, this study is aimed at analyzing the goods and services provided by the wetland and wildlife in the Owabi catchment area. Again, the demand for goods (products) and services (ecological functions) of wetlands and wildlife and their levels of exploitation, especially relating to the quality of water for drinking are investigated.
The following research questions were used for the study:
i. What anthropogenic activities promote rapid urbanization in the study area?
ii. What human activities impact the ability to provide goods and services?
iii. What type of goods and services do the surrounding inhabitants derive from the wetland and wildlife?
iv. What rules and regulations do traditional rulers have in protecting the area?
Methodology
The study area
The study area is bounded by the districts of Atwima, Kwabre and Kumasi Metro. Until the construction of the Barekese Dam in 1971, Owabi was the only source of water to Kumasi-Metropolitan. The Wildlife Sanctuary is the smallest of four Wildlife Protected areas in Ghana. It is 13 km2 in size, and lies approximately 23 km northwest of Kumasi. It has an inner Sanctuary of about 7 km, which surrounds a lake, formed by the damming of the Owabi River in 1928. The Wetland/Ramsar site was designated on 22nd February 1988 with Ramsar site number 393 Forestry Commission of Ghana [9] (Figure 1). It is also the only inland Ramsar Site in Ghana. The reservoir is designed to produce 20% of the total potable water requirement in the Kumasi metropolis and nearby villages. The stream which serves as a reservoir has been encroached with various human activities due to the high population density within the catchment area.
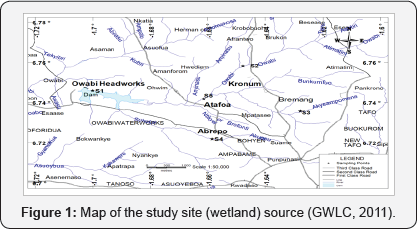
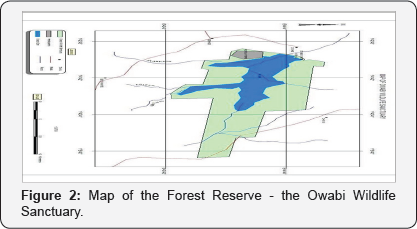
The study involved 10 communities. Semi-structured questionnaire was administered to the respondent to find out their level of knowledge about their communities in order to protect or manage the ecosystem services provided by the available resources. Another semi-structured questionnaire was used to assess the following government agencies: Forest Service Division and Wildlife, and Environmental Protection Agency, District Assembly, and Owabi Water works Source: Game and Wildlife Department (2011) Owabi can be described as a secondary forest that surrounds a large water reservoir and a Wildlife Sanctuary (Figure 2). Owabi forest reserve is located between latitudes 6° 47" 3.32" -- 6° 41" 52.31" N and longitudes 1° 44" 0.81" -- 1° 37" 53.04" W of Kumasi in Ashanti region. It is one of the smallest forest conservation areas in Ghana National Wetlands Conservation Strategy 1999. Responsibility for protection of the reserve forest was turned over to the Department of Game and Wildlife in the early 1960"s when the lands were designated a Wildlife Sanctuary. Despite its status as a wildlife refuge, poaching is not uncommon. There are well-worn footpaths throughout Sanctuary which is an ample evidence of human encroachment from the outer boundaries of the reserve. Although the forest is far from pristine, large sections remain mostly intact Forestry Commission of Ghana 2006.
Vegetation
Owabi forest reserve can best be described as a secondary forest surrounding a large water reservoir. It has a beautiful plantation of an exotic species, and Cassia siamea covers an area of about 10% land. The rest of the area is covered with small bushes and other riverine forest and aquatic vegetation. The sanctuary is a home to many species of plants and animals especially reptiles and snakes. About 199 species of vascular plants had been identified. These include 91 tree, 19 shrub, 40 herb, 14 grass, 1 parasite, 6 ferns, and 29 climber species Forestry Commission of Ghana 2006. It is a tranquil site with a great variety of birdlife and fascinating forest walks. It is an ideal place for winter migratory birds and hundreds of Mona Monkeys.
Geology and Soil
The geology of both catchments is dominated by granites and granodiorites of the Birimian Series. The occurrence of groundwater is controlled by jointing and fracturing of the local rocks, while the granites, due to their highly-weathered condition, produce some of the most productive groundwater bodies Ministry of Works and Housing, 1998. The geographical catchment covers the entire area which forms the river basin of the Owabi dam. Some important areas within the geographical catchment of the Owabi basin include Bremang, Atimatim, Afrancho, Suame Magazine, Kronum, Pankronu, Tafo, Ahwia, etc. Many steams drain the catchment area of the Owabi reservoir River Owabi which is the main stream in the catchment flows through agricultural lands close to the village of Maase, upstream of Kumasi. Some of the streams are River Sukobri, Akyeampomene, Akonsu and Punpunase.
The Owabi Reservoir
The Owabi reservoir is designed to produce 20% of the total portable water requirement in the Kumasi metropolis and nearby villages. The rivers which serve the Owabi reservoir have been encroached with various human activities due to the high population density within the catchment area. The major source of water in the owabi reservoir is River Owabi which flows through agricultural land close to the village of Maase, upstream of Kumasi; other sources are Akyeampomene, Akonsu and Punpunase. River Owabi joins other tributaries from the urban area at Atafoa, a rapidly-urbanizing agricultural village [14]. Another main source of the water in the Owabi reservoir is River Akyeampomene which flows through Breman and Suame Townships. Four sampling sites from different community locations were chosen; namely, Bremang, Abrepo Kuma, Atafoa, and the Owabi dam. A total of twelve samples were taken. Samples were collected into sterile screw capped plastic containers.
Treatment 0f Sample Container
Prior to sample collection, all bottles were washed with dilute nitric acid followed by distilled water and were air dried in an oven and labeled with dates and sampling source. Collected water samples were stored in a cooler at 400C. Temperature, conductivity and pH of samples were measured on site using standard methods according to [15]. The water was taken to the Owabi Head Works laboratory of the Ghana Water Company for the testing of ammonia, nitrates, phosphates, sulphates and heavy metals such as iron, Copper, Zinc, Aluminum, Manganese, and Chromium were all analyzed using Palin test photometer methods as described by [6] with slight modification.
Sampling Frequency
Samples were taken in triplicates and the averages of each result were taken for the analysis. Water samples were fetched directly from the water source. Gloves were used to prevent finger prints or contamination. Water samples were collected from sites of all the sources at monthly intervals for a period of four months from June 2014 to September 2014. Triplicate samples were taken for each at every sampling period. A total of twelve (12) samples were taken each month for analysis in this study. Water samples were collected in the morning between the hours of 8:00GMT and 11:00GMT. The water samples were analyzed for the following: pH, colour, temperature, turbidity, electrical conductivity, nitrate, nitrite, phosphate, and Total Dissolved Salts. Instruments used to collect data were questionnaire, field observation, as well as interviews for the respondents.
First-hand collected raw data was entered in statistical software called Statistical Package for the Social Sciences, Microsoft excel 2007, Frequencies, standard deviations, mean were calculated and presented in the form of pie and bar charts, tables, and photographs. This research utilizes qualitative research methods in the form of semi-structured interviews and incorporates transect walks, a Participatory Rural Appraisal (PRA) technique to investigate how sources of drinking water are impacted by urban land use. The Participatory Rural Appraisal techniques are useful and effective tools for exploring local issues in a rapid and cost-effective manner. Though either method could be used as a stand-alone for data collection, the use of both methods was necessary because research that combines methods enhances the researcher's ability to address the research questions than using either approach exclusively Creswell and Clark 2006.
Moreover, transect walks complemented the semi- structured interviews, gave detailed information, and made the final results a true representation of conditions on the ground. In addition, the mixed method approach (i.e., interviews and transect walk) was used because of the benefit of collaboration. Conclusions reached at the end of this research will be more accurate if data gathered through transect walks about the impact of urban land use on sources of other writings were of help to enable the research come out with the uniqueness of the current situation of the Interview Questions. Different questions were structured for the household level and government officials. For government officials, the departments included in the study have different objectives and influences within the district; therefore, the questions were diverse. However, in general, the questions for the interviews were designed to elicit relevant information pertaining to land uses affecting water resources in the city. The questions therefore explored land use regulations and measures in place to control nonconforming land uses. They also explored waste management, the capacity to manage waste, and water contamination and its controls. In addition, they focused on the impacts of land use, on the Ghana Water Company's reservoir in Kumasi and any implications this has for water treatment and supply.
At the household level, questions explored residents' perception about how land use impacts waterways. Additionally, questions explored water supply challenges, water scarcity, and coping mechanisms adopted by residents to overcome water supply challenges.
Results
This chapter presents the data collected of samples to assess some physicochemical parameters governing water quality due to human activities in the study of the effects of encroachment on the ecosystem services provided by the Owabi wetland and wildlife. The parameters investigated include pH, colour, turbidity, temperature, nitrate, nitrate, conductivity and Total Dissolved Salts. The research used SPSS version 16.0 and Microsoft Excel 2013 for analyzing the data collected. Descriptive statistics, statistically significant tests and charts are drawn for the variables considered.
pH of Samples
pH is one of the most important determinants of manning operations in water quality. The closer the pH gets to one (1), the more acidic the water becomes. The standard limit of the pH of water used is 6.5-8.5. The results obtained showed that the pH values ranged from 6.4 observed from Breman and a maximum of 7.9 also observed at Breman. There were however no significant variations during the period of study as shown in Table 1 with the p-value of 0.826. Although there were some observed samples outside the recommended standard limit, all the average values were within range. International standards for drinking water suggest that pH less than 6.5 or greater than 8.5 would impair the portability of the water.

Apparent Colour
Colour in drinking water is usually due to the presence of coloured organic matter associated with the humus fraction of soil, aquatic plants, organic matter such as humus, peat or decaying plant matter. Coloured water to an aesthetically displeasing degree is unacceptable and difficult to use even for other uses than drinking purposes, hence, it is desirable that water should be colourless. The average colour recordings are given in (Table 2) with the highest average recorded at Atafoa. There were also no significant differences in the average apparent colour recordings among the four sites as shown in Table 2 with the p-value of 0.820. This means that in spite of the difference in the observed means for the different sites, the differences were not significant and observed trends were similar for all the four sites.

Temperature of Samples
Temperature is an important environmental variable because specific organisms have definite ranges of temperature at which maximum growth and reproduction occurs. The investigation of temperature ranges showed that the overall minimum range of 23.4oC observed at Abrepo and a maximum range of 27.2 oC was observed at Owabi, Atafoa and Abrepo. Similar to the colour, the temperature recordings obtained in the four regions showed no significant variation because calculated p-value was 0.887065 as shown in Table 3.
Turbidity
Turbidity measurements ranged from 2.7 NTU observed at Owabi to as high as 50.5 NTU which was observed at Breman. Most of the individual turbidity values read were above the Ghana Standards Board and WHO permissible limit of 5.0 NTU. Table 4 shows that these differences observed in the average p-value of 0.565 is conclusive on the nature of the differences in turbidity values were not however significantly different. The the average turbidity values recorded.


Electrical Conductivity
The analysis of the variation in the mean electrical conductivity property of Water gave a p-value of 0.278647,which is greater than a significant level of 0.05, implying that there is no significant variation among the mean electrical conductivity recordings made irrespective of the differences in their respective averages (Table 5).

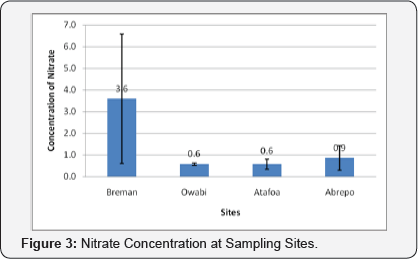
The nitrate and nitrite concentrations were also investigated at the four sites and the results are as shown in Figures 3 & 4. The nitrate concentration varies greatly among the various sites with Breman leading with a mean concentration of 3.6. But the analysis of variance shows that there is no significant variation in mean Nitrate concentration among the sites (Table 6).

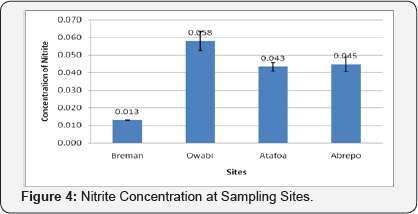
Similar to the Nitrate concentration, the mean nitrite concentration recorded from the various sites varies with Owabi leading with a concentration of 0.058 as shown in Figure 4. In an overall consideration, the p-value of 0.784533 is greater than 0.05, which implies no significant variation among the mean nitrite concentrations recorded (Table 7). The mean phosphate concentration recorded from the various sites varies with Owabi leading with a concentration of 0.058 as shown in Figure 5. Phosphate concentration recorded show a significant variation in mean among the various sites, the analysis made on the data recorded yields a p-value of 9.84E-05, this value is less than the permissible significance level of 0.05, implying a significant variation in the mean phosphate concentrations (Table 8).


Total Dissolved Salts (TDS)
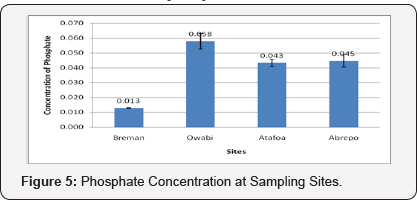
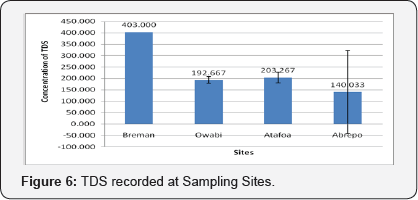
Total dissolved solids for the samples collected averaged between 140.33mg/L to 403.00mg/L as shown in Figure6. This means the TDS varied widely between the sites investigated. The sources of TDS in drinking water are normally attributed to natural sources, domestic wastewaters, municipal runoffs and industrial wastewaters. The data collected indicated that the TDS observed were below the 1000mg/L acceptable mark.
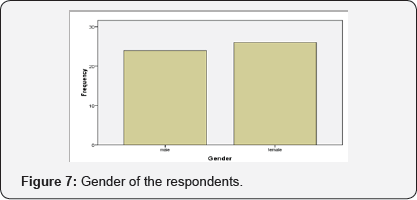
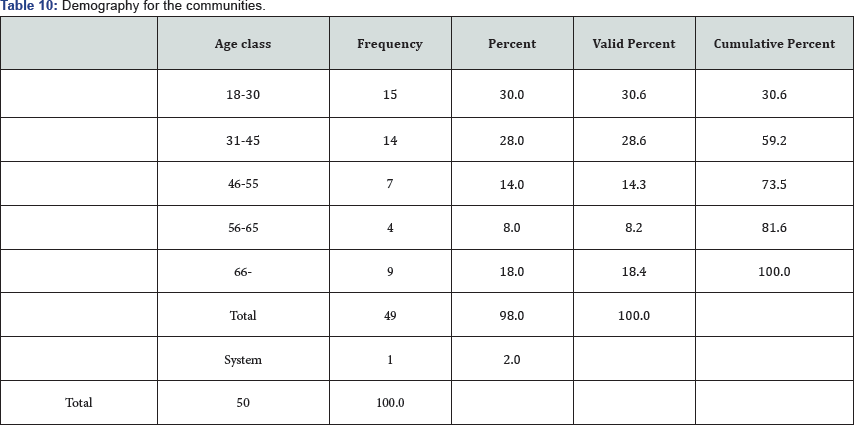
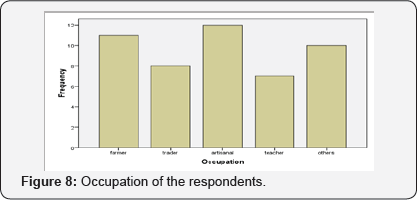
There is a significant variation in mean amount of salt dissolved in the water. A p-value of 0.036649 indicates that the observed differences at the various sites were significantly different although all were below the acceptable mark as indicated in Table 9. Out of the 50 respondents, 48.0% were male and 52.0% were female (Figure 7). The majority of the respondents were between 18-30 years (30.0%) and 8% between the ages of 56-65 years. The details of the age structure have as has been presented in Table 10. The major occupation of the respondent were artisanal with 24.0% and the minority were teachers with 14.0%, whilst, 22.0% were farmers, 16.0% were traders, and 20.0% were categorized under different kinds of work and 4.0% stated emphatically that they were unemployed (Table 10).

Also, the encroachment was in different forms. They include buildings, farming, and sand winning, timber logging, and fishing by private individuals. However, the most common forms are building developments mostly concentrated in the Abrepo, Kokoso, Nyankyerenease and Ohwim portions of the statutory catchment. The area is also noted for sand winning activities mainly at Bokankye and Nyankyerenease. These activities have resulted in the clearing of the forest and vegetative cover that protect the Owabi River and this promotes siltation as well as rapid evaporation of the water in the dam from the intense sun thereby threatening the lifespan of the dam.
They have different kinds of occupation as shown in Figure 8. The logging of trees and bush clearing of the catchment area has paved ways for sand winning. All of these have resulted in a large part of the catchment being encroached upon. What is going on in the reserve is a recipe for disaster and poses a challenge to the continuous supply of enough quality water for the ever growing population of the metropolis. The worst encroached parts are in the southern and eastern portions of the catchment within the communities of Kokoso, Abrepo, Nyankyerenease and Ohwim which all fall within Kumasi Metropolitan Assembly.
Results of shareholders of the Owabi catchment
Different statutory bodies and private organizations have been mandated by law to see to the management of the Owabi Catchment area. These bodies play different roles and complement one another towards the effective and efficient management of the area. Ghana Water Company Limited is the main institution charged with the proper management of the reservoir as well as the catchment. However, other organizations that play supporting roles in the management of the catchment include Lands Commission, Town and Country Department,Kumasi Metropolitan Assembly, Atwima Nwabiagya District Assembly, Game and Wildlife Department, and the Environmental Protection Agency.
Ghana Water Company Limited (GWCL)
Ghana Water Company Limited is a quasi-government institution which is responsible for the supply of safe drinking water through its network of pipes within the urban areas. In providing potable water for the people of Kumasi, the Company makes use of the Barekese and Owabi Dams. In the case of Owabi catchment area, the Company is responsible for its operation and maintenance as well as the sustenance of the area by ensuring the continuous presence of vegetative and forest cover. Encroachment of the area by private land developers has however been a major problem faced by GWCL in the management of the catchment. According to GWCL, encroachment has reduced the water level of the dam through evaporation since the streams that lead to the dam are all exposed to direct sunlight. It has also increased the cost of water production since more cost is incurred by way of acquiring "strong" chemicals to be used for the water treatment. The few security men patrolling the area to keep human activities on check are unable to cover the large area in the light of the High Court injunction order halting further demolition of developments in the catchment since 1998. More so, the Court's action has been misconstrued by the chiefs as a sign of victory, and a licence for further encroachment of the area.
Further, the Company’s legal division which deals with all legal issues across the country is based in Accra, and since the Regions do not have purposely created legal offices, all matters on legal issues were handled at the national level. This makes it difficult to deal with the legalities pertaining to the Owabi catchment area. For this reason, the power to stop, arrest and prosecute people for encroachment is weak, and now rests with the Environment Protection Agency
The Town and Country Planning Department
The Town and Country Planning Department is responsible for the proper planning of towns so as to ensure the optimum use of land. Throughout the years, the office has tried as much as possible to preserve the catchment area. Thus, when coming out with planning schemes/layouts for areas around the catchment, it does so in consultation with GWCL to ensure that portions that fall within the catchment are excluded. They also remind the public about the existence of the catchment, and whether or not they are within or outside the catchment.
Initially, the Department had the policy of leaving out certain areas in the geographical catchment such as Bremang, Abrepo, Atafua, Bohyen, Pankronu and the northern part of Tafo since the tributaries of the Owabi river flows through these towns. However, because of increasing population and demand for land, the Department has started coming out with schemes or plans in such a way that human activities along the Owabi River and other streams are reduced to the barest minimum.
Discussion
Organic Matter Accumulation
The Owabi reservoir is suffering from micro-organic activities resulting from the presence of large amounts of organic matter, which is rendering the water unhealthy and also making treatment difficult. Large amount of organic matter had resulted in large accumulation of micro-organisms that feed on the organic matter. The feeding behaviour of the organisms lead to the depletion of the amount of oxygen in the water, thus, rendering it unhealthy. Therefore, large quantities of chemicals are used to treat the water before consumption. Large quantities of chemicals are used to treat the water; therefore, chemical cost per cubic meter of water is very high as compared to Barekese Treatment Plant. This finding is similar to what [16-19] found in other urban areas of sub-Saharan Africa such as Nairobi in Kenya, Kampala in Uganda, Dar-es Salaam in Tanzania, and Lusaka in Zambia. They concluded that eutrophication is an increasing problem in sub-Saharan Africa, because it compromises the ecological integrity of surface water. When the ecological integrity is compromised not only does the water becomes hard to treat, but it also hampers aquatic life as oxygen levels become depleted.
Logging Activities
Logging for both firewood and lumber is also another activity that was noted during the transect walk. People illegally log timber within the riparian zone, depleting the vegetation cover which serves as a buffer, intercepting runoff speed by increasing infiltration and filtering runoff. Illegal felling of trees occurs along the banks of the river though not pronounced. The depletion of the riparian vegetation is not only due to estate development, but also illegal felling of trees. As a result of land use along the banks of the Owabi River and within the catchment area, the Owabi reservoir is suffering from the accumulation of sediments, which is gradually reducing the amount of water the reservoir can hold.
Environmental Protection Agency
The Environmental Protection Agency (EPA) was established by the Environmental Protection Agency Act, 1994 (Act 490) with regulatory and enforcement powers. Specifically, EPA ensures quality water monitoring in the Owabi Dam. Thus, EPA has a comprehensive water quality- monitoring program which is in place, and which among other things include monitoring of specific areas and activities and the Owabi catchment area is being monitored against housing developments and farming activities along the streams.
Game and Wildlife Department (GWD)
The work of the Game and Wildlife Department is the monitoring of the Owabi Wildlife sanctuary, which is approximately 13 km2 serves two fold purposes- the protection of migrant birds and the facilitation of water catchment by maintaining the forest cover for the dam to prevent excessive evaporation. Information from the Department reveals that the core area under their jurisdiction has not yet been affected by encroachment. However, their major problems include poaching in the forms of firewood collection, fishing in the dam and streams, and sometimes farming within the sanctuary.
Conclusion
The study found that land use is contributing to high cost of treatment of public water supply. In fact, it is costing GWCL about 36 percent more to treat a given quantity of water at the Owabi treatment plant location in an urban setting compared to the cost of treatment for the same amount of water treated at Barekese Dam, which is in a rural setting. Household effluents are channeled into the Owabi River; solid wastes are dumped in or on the banks of the river. These wastes are carried by runoff into the river and end up in the Owabi impoundment and therefore increase the amount of chemicals needed to treat raw water to render it potable. On the issue of household effluent polluting sources of water. Kurian & McCarney [15] argue that domestic wastewater constitutes the largest proportion of total wastewater generated and poses a serious threat to water supply sources, such as surface water and groundwater. The officials at the GWCL are concerned about the presence of heavy metals in the Owabi River and have yet to identify the source. Suame magazine, a heavy industrial area, is located within the watershed of the Owabi River, solid waste and liquid waste disposal in this location are not regulated and could be the source of the heavy metals in the Owabi River. Interviews at the household level found that communities believe that household solid wastes and effluent and fecal material can contaminate sources of water supply. However, such knowledge is not translated into practice except in the affluent.
Recommendations
The indirect impacts to wetlands have been produced by a great number of different academic disciplines that rarely interact with each other. Urban wetland research has been published by hydrologists, herpetologists, landscape ecologists, botanists, wildlife managers, conservation biologist, toxicologists, storm water engineers and wetland scientists. It is recommended that a national meeting be convened or a network be launched to improve communication. There must be a public education to all community members and its neighbourhood, especially, those within and around the catchment of the Owabi dam. GWCL and community members should be actively engaged in co-managing the resources under a regime of very clear responsibility for protecting them from exploitation.
Even though customs, regulations, and other traditions binding the Owabi dam, the GWCL should appoint patrols to help in protecting the resource as the Game and Wildlife is doing I must recommend them for their patrol. Local governments that wish to enact stronger local protection for wetlands and their functions can find a model ordinance to protect wetlands that are typically considered sensitive to storm water runoff. Restoration, protection of isolated wetlands and other vulnerable aquatic resources that may not be fully protected by laws, especially in light of recent Supreme Court decisions.
Acknowledgement
We thank the communities and various organizations involved in this research.
References
- Costanza R, dArge R, de Groot R, Farber S, Grasso M, et al. (1997) The Value of the World's Ecosystem Services and Natural Capital. Nature 387: 253-260.
- Comer P, K Goodin, A Tomaino, G Hammerson, G Kittel, et al. (2005) Biodiversity Values of Geographically Isolated Wetlands in the United States. NatureServe, Arlington, USA. p. 1-55.
- Carter V (1997) Technical Aspects of Wetlands: Wetland Hydrology, Water Quality, and Associated Functions. National Water Summary on Wetland Resources. US Geological Survey Water-Supply Paper 2425, USA.
- Owen C (1999) Hydrology and History: Land Use Changes and Ecological Responses in an Urban Wetland. Wetlands Ecology and Management 6(4): 209-219.
- Kercher S, Carpenter QJ, Zedler J (2004) Interrelationships of Hydrologic Disturbance, Reed Canary Grass (Phalaris arundinaces L.), and Native Plants in Wisconsin Wet Meadows. Natural Areas Journal 24: 316-325.
- Mutisya KD, Tole M (2010) The impact of irrigated agriculture on water quality of Rivers Kongoni and Sirmon, Ewaso Ng'iro North Basin, Kenya. Water Air Soil Pollut 213:145-149
- Varol M, Sen, B (2012) Assessment of nutrient and heavy metal contamination in surface water and sediment of the upper Trgris River. Turkey Cat p. 1-7.
- Adaikpoh EO, Nwajei GE, Ogala JE (2005) Heavy metals concentrations in coal and sediments from River Ekulu in Enugu, Coal City of Nigeria. J of Appl Sci and Environ. Management 9: 5-8.
- Akoto O, Bruce TN, Darko G (2008) Heavy metals pollution profiles in streams serving serving the Owabi reservoir. Afr J Environ. Sci. Technol 2(11): 354-359
- Walker R (2001) Urban sprawl and natural areas encroachment: linking land cover change and economic development in the Florida Everglades. Michigan State University, East Lansing, USA.
- Ntiamoa-Badu Y (2001) Indigenous Versus Introduced Biodiversity Conservation Strategies. The case of Protected Area Systems in Ghana. In W Weber, LJT White, A Vedder, L Naughton-Treves (eds.), African Rain Forest Ecology and Conservation. Island Press, Yale University, New York, USA, pp. 385-394.
- Falkenmark M, Lundqvist J, Widstrand C (1990) Coping with water scarcity: implications of biomass strategy for communities and policies. In: International Journal of Water Resources Development 6(1): 29-43.
- Chowdhury S (2003) Particle counting-a new method to evaluate the drinking water quality. Microscopic particles in drinking water. VA- Forsk Svenskt Vatten AB 1102-5638.
- Craun GF, Nwachuku N, Calderon RL, Craun MF (2002) Disease outbreaks in drinking water systems, 1991-1998. J Environ Health 65(1): 16-23.
- Kurian, Mathew, McCarney, (2010) Peri-urban water and sanitation services: Policy, planning, and method. Dordrecht, Springer, New York, USA.
- APHA, AWWA (1992) Standard Methods for the Examination of Water and Wastewater (18th Edn.). American Public Health Association,
- Nyenje PM, Foppen JW, Uhlenbrook S, Kulabako R, Muwanga A (2010) Eutrophication and nutrient release in urban areas of sub-Saharan Africa - A review. Science of the Total Environment 408(3): 447-455.
- Cook JA, Andrew SM, Johnson MS (1990) Lead, zinc, cadmium and fluoride in small mammals from contaminated grass-land established on fluorspar tailings. Water Air and Soil Pollution 51: 43-54.
- Costanza R, dArge R, de Groot R, Farber S, Grasso M, et al. (1997) The Value of the World's Ecosystem Services and Natural Capital. Nature 387: 253-260.


