Estimation of Design Flood Discharge for Kakkadavu Dam in Kariangode River Basin
Azhar Husain*
Department of Civil Engineering, Central University, India
Submission: July 03, 2017; Published: July 31, 2017
*Corresponding author: Azhar Husain, Department of Civil Engineering, Central University, India, Email: ahusain3@jmi.ac.in
How to cite this article: Azhar H.Estimation of Design Flood Discharge for Kakkadavu Dam in Kariangode River Basin. Int J Environ Sci Nat Res. 2017;4(1): 555626. DOI: 10.19080/IJESNR.2017.04.555626
Abstract
This paper describes the estimation of Design flood discharge for the Kakkadavu Dam sites in Kariangode River Basin. The Design flood discharge has been estimated for the Kakkadavu Dam site using the hydro-meteorological approach, the frequency analysis and the empirical formula. Using the Design flood discharge values, the risk of failure of structure during various construction periods has been computed and presented in the paper. A comparison of design flood discharge values at the site has also been made.
Keywords: Design Flood; Kakkadavu; Kariangode; Frequency
Introduction
In the design of hydraulic structures it is not practical from economic considerations to provide for the safety of the structure and the system at the maximum-possible flood in the catchments. Small structures such as culverts and storm drainage can be designed for less severe floods as the consequences of a higher-than design flood may not be very serious for such structures. On the other hand, storage structures such as dams demand greater attention to the magnitude of floods used in the design. The failure of these structures causes large loss of life and great property damage on the downstream of the structure. Therefore, it is clear that the type, importance of the structure and economic development of the surrounding area dictate the design criteria for choosing the flood magnitude.
Design flood is defined as the instantaneous peak discharge adopted for the design of a river headwork or control structure after accounting for the economic and hydrological factors. It is a flood that the project can sustain without any substantial damage, either to the objects which it protects or its own structures. The design flood used for the specific purpose of designing the spillway of a storage structure is called spillway design flood. This term is frequently used to denote the maximum discharge that can be passed over a spillway without any damage or serious threat to the stability of the structure. The standard project flood (SPF] is the flood that would result from a severe combination of meteorological and hydrological factors reasonably applicable to the region. Extremely rare combinations of factors are excluded in computing the SPF. That probable maximum flood (PMF] is the extreme flood that is physically possible in regions a result of most severe combinations including rare combinations of meteorological and hydrological factors.
The PMF is used in situations where a failure of the structure would result in loss of life and catastrophic damage and as such complete security from potential floods is sought. On the other hand, SPF is often used where the failure of a structure is likely to cause less severe damages. Standard techniques for flood estimation have been developed by most countries. These techniques generally include statistical methods based on the analysis of available gauged flood peaks, some kind of flood event modelling using rainfall-runoff techniques and, perhaps, the use of concepts such as the probable maximum flood. The frequency analysis approach for design flood estimation was first proposed by Eagleson [1].
It combines the probability density function of rainfall with a basin response function to obtain the flood frequency distribution. McKerchar and Macky [2] compared design flood estimates from flood frequency analysis of six catchments to estimates from regional flood frequency analysis and a design storm approach. They concluded that design flood estimates generated by design storm methods often tend to be too large with differences of more than100% compared to other estimates. Similarly Gutknecht etal. [3] concluded in an Austrian case study that design floods from the design storm approach yield larger results than estimates from flood frequency statistics and regional methods for very low probability floods (return period of (5000-years). A review of flood frequency analysis is found in Bobe'e and Rasmussen [4].
Study Area

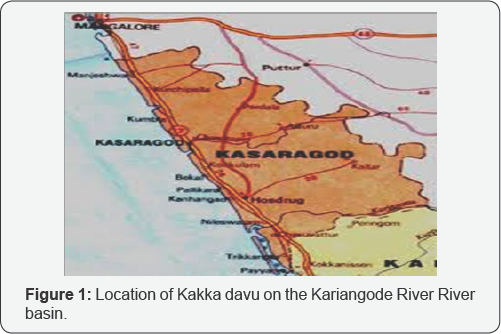
The irrigation Department, Government of Kerala had proposed to construct a dam of 56 m height at Kakkadavu across Kariangode River to provide irrigation to 12196 Hectare lying b/w Kapum and Neeleswer River and 1770 hectare in Hosdrug Taluk lying on the Neeleswer basin. The dam will also provide water supply to Chennai and adjoining villages in Kariangode, Kannur district and also to naval academy, Government of India. The location of Kakkadavu dam site as shown in the Figure 1. But due to steep resistance from project affected people the dam height was reduced to 35m above the bed level with crest gate installed. The storage created by the dam is sufficient to cater the demand for water supply to Chennai and adjoining Panchayats and Naval Academy. The requirement of water for water supply is estimated by KWA as 260 MLD for 2050 AD, out of which 20 MLD water is estimated requirement Naval Academy.
Data Availability

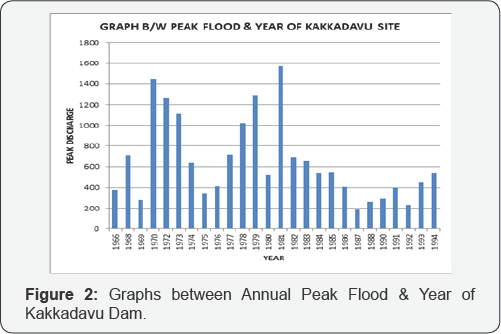
Daily stream flow data at the Kakkadavu dam is available from1966 to 1994. Based on the available data, peak flows have been extracted for the site. The plot of peak discharge at KakkadavuDam is shown in Figure 2.
Methodology
There are three basic approaches to the estimation of design flood:
a. Hydro-meteorological approach,
b. Frequency analysis, and
c. Use of empirical formulae.
Application of hydro-meteorological approach is ruled out in the present case due to the non-availability of the required data. Many empirical formulae have been devised for the purpose of estimating peak flows. These formulae can be safely applied to the areas for which they have been specifically developed. However, these formulae must be used with great prudence, and must never be used unless their origin has been investigated. No particular formula will give precise results for all the sites. This is because of the fact that the magnitude of the flood of a given frequency depends upon several factors but these formulae are developed using a limited number of variables. Use of empirical formulae for estimation of design flood is, therefore, not recommended. One of the primary objectives of the frequency analysis of hydrological data is to determine the recurrence interval of a hydrologic event of a given magnitude.
The recurrence interval may be defined as the average interval of time within which the magnitude of a hydrologic event will be equaled or exceeded once, on the average. Hydrologic frequency analysis is the approach of using probability and statistical analysis to estimate future frequencies based upon information contained in hydrologic records. Through the use of statistical methods, observed data is analysed so as to provide not only a more accurate estimate of future frequencies than is indicated by the observed data. The results of flood flow frequency analysis can be used for many engineering purposes:
i. For the design of dams, bridges, culverts, water supply systems, and flood control structures;
ii. To determine the economic value of flood control projects;
iii. To determine the effect of encroachments in the flood plain;
iv. To determine a reservoir stage for real estate acquisition and reservoir use purposes;
v. Tor the selection of runoff magnitudes for interior drainage, pumping plant, and local protection project design; and
vi. For flood plain zoning. In the application of statistical methods to hydrologic frequency analysis, theoretical probability distributions are utilized. The hydrologic events that have occurred are assumed to constitute a random sample (observed set of events) and then are used to make inferences about the true population (all possible events) for the theoretical distribution considered.
These inferences are subject to considerable uncertainty because a set of observed hydrologic events represent only a sample or small subset of the many sets of physical conditions that could represent the population described by the theoretical probability distribution. The existing methods of frequency analysis are numerous, with many diverse and confusing viewpoints and theories. Several types of probability distribution have been used in the past for hydrologic frequency determination. The most popular of these for flood flow frequency determination have been the log-normal, Gumbel's extreme value Type-I distribution, and log-Pearson Type- III distribution. The frequency analysis of the available peak discharge data at the Kakkdavu Dam site has been carried out using Gumbel's method Gumbel [5] and log-Pearson method Bobee [6]. Gumbel's extreme value distribution is the most widely used distribution to predict extreme events such as flood peaks. The log-Pearson Type III distribution has little theoretical basis but it is being widely used as a tool to predict the future flood events by several western agencies.
Results

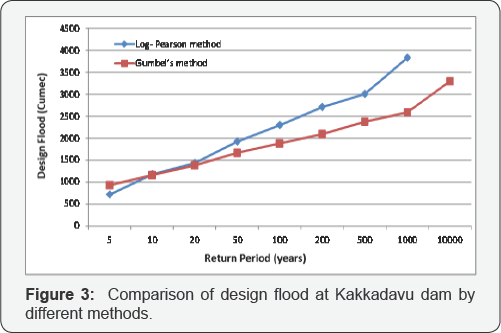
The values of the design flood at Kakkdavu Dam site using Gumbel’s and Log-Pearson method are shown in Table 1. It can be seen that for return periods up to 5 year, Gumbel's method produces higher values of peak flood discharge when compared to the Log-Pearson method. For return periods greater than return periods 5 year, Log-Pearson method produces higher values of peak flood discharge.
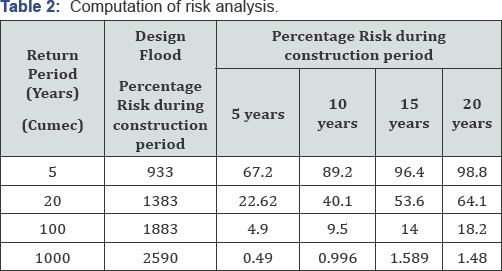
Figure 3 shows the comparison of design flood at Kakkadavu Dam by different return period by using different method. It can be seen from (Figure 3) that the Log-Pearson method produces higher values of peak flood discharge at higher return periods. Using the peak flood values, the risk of failure of a structure during various construction periods has been computed. In order to facilitate decision making the value of the flood for different return periods and the risk corresponding to the various assumed construction periods are presented in Table 2.


This is significantly different from the results obtained for Kakkadavu Dam where Log-pearson method was found to produce higher values of design flood at higher return periods.
Conclusion
Estimation of peak flood discharge is extremely crucial for reservoir design and management. In the present paper, design floods for different return periods have been computed using Gumbel’s and Log-Pearson method for Kakkadavu dam site in Kariangode river Basin. A comparison of peak flood discharge values obtained using the two methods indicated that for low return periods Gumbel's method produced higher values of peak flood discharge for Kakka Davu Dam whereas Log-perason method produced higher values for higher return periods.. Based on Gumbel's and Log-Pearson method, the values of 1000-year return period flood for the Kakkadavu Dam has been found to be 2590 and 3833 cumec respectively. The values of design flood corresponding to a return period of 10000 years are critically important for the design of spillways. Using the peak flood values, the risk of failure of structure during various construction periods has been computed and presented in the paper.
References
- Eagleson PS (1972) Dynamics of flood frequency. Water Resour Res 8(4): 878-898.
- McKerchar AI, Macky GH (2001) Comparison of a regional method for? estimating design floods with two rainfall-based methods. New Zeal Hydrol Soc - J Hydrol (NZ) 40 (2): 129-138.
- Gutknecht D, Bloschl G, Reszler Ch, Heindl H (2006) A''multi-pillar”- approach to the estimation of low probability designfloods. esterr. Wasser Abfallwirtsch 58 (34): 44-5.00
- Bobe'e B, Rasmussen (1995) Recent advances in flood frequency analysis, Rev Geophysics 33(2): 1111-1116.
- Gumbel EJ (1941) The Return period of Flood Flows Annals of Mathematical Statistics 12(2): 163-190.
- Bobee B (1975) "The Log Pearson Type 3 Distribution and Its Application in Hydrology,” Water Resources Research 11(5): 81-689.


