An Overview On Water Footprint Appraisal Process
*Mehdi Sheikh Goodarzi and Shabnam Navardi
1Department of Environment, University of Tehran, Iran
2Department of Environmental Engineering, West Tehran Branch of Islamic Azad University, Iran
Submission: June 12, 2017; Published: June 28, 2017
*Corresponding author: Mehdi Sheikh Goodarzi, Department of Environment, University of Tehran, Karaj, Iran, Email: goodarzi.9091@gmail.com
How to cite this article: Mehdi S G, Shabnam N. An Overview on Water Footprint Appraisal Process. Int J Environ Sci Nat Res. 2017;3(2): 555606. DOI: 10.19080/IJESNR.2017.03.555606
Abstract
Water footprint studies are becoming more and more important since they uncover the hidden link between consumption and water use and form the basis for the formulation of new strategies of water governance. The water footprint of a product is the volume of freshwater used to produce the product, measured over the full supply chain. It is a multidimensional indicator, showing water consumption volumes by source and polluted volumes by type of pollution; all components of a total water footprint are specified geographically and temporally. Water footprint types can roughly be categorized into three subclasses of blue (surface and groundwater), green (rainwater insofar as it does not become run-off) and grey (polluted water) footprints. The goal of assessing water footprints is to analyses how human activities or specific products relate to issues of water scarcity and pollution, and to see how activities and products can become more sustainable from a water perspective. In this regard, a water footprint study includes four main stages of setting goals and scope, water footprint accounting, water footprint sustainability assessment and water footprint response formulation. Water footprint studies have many important implications such as revealing national dependency on foreign water resources or analyzing the sustainability of water use in the areas where waterintensive import products originate.
Keywords: Virtual water; Water footprint appraisal; Blue-Green-Gray water
Background (The water footprint conception)
Human activities consume and pollute considerable amount of water. At a global scale, most of the water use occurs in agricultural production, but there is also substantial water volumes consumed and polluted in the industrial and domestic sectors WWAP [1]. Until the recent past, there have been few thoughts in the science and practice of water management about water consumption and pollution along whole production and supply chains. As a result, there is little awareness regarding the fact that the organization and characteristics of a production and supply chain strongly influence the volumes (and temporal and spatial distribution) of water consumption and pollution that can be associated with a final consumer product. Hoekstra and Chapagain [2] have shown that visualizing the hidden water use behind products can help in understanding the global character of fresh water and in quantifying the effects of consumption and trade on water resources use. The improved understanding can form a basis for a better management of the globe’s freshwater resources.
Freshwater is increasingly becoming a global resource, driven by growing international trade in water-intensive commodities. Apart from regional markets, there are also global markets for water-intensive goods such as crop and livestock products, natural fibers and bio-energy. As a result, use of water resources has become spatially disconnected from the consumers. This can be illustrated for the case of cotton. From field to end product, cotton passes through a number of distinct production stages with different impacts on water resources. These stages of production are often located in different places and final consumption can be in yet another place. For example, Malaysia does not grow cotton, but imports raw cotton from China, India and Pakistan for processing in the textile industry and exports cotton clothes to the European market Chapagain et al. [3]. As a result, the impacts of consumption of a final cotton product on the globe’s water resources can only be found by looking at the supply chain and tracing the origins of the product. Uncovering the hidden link between consumption and water use can form the basis for the formulation of new strategies of water governance, because new triggers for change can be identified. Where final consumers, retailers, food industries and traders in water-intensive products have traditionally been out of the scope of those who studied or were responsible for good water governance, these players enter the picture now as potential ‘change agents’. They can be addressed now not only in their role as direct water users, but also in their role as indirect water users.
The idea of considering water use along supply chains has gained interest after the introduction of the ‘water footprint’ concept by Hoekstra in 2002 Hoekstra [4]. The water footprint is an indicator of freshwater use that looks not only at direct water use of a consumer or producer, but also at the indirect water use. The water footprint of a product is the volume of freshwater used to produce the product, measured over the full supply chain. It is a multidimensional indicator, showing water consumption volumes by source and polluted volumes by type of pollution; all components of a total water footprint are specified geographically and temporally. The blue water footprint refers to consumption of blue water resources (surface and groundwater) along the supply chain of a product. 'Consumption' refers to loss of water from the available ground-surface water body in a catchment area. Losses occur when water evaporates, returns to another catchment area or the sea or is incorporated into a product. The green water footprint refers to consumption of green water resources (rainwater insofar as it does not become run-off). The grey water footprint refers to pollution and is defined as the volume of freshwater that is required to assimilate the load of pollutants given natural background concentrations and existing ambient water quality standards. Figure 1 shows components of water footprint.

Methodology (water footprint assessment)
Broadly speaking, the goal of assessing water footprints is to analyses how human activities or specific products relate to issues of water scarcity and pollution, and to see how activities and products can become more sustainable from a water perspective. How a water footprint assessment will look, largely depends on the focus of interest. One can be interested in the water footprint of one specific process step in a whole production chain, or in the water footprint of a final product. Alternatively, one can be interested in the water footprint of a consumer or group of consumers or in the water footprint of a producer or whole economic sector. Finally, one can take a geographic perspective, looking at the total water footprint within a delineated area such as a municipality, province, nation, catchment or river basin. Such a total water footprint is the aggregation of the water footprints of many separate processes taking place in the area. Water footprint assessment is an analytical tool, it can be instrumental in helping to understand how activities and products relate to water scarcity and pollution and related impacts and what can be done to make sure activities and products do not contribute to unsustainable use of freshwater. As a tool, a water footprint assessment provides insight; it does not tell people 'what to Green water footprint do'. Rather it helps people to understand what can be done. A full water footprint assessment will consists of distinct phases which respectively are [5-7].
Setting goals and scope
In order to be transparent about the choices made when undertaking a water footprint assessment study, one will have to start by clearly setting the goals and scope of the study. A water footprint study can be undertaken for many different reasons. For example, a national government may be interested in knowing its dependency on foreign water resources or it may be interested to know the sustainability of water use in the areas where water-intensive import products originate. A river basin authority may be interested to know whether the aggregated water footprint of human activities within the basin violates environmental flow requirements or water quality standards at any time. The river basin authority may also want to know to what extent scarce water resources in the basin are allocated to low-value export crops. A company may be interested to know its dependence on scarce water resources in its supply chain or how it can contribute to lower the impacts on water systems throughout its supply chain and within its own operations.
Water footprint accounting
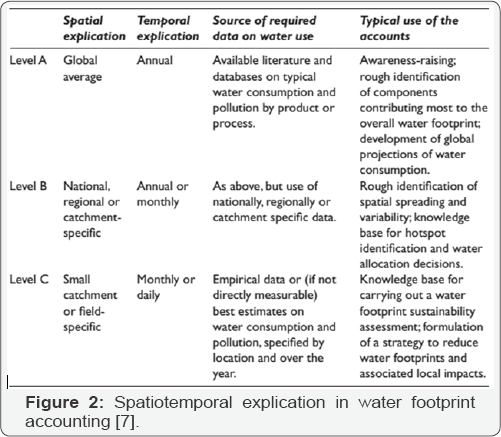
The phase of water footprint accounting is the phase in which data are collected and accounts are developed. The scope and level of detail in the accounting depends on the decisions made in the previous phase (Figure 2).
Water footprint sustainability assessment
After the accounting phase is the phase of sustainability assessment, in which the water footprint is evaluated from an environmental perspective, as well as from a social and economic perspective.
Water footprint response formulation
In the final phase, response options, strategies or policies are formulated. It is not necessary to include all the steps in one study. In the first phase of setting goals and scope, one can decide to focus only on accounting or stop after the phase of sustainability assessment, leaving the discussion about response for later. Besides, in practice, this model of four subsequent phases is more a guideline than a strict directive. Returning to earlier steps and iteration of phases may often be necessary. In first instance, a company may be interested in a rough exploration of all phases, in order to identify critical components in its water footprint and set priorities for response, while later on it may like to seek much greater detail in certain areas of the accounts and the sustainability assessment.
Results (Outcomes)
Water footprint studies may have various purposes and be applied in different contexts. Each purpose requires its own scope of analysis and will allow for different choices when making assumptions. One can assess the water footprint of different entities, so it is most important to start specifying in which water footprint one is interested.
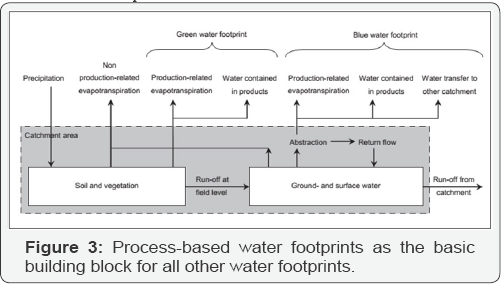
The water footprint of one single 'process step' is the basic building block of all water footprint accounts (Figure 3). The water footprint of an intermediate or final 'product' (good or service) is the aggregate of the water footprints of the various process steps relevant in the production of the product. The water footprint of an individual consumer is a function of the water footprints of the various products consumed by the consumer. The water footprint of a community of consumers - for example, the inhabitants of a municipality, province, state or nation - is equal to the sum of the individual water footprints of the members of the community. The water footprint of a producer or whatever sort of business is equal to the sum of the water footprints of the products that the producer or business delivers. The water footprint within a geographically delineated area - be it a province, nation, catchment area or river basin - is equal to the sum of the water footprints of all processes taking place in that area. The total water footprint of humanity is equal to the sum of the water footprints of all consumers of the world, which is equal to the sum of the water footprints of all final consumer goods and services consumed annually and also equal to the sum of all water-consuming or polluting processes in the world.
Blue water Footprint
The blue water footprint is an indicator of consumptive use of so-called blue water, in other words, fresh surface or groundwater. The term 'consumptive water use' refers to one of the following: Water evaporates, Water is incorporated into the product, Water does not return to the same catchment area, for example, it is returned to another catchment area or the sea and Water does not return in the same period, for example, it is withdrawn in ascarce period and returned in a wet period. The blue water footprint in a process step is calculated as (Equation 1):

The last component refers to the part of the return flow that is not available for reuse within the same catchment within the same period of withdrawal, either because it is returned to another catchment (or discharged into the sea) or because it is returned in another period of time. In assessing the blue water footprint of a process it may be relevant (depending on the scope of the study) to distinguish between different sorts of blue water sources. The most relevant division is between surface water, flowing (renewable) groundwater and fossil groundwater. One can make the distinction by speaking respectively of the blue surface water footprint, the blue renewable groundwater footprint and the blue fossil groundwater footprint (or the light- blue, dark-blue and black water footprint if one really likes the use of the colors) [8-11]. According to Water footprint and water scarcity data (1996-2005 average) and Water pollution level data (2000) in Iran (Islamic Republic of), blue water map is presented as following (Figure 4).

Green water footprint
The green water footprint is an indicator of the human use of so-called green water. Green water refers to the precipitation on land that does not run off or recharges the groundwater but is stored in the soil or temporarily stays on top of the soil or vegetation. Eventually, this part of precipitation evaporates or transpires through plants. Green water can be made productive for crop growth (but not all green water can be taken up by crops, because there will always be evaporation from the soil and because not all periods of the year or areas are suitable for crop growth). The green water footprint is the volume of rainwater consumed during the production process. This is particularly relevant for agricultural and forestry products (products based on crops or wood), where it refers to the total rainwater evapo-tranpiration (from fields and plantations) plus the water incorporated into the harvested crop or wood. The green water footprint in a process step is equal to [2,12] (Equation 2):

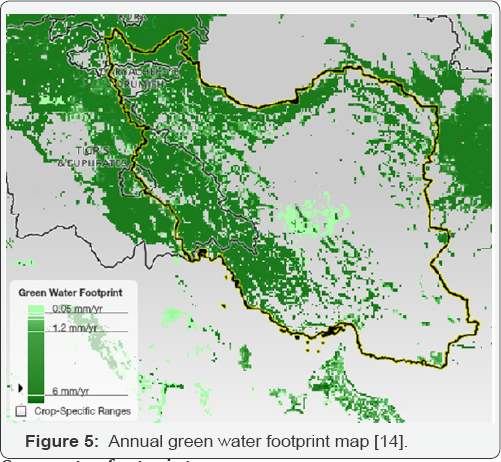
According to Water footprint and water scarcity data (19962005 average) and Water pollution level data (2000) in Iran (Islamic Republic of), green water map is presented as following (Figure 5).
Grey water footprint
The grey water footprint of a process step is an indicator of the degree of freshwater pollution that can be associated with the process step. It is defined as the volume of freshwater that is required to assimilate the load of pollutants based on natural background concentrations and existing ambient water quality standards. The grey water footprint concept has grown out of the recognition that the size of water pollution can be expressed in terms of the volume of water that is required to dilute pollutants such that they become harmless. The grey water footprint is calculated by dividing the pollutant load (L, in mass/time) by the difference between the ambient water quality standard for that pollutant (the maximum acceptable concentration cmax, in mass/volume) and its natural concentration in the receiving water body (cnat, in mass/volume) (Equation 3).

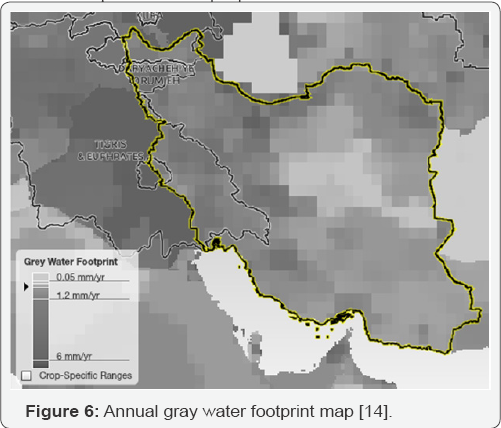
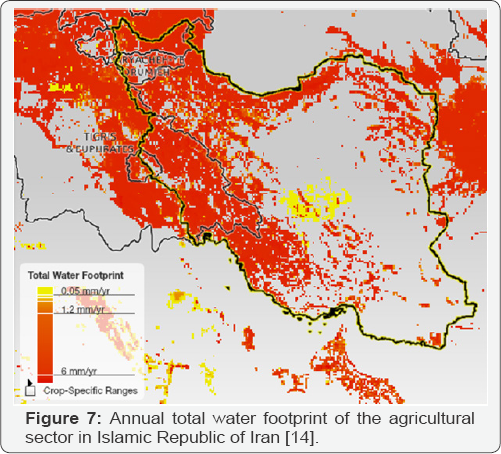
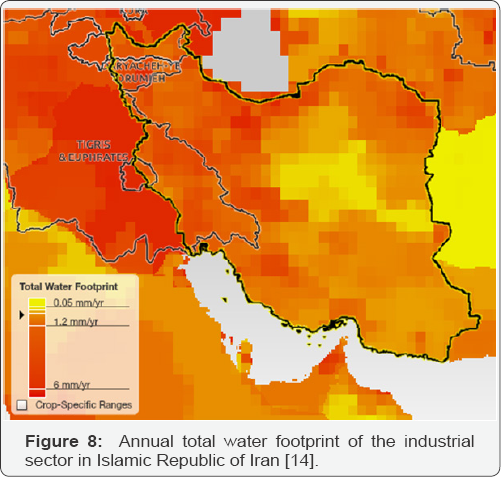
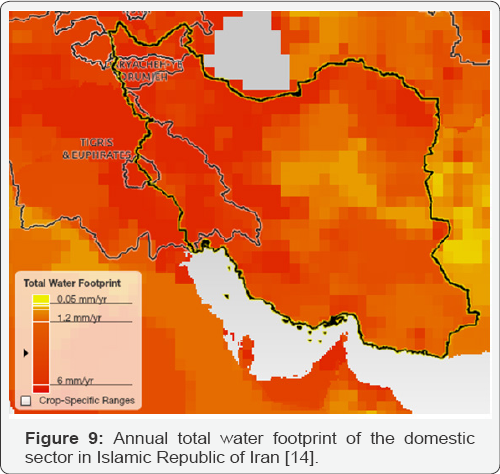
The natural concentration in a receiving water body is the concentration in the water body that would occur if there were no human disturbances in the catchment. For humanmade substances that naturally do not occur in water, cnat = 0. When natural concentrations are not known precisely but are estimated to be low, for simplicity one may assume cnat = 0. This will, however, result in an underestimated grey water footprint when cnat is actually not equal to zero. One may ask why the natural concentration is used as a reference and not the actual concentration in the receiving water body. The reason is that the grey water footprint is an indicator of appropriated assimilation capacity. According to water footprint and water scarcity data (1996-2005 average) and water pollution level data (2000) in Islamic Republic of Iran, gray water map is presented as following (Figure 6). Correspondingly, (Figures 7-9) indicate the Annual Total Water Footprint regarding each sector (agricultural, industrial and domestic use) uses of blue, green and gray water in Islamic Republic of Iran [13].
Discussion and conclusion
The water footprint is an indicator offreshwater appropriation (in m3/yr), developed as an analogue to the ecological footprint, which is an indicator of use of biologically productive space (in ha). In order to get an idea of what the footprint size means, one will need to compare the water footprint to the available freshwater resources (also expressed in m3/yr), in the same way as one needs to compare the ecological footprint to the available biologically productive space (in ha) Hoekstra [14]. In essence, water footprint sustainability assessment is primarily about making this comparison of the human water footprint with what the earth can sustainably support Hoekstra et al. [8].
One can argue that consumers are responsible for what they consume, so they are also responsible for the indirect resource use related to their consumption pattern. In this sense, consumers have responsibility for their water footprint and should undertake action to ensure that their water footprint is sustainable. If they would do so, producers would be forced to deliver sustainable products. One can also turn the argument around and argue that producers are responsible for delivering sustainable products. This would imply that producers should take action to make product water footprints sustainable. And investors, of course, should include considerations of sustainable water use into their investment decisions. Finally, water is a public good, so governments cannot withdraw from their responsibility to put proper regulations and incentives in place to ensure sustainable production and consumption. It will be maintained here that consumers, producers, investors and governments all have a shared responsibility Hoekstra et al [8].
Technically, both blue and grey water footprints in industries and households can be reduced to zero by full water recycling. In a closed cycle there will be neither evaporation losses nor polluted effluents. In factories or cooling systems, evaporated water can be captured and recycled or returned to the water body where it was taken from. In agriculture, the grey water footprint can be reduced to zero by preventing the application of chemicals to the field. It can be lowered substantially by applying less chemicals and employing better techniques and timing of application (so that less chemicals arrive in the water system by run-off from the field or by leaching). Green and blue water footprints (m3/ton) in agriculture can generally be reduced substantially by increasing green and blue water productivity (ton/ m3). Agriculture is often focused on maximizing land productivity (ton/ha), which makes sense when land is scarce and freshwater is abundant, but when water is scarcer than land, maximizing water productivity is more important. In the case of blue water, this implies applying less irrigation water in a smarter way; in order to give a higher yield per cubic meter of water evaporated.
References
- WWAP (World Water Assessment Programme) (2009) The United Nations World Water Development Report 3: Water in a Changing World, WWAP, UNESCO Publishing, Paris, and Earth scan, London, UK.
- Hoekstra AY, Chapagain AK (2008) Globalization of Water: Sharing the Planet's Freshwater Resources, Blackwell Publishing, Oxford, New Jersey, USA.
- Chapagain AK, Hoekstra AY, Savenije HHG (2006a) 'Water saving through international trade of agricultural products'. Hydrology and Earth System Sciences 10(3): 455-468.
- Hoekstra AY (2003) 'Virtual water trade: Proceedings of the International Expert Meeting on Virtual Water Trade'. 12-13 December 2002, Value of Water Research Report Series No 12, UNESCO-IHE, Delft, Netherlands.
- Gerbens-Leenes PW, Hoekstra AY (2009) 'The water footprint of sweeteners and bio-ethanol from sugar cane, sugar beet and maize', Value of Water Research Report Series No 38, UNESCO-IHE, Delft, Netherlands.
- Yang H, Zhou Y, Liu JG (2009) 'Land and water requirements of biofuel and implications for food supply and the environment in China'. Energy? Policy 37(5): 1876-1885.
- Dominguez Faus R, Powers SE, Burken JG, Alvarez PJ (2009) 'The water footprint of biofuels: A drink or drive issue?”. Environmental Science & Technology 43(9): 3005-3010.
- Hoekstra AY, Chapagain AK, Aldaya MM, Mekonnen MM (2011) The Water Footprint Assessment Manual, Setting the Global Standard. Earth scan, publishing for a sustainable future. London, Washington, DC pp. 228.
- Aldaya MM, Llamas MR (2008) 'Water footprint analysis for the Guadiana river basin’, Value of Water Research Report Series No 35, UNESCO-IHE, Delft, Netherlands.
- Aldaya MM, Hoekstra AY (2010) 'The water needed for Italians to eat pasta and pizza”, Agricultural Systems 103: 351-360.
- Mekonnen MM, Hoekstra AY (2010a) A global and high-resolution assessment of the green, blue and grey water footprint of wheat’. Hydrology and Earth System Sciences 14: 1259-1276.
- Falkenmark M, Rockstrom J (2004) Balancing Water for Humans and Nature: The New Approach in Ecohydrology, Earthscan, London,UK.
- Water Footprint Network (WFN) (2008) Water Footprint Network an association to solve the world's water crises.
- Hoekstra AY (2009) 'Human appropriation of natural capital: A comparison of ecological footprint and water footprint analysis’.Ecological Economics 68(7): 1963-1974.


