


Statistical Optimization of Electro Oxidation Process for Removal of Textile Dye C.I. Reactive Blue 198
*K. Rajkumar1,2 and M. Muthukumar1
1Environmental Engineering and Technology Laboratory, Department of Environmental Sciences, Bharathiar University, India.
2M/s Senthil Papers and Boards Private Limited, Ikkaraithathapalli, Sathiyamangalam, India.
Submission: November 04, 2016; Published: February 27, 2017
*Corresponding author: K. Rajkumar, Environmental Engineering and Technology Laboratory, Department of Environmental Sciences, Bharathiar University, Coimbatore - 641 046, Tamilnadu, India
How to cite this article: K Rajkumar, M Muthukumar. Statistical Optimization of Electro Oxidation Process for Removal of Textile Dye C.I. Reactive Blue 198. Int J Environ Sci Nat Res. 2017;1(4): 555570. DOI: 10.19080/IJESNR.2017.01.555570
Abstract
An experimental design was proposed for the optimization of electro-oxidation process to augment the degradation of C.I Reactive Blue 198 in wastewater. The design was employed to derive a statistical model for the effect of variables on color and COD removal using graphite electrodes in presence of Nacl as electrolyte. The experiments were mathematically designed as the function of variables such as pH (X1), NaCl concentration (M) (X2) and electrolysis time (min) (X3). The experimental results are statistically analyzed and mathematically modeled through response surface methodology (RSM). The mathematical model adequacies are checked using analysis of variance (ANOVA). Contour plots and response plots predicted the maximum color removal 98.9% and 65.5% of COD removal at pH 7, Nacl concentration 0.13M and electrolysis time 10.5 min, with the constant applied current at 2.5A (current density 34.96 mAcm-2). UV- visible, FTIR spectrum and GCMS shows the complete decolorization and degradation mechanisms.
Keywords: Electro-oxidation; Reactive Blue 198; Optimization; Response surface methodology; COD; Colour removal; FTIR; GCMS.
Introduction
Color is one of the most obvious indicators of water pollution and the discharge of highly colored effluents containing dyes can be damaging to the receiving bodies [1]. Reactive dyes represent an important fraction of the commercialized synthetic dyes used (approximately 12% of the worldwide production) [2]. The main environmental problem associated with the reactive dyes is their low exhaustion. Frequently, the fixation efficiency of these dyes range between 60% and 90% [3]. Textile wastewater typically contains 0.01-7 gL-1 dye, depending on the dyes and processes used [4]. The degree of dye fixation to fabrics depends on the fiber, depth of shade and mode of application and depending on the dye, 2-50% of unfixed dye can enter the waste stream [5]. The dyeing of one kilogram of cotton with reactive dyes demands from 70 to 150 L [6] water, 0.6 to 0.8 kg Nacl and anywhere from 30 to 60 g dyestuff. More than 80,000 tones of reactive dyes are produced and consumed each year, making it possible to estimate the total pollution caused by their use. After the dyeing is completed, the various treatment baths are drained out, including the first dye bath, which has a very high salt concentration, is heavily colored and contains a substantial load of organic substances [7].
A large fraction of reactive dyes that remains unutilized after the dyeing process gets discharged into water stream and causes environmental pollution. Some of these dyes can cause serious health risks [8]. Due to the deep impact on the environment, the treatment of wastewaters from textile industries constitutes an issue of major economical and environmental concern [9]. Different treatments are still known ranging from adsorption, coagulation and flocculation to chemical or biological oxidation [10]. For many years, the introduction of more stringent pollution regulations, coupled with financial and social pressures for sustainable development, has pressed toward "zero-effluent" processes, as well as to researching and developing new or more efficient wastewater treatment technologies. A basic principle in environmental culture is to reduce waste and pollution to "As Low as Reasonably Achievable" (ALARA) levels. To ensure acceptable levels of environmental impact, however, wastewater systems also have to be engineered in accordance with the principle of "Best Available Techniques Not Entailing Excessive Cost" (BATNEEC) [11].
In recent years, electrochemical techniques viz. electro coagulation, electro flotation and electro oxidation have drawn the attention of many researchers since the main reagent is the electron which is a "clean reagent" [12,13].
In electrochemical process, the pollutants are destroyed by either a direct or an indirect oxidation process. In direct anodic oxidation process, the pollutants are first adsorbed on the anode surface and then destroyed by the anodic electron-transfer reaction. In indirect oxidation process, strong oxidants such as hypochlorite/chlorine, ozone, and hydrogen peroxide are electrochemically generated. The pollutants are then destroyed in the bulk solution by an oxidation reaction of the generated oxidants. All the oxidants are generated in situ and are utilized immediately [14]. Hydroxyl radical that are generated on the electrode surface may directly oxidize the organic compounds to carbon dioxide and water [15]. In these cases, the oxidation efficiency are strongly depends on the interaction of the hydroxyl radicals with the material surface. As a general rule, the weaker the interaction between hydroxyl radicals and electrode surface, the higher the material reactivity towards oxidation of organic compounds [16]. Most of the research papers have investigated the electrochemical oxidation for various effluent generated from tannery [12], landfill leachate [17], p-chlorophenol and p-nitrophenol [18], pesticides [19], olive oil mill [20], textile [13,21], paint [22], paper mill [23] and sugar factory [24].
The optimization of an electro oxidation process can be done by using the conventional "one-variable-at-a-time" technique in which the effect of one independent variable is seen on the response, while other factors are kept constant. This method assumes that the various treatment parameters do not interact and that the response variable is only a function of the single varied parameter. However, the response obtained from a waste treatment method, for example, results from the interactive influences of the different variables. Thus, the conventional technique does not depict the complete effects of the parameter on the response [25]. Another disadvantage of the one-factor optimization is the increase in the number of experiments necessary to conduct the research, which leads to an increase of time and expense as well as an increase in the consumption of reagents and materials [26]. These limitations of the traditional method can be eliminated by optimizing all parameters which affect the process collectively using a multivariate statistic technique, which has many advantages such as a reduction in the number of experiments that need to be executed resulting in lower reagent consumption and considerably less laboratory work [27]. Moreover, this method allows the development of mathematical models that permit the assessment of the relevance as well as statistical significance of the factor effects being studied and evaluation of the interaction effects between the factors. Among the available multivariate techniques, the most relevant is the response surface methodology (RSM).
The application of RSM to the electro oxidation process involves a factorial search by examining simultaneous, systematic, and efficient variation of important components. It helps to predict a model for the process, identify possible interactions or higher-order effects, and determine the optimum operational conditions for the maximum removal of the pollutant species from water or wastewater [26]. RSM is useful in process design and optimization as well as for the improvement of existing design and optimization technique has been successfully applied to electrochemical oxidation [21,28,29]. The aim of this study is to investigate the degradation of C.I. Reactive Blue 198 (RB198) in aqueous solutions using electro-oxidation process with the help of full factorial design.
Materials and methods
Materials
The C.I. Reactive Blue 198 (CAS number 124448-55-1, Molecular formula C40H30Cl4N14O14S4Na4, Molecular weight 1289.93 and A max at 625 nm) was procured from M/S Jansons International Ltd., Mumbai, India. The structure of the dye is shown in (Figure 1). All chemicals used for the analysis were obtained by Loba chemie, Mumbai, India. Double distilled water was used for the preparation of simulated industrial textile wastewater. The graphite materials used in this study was procured from M/S Carbone Lorraine, Chennai, India. The electrical resistivity of graphite electrode was 0.001 Ωcm.

Central composite design (CCD)
To find the optimum conditions for degradation of the reactive dye in an electrochemical oxidation, the experimental conditions were designed as a function of the selected main variables such as pH, electrolyte concentration and electrolysis time. CCDs are optimized designs for fitting quadratic models. It includes equal predictability in all directions from the center. The number of experimental points in the CCD is sufficient to test the statistical validity of the fitted model and lack-of-fit of the model [30]. In full factorial CCD all variables are studied at five levels (-α, -1, 0, +1,+α ). The rotatable experimental plan was carried out as a central composite design with three variables and at five levels consisting of 20 experiments as shown in (Table 1).

The factors (independent variables) selected for this experiment were pH (XJ: 3-11, electrolyte concentration (Nacl) (X2): 0.05-0.2 M and electrolysis time (X3): 1-20 min.A three-level factorial design was established with the help of the Design Expert 8.0.2 Trial software (USA). The three significant independent variables X1, X2, and X3 and the mathematical relationship of the response Y on these variables can be approximated by quadratic/(second-degree) polynomial equation (1):

Where Y is the predicted response, b0 the constant, b1, b2, and b3 the linear coefficients, b12, b13, and b23 the cross-product coefficients, and b11, b22, and b33 are the quadratic coefficients.
Experimental set-up


The electrochemical batch reactor having the capacity of 250 mL was used for the experiment. The schematic diagram of the reactor and electrode assembly is shown in (Figure 2). Electrical current was applied at a constant current density of 34.96 mAcm' 2 controlled by DC power supply (Sri Sai Scientific, Coimbatore, India). The electrode assembly was placed in the cell and the electrodes were connected to the respective anode and cathode leads of the DC rectifier and energized for a required duration at a fixed current. The reactor was placed on a magnetic stirrer block (Superfit, Coimbatore, India) in order to keep its contents well mixed during the experiment. Graphite carbon electrodes each having 6.5 cm x 5.5 cm with contact surface area of 71.5 cm2 has been used for both anode and cathode. The distance between anode and cathode was maintained at 8mm to reduce the ohmic losses. C.I. RB 198 was dissolved in double distilled water at a concentration of 650 µM for experimental solution. Each experimental run was carried out as per the conditions specified in the design matrix (Table 2).
Analytical techniques
Samples withdrawn from the reactor at certain time intervals were analyzed immediately to avoid further reactions. 50 ml of raw and treated samples were taken from the reactor after completion of reaction time and centrifuged at 5000 rpm for 10 min (Remi, Chennai, India) prior to analysis. The pH of the sample was analyzed before and after treatment using the pH meter (Susima AP-1 Plus, Chennai, India) and adjusted as per the design by adding 0.1 N HCl and 0.1 N NaOH. The rate of decoloration was determined through absorbance at maximum wavelength (A max 625 nm) using UV-visible spectrophotometer (UV- Shimadzu 3600, Japan). Chemical oxygen demand (COD) was analyzed by open reflux method [31]. The initial COD of the experimental sample was found to be 448 mg L-1. The residue generated after treatment was analyzed using FT-IR spectrometer (Nicolet 10, USA). A 10-15 mg of residue was dispersed in 200mg of spectroscopic grade KBr to record the spectra.
The GC system (HP model 5890 Series II, USA) was coupled with MS system (HP model 5972N, USA). The injection of the extracted samples into GC/MS system was conducted on a split less mode, and injector temperature was 250°C with helium served as the carrier gas at the flow rate of 0.8 mL min-1. The extracted samples were chromatographed using a chromatographic column (RTX-502.2 (L-60m, ID-0.25 µm) under the following temperature gradient the initial column temperature was held constant at 40°C for 10 min, increased at 12°C min-1 to 100°C, then ramped at 5°C min-1 to 200°C, further ramped at 20°C min-1 to 270°C and kept constant for 5 min, and then raised at 10°C min-1 to 300°C. The identification of electro oxidation products was done by comparing the GC-MS spectra patterns with those of standard mass spectra in the National Institute of Standards and Technology (NIST) library.
Statistical analysis
Determining the adequacy and significance of the quadratic model ANOVA was performed. For the interpretation of the data regression analysis, graphical analysis and analysis of variance (ANOVA) were performed with the help of a statistical software package Design Expert 8.0.2 Trial software (USA).
Results and Discussion
Central composite design analysis
The most important variables that affect color and COD removal during electro oxidation process are pH (X1), salt concentration (X2) and electrolysis time (X3). In order to study the combined effect of these variables, experiments were performed for different combinations using statistically designed experiments. The results obtained for color (Y1) and COD (Y2) of actual and predicted values are listed in (Table 3). Decolorizations were between 4% and 99.9% and COD removal varied within 33.9% and 75%.
Analysis of variance (ANOVA)
The ANOVA for the second order equations are presented in (Table 3). It indicates that the equation adequately represented the relationship between the response and the significant variables. The large Fisher’s "F" value indicates that most of the variation in the response can be explained by the regression model equation. The associated P-value is used to judge whether F is large enough to indicate statistical significance. If the P-value for a larger F is lower than 0.05 it indicates that the model is statistically significant [32]. Further it seems from Table 3, that the F-value of 1.47 and 10.08 bears the statistical insignificance for color and significance for COD removal respectively. Signal to noise ratio was found to be 4.34 and 12.85, for color and COD removal respectively, since the signal to noise ratio is greater than 4 is desirable [33].

The coefficient of determination (R2) value 0.5601 for color removal shows the quadratic model was insignificant due to pH of the solution. Where in the case for COD removal the coefficient of determination (R2) value 0.9007 shows the model is significant for COD removal. The quadratic equations were obtained in the form of following equations (2 - 3):
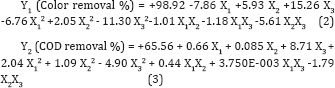

The above model can be used to predict the average color and COD removal efficiency within the limits of the experimental factors. The plot of the predicted response versus actual values for color and COD respectively, are shown in (Figure 3). The plot in (Figure 3a) shows that the actual response values not in a straight line with the predicted response values results in distribution error leads to insignificant terms for correlation coefficient. Figure 3(b) shows that the actual response values points on the plot lie reasonably close to a straight line and it concludes that the data is normally distributed.
Interpretation of response surface contour plots
To investigate the interactive effect of three factors such as pH, Nacl concentration and electrolysis time on electro-oxidation process, contour (2D and 3D) plots for the predicted responses were drawn, based on the model polynomial function to analyze the change in the response surface [34]. Each plot is drawn between two independent variables and the response; the value of other variable were held and set at their middle values.
Effect of initial pH on color and COD removal
The functional groups of reactive dye are anionic and it releases negative charges when it dissolves in water. pH is known to affect the structural stability of dye molecules (in particular the dissociation of their ionizable sites), as well as color intensity [35] . Although the first order effect of pH is weak, the quadratic effect is significant and results in a slight improvement of the degradation rate at low or high pH. Response surface plots an infinite number of combinations of the two selected variables with the other maintained at their respective zero coded level. A circular contour of response surfaces indicates that the interaction between the corresponding variables is negligible. An elliptical or saddle nature of the contour plots indicates that the interaction between the corresponding variables is significant. In order to find the effect of different pH on dye spectra, initial dye concentration of 100µM, and at different pH such as 3, 5, 7, 9 and 11, before oxidation were observed. The spectra obtained were shown in (Figure 6a).

The changes in the different pH have a major impact on the results of RB 198, the change in pH has a major impact on the A max shift. In acidic pH, the shift was bathochromic since the A max shifted from 625nm to 771nm and also it was noted that when there was change in pH, the spectra may do hypochromic shift, ie., intensity of the peak gets decreased. Experiments were carried out by varying the initial pH from 3 to 11; the results obtained were plotted in Figures 4 & 5. It was observed that the color and COD removal of RB 198 is relatively low at pH 3 and high at pH 11, compared with that at pH 7. During electrolysis, chloride ions are converted into chlorine and subsequently to hypochlorous acid or hypochlorite ions in neutral or slightly alkaline pH. Chloride ions participate in indirect electrolysis by the following mechanism:
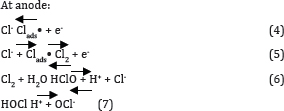
Hypochlorous acid is in equilibrium with hypochlorite ion. The ClO- then participates in the oxidation reaction via following reactions:

This is consistent with the results of Yavuz and Kaporal [36] while oxidizing phenol using ruthenium mixed metal oxide electrode. It was reported that electro-oxidation without initial pH adjustment (initial pH around 7) was more effective in removing phenol, compared to pH 3 and pH 11. However, Chen & Chen [37] reported that the pH is not significant while oxidizing orange II dye on Ti/BDD anode. The active oxygen and the active chlorine (OCl- at pH > 7, HOCl at pH < 5) species are taken as the mediators generated at the anode. However, the decrease in COD in acidic pH 3 shows which may be accounted for the low stability of the active chlorine (HOCl) in acidic solution. Similarly, at high pH 11 is again attributed to the loss of active chlorine (OCl-) due to its disproportionate as shown in equation (9). This may be due to the fact that the OCl- active chlorine species are more stable under neutral conditions.

Effect of electrolytic concentration on color and COD removal
High ionic strength is necessary to provide enough solution conductivity for electrochemical treatment of wastewater, which may be crucial for the destruction process. Solution with various ionic strengths was obtained by preparing various concentration of Nacl (aq) in this study. The electrolysis (NaCl) could be mainly attributed to the indirect oxidation effect of chlorine/ hypochlorite produced during the electrolysis. These anions, together with other ionic degradation products, cause the increase of the current flow; however Nacl enhances the decolorization process [38]. During the electrolysis, the organics in the RB 198 decomposed continuously by both direct and indirect anodic oxidation via mediators, such as active chlorine. Many researchers have studied the indirect electro-oxidation with active chlorine performed with a graphite anode to mainly characterize the decolorization process of several organic dyes such as Reactive Orange 107 [21], and Methyl Orange [39].
Intentionally adding Nacl to the wastewater increases the solution conductivity, decreases the energy consumption, and promotes indirect anodic oxidation by producing hypochlorite at the anode. Figures 4 and 5 shows the effect of the Nacl concentration was varied from 0.05 to 0.2 M, added on the color and COD removal efficiencies, respectively. As the electrolyte concentration increase, the electrical conductivity of the solution increased and thus the electrolytic cell voltage for maintaining a constant current decreased. Consequently, the energy consumption decreased as the electrolyte concentration increased. However, color removal is not proportional to the electric current and salt concentration. Then a specific batch run was performed under these optimum conditions in order to test the estimated performance and color and COD removals were achieved as 98.9% and 65.5%, respectively, denoting a reasonable prediction of the model. This result also showed that the relationship developed between the responses and the independent variables in Eqs. (2)-(3) was satisfactory.


Effect of electrolysis duration on color and COD removal
In view of reducing the power consumption and optimizing the electrochemical oxidation processes, the effect of electrolysis duration on color and COD removal was studied by varying the duration from 1 to 20 min. The results are shown in (Figures 4 and 5). The color and COD removal efficiency depends directly on the concentration of oxidants produced by the electrodes which in-turn depends upon time (X3). When the value of X3 increases, an increase occurs in the concentration of active chlorine. Consequently, an increase in the X3 increases the color and COD removal efficiency.
Figure 6b shows the changes in RB 198 decolorization with the retention time. From the UV-Vis spectra, it was clear that, the cleavage of chromophores and aromatic rings results in the decrease of optical density of the dye solution [40]. Also the absorption band has been shifted from visible to near UV region, which indicates the rapid decolorization of the dye, giving smaller and colorless organic or inorganic products, which can further be treated for complete mineralization. The decrease of COD shows that further degradation of the initial colorless products occurred along with the decolorization during the electrochemical treatment. It could be concluded that the COD removal is lower than that of color removal, indicating the chromophore degradation is the first step of the electrochemical mechanism with the comparison of COD removal. The COD values of 65.5% indicate that the removal degree for color disappearance does not mean complete degradation or complete removal of pollutants in the solution.
UV-visible spectra changes
The changes in the absorption spectra (both at UV and visible regions with respective wavelengths of 297 and 625 nm) at various time intervals during the treatment of RB 198 were presented in Figure 6b. The optimum condition was considered and the experiment was performed. The peak observed in the visible region was due to blue color of chromophore, while peak observed in the UV region was due to anthraquinone structure of the dye [41]. The disappearance of the visible band in a short period might be due to the fragmentation of the quinone links by oOH radical attack during the oxidation process. At the same time, the reduction in the absorbance at 297 nm was considered as the evidence of chromophore degradation in the dye molecule and its intermediates. This represents the residual COD present in the effluent.

FT-IR spectra analysis

Figure 7 shows the FTIR spectra of RB 198 before and after 20 min of electrolysis. Figure 7a shows the several bands can be distinguished in the spectra. The broad peak around 3442.84 cm-1, which assigns to N-H vibration [42]. Furthermore, the peaks at 2929.47cm-1 and 2856.84cm-1, which represent the C-H symmetric stretching and C-H asymmetric stretching of CH2, respectively [43], The vibrations located at 1607.10cm-1 (a combination of phenyl ring vibrations with stretching of the C=N group), It can be observed that the bands at 1547cm-1, which were associated with the chromophore of the reactive dye, 1413.66 cm-1 (O-H bending vibrations), and 1127.89cm-1 (symmetric vibrations of the sulfonate groups). The peaks at 1035.52cm-1 and 795.52cm-1 account for Cl. The peaks at 616cm-1 account for aromamatic or benzene ring. The (Figure 7b) showed after 20 min of electrolysis, the FTIR spectrum was obviously modified with respect to the aforementioned spectrum of the initial working dye. It can be observed that the bands at 3457.88cm-1 which indicate the presence of both free and hydrogen bonded OH groups. The peak becoming weaker near 1631.55cm-1, which is responsible for the combination of stretching vibration of C=O conjugated with C=C [44]. The peaks at 2929.47cm-1, 2856.84cm-11547.10cm-1, 1413.66cm-1 1035.52cm-1 and 795.52cm-1 get completely disappeared. Furthermore, a new absorption peak of 1631.55cm-1 was observed, which can be assigned as the stretching of C=O in carboxylic groups, aldehydes or ketones [45] generated in the process. The presence of this band indicated the formation of new species, which originated from the fragmentation of the parent RB 198 molecule. The formation of new peaks at 1145.31cm-1 and 975.52cm-1 indicates the C-NO2 of aromatic ring and C-N stretching of aromatic NO2. The IR spectrum also projects peaks at 620.99cm'1 and 489.85cm'1 which account for aromatic benzene ring. This variation in the FTIR spectra has explained the incomplete mineralization of RB 198.
GCMS analysis

RB 198 degradation pathway is illustrated in (Figure 8). The chromophore in the dye molecule should be split in the first step. The bonds C-N and C-N in the RB 198 molecule were probably cleaved by free radical attack, which led to the decolouring of RB 198 in the bulk solution. In electro oxidation process the dye molecule split into S1 - S5 namely Sodium 3-amino-benzenesulfonate, 6-chloro-[1,3,5]triazine-2,4-diamine, 3,6-Diiamine-2,5-dichloro-cyclohexa-1-4-diene-1,4- diol, sodium;3,6-diamino-2 -hydroxy -benzenesulfonate and Benzene-1,4 - diamine. The above mentioned organic compounds were further degraded to generate aromatic intermediates. These compounds later underwent deep degradation to form benzene- type intermediates, the further oxidation of which resulted in aromatic ring cleavage and generation of aliphatic acids, such as hexanoic acid, enanthic acid and hexylacetic acid. Finally, these organic acids were decomposed to CO2 to accomplish the entire mineralization process. Overall, the electrolysis decomposition of RB 198, in the graphite electrode system can be described by a series of consecutive degradation steps.
Conclusion
In this study central composite design was proven to be a suitable response surface methodology to determine the effect of operative variables (pH, NaCl contraction and reaction time) and their interaction on the electro-oxidation of C.I. RB 198. The results indicated that the degree of color removal was obviously affected by pH. Statistical analysis of variance (ANOVA) indicated neither the interaction effect nor the quadratic model was insignificant for color removal, while effects were significant on COD. The high R2 value of COD removal indicates the presence of a high correlation between observed and predicted values. The maximum color and COD removal were achieved as 98.9 and 65.5% respectively. The response surface methodology models were derived after the insignificant terms were excluded. This result could fit the experimental data well. Based on the results the oxidation process, decomposition of RB 198 was proposed to by firstly initiated by the cleavage of reactive ring; conform to UV-vis spectra, which results in decloratiozation on the solution. Afterwards GCMS, the reaction intermediates underwent a series of successive degradation steps. Finally, these organic acids were decomposed to carbon dioxide to accomplish an entire mineralization process.
References
- Nigam P, Banat IM, Singh D, Marchant R (1996) Microbial Process for the Decolorization of textile effluent containing azo, diazo and reactive dyes. 31(5): 435.
- Pelegrini R, Peralta-Zamora P, De Andrade R, Reyes J, Duran N (1999) Electrochemically assisted photo Appl Catal B Environ 22(2): 83-90.
- Camp SR, Strurrock PE (1990) Water Res 24:1275.
- Vandevivere PC, Bianchi R, Verstraete W (1998) Treatment and reuse of wastewater from the textile wet-processing industry: Review of emerging technologies J Chem Technol Biotechnol 72(4): 289-302.
- Alvares AB, Diaper C, Parsons SA (2001) Partial oxidation by ozone to remove recalcitrance from wastewaters--a review. Environ Technol 22(4): 409-427.
- Dupont G (2002) La Teinture, Editions de lindustrie Textile 263pp.
- Allegre C, Moulin P, Maisseu M, Charbit F Treatment and reuse of reactive dyeing effluents (2006) J Membrane Sci 269(1-2): 15-34.
- Klemola K, Pearson J, Wright AV, Liesivuori J, LindstromSepp P (2007) Autex Res J 7(3): 224.
- Chung KT, Stevens SE (1993) Degradation azo dyes by environmental microorganisms and helminths. Environ Toxicol Chem 12(11): 21212132.
- Forgacs E, Cserhati T, Oros G (2004) Removal of synthetic dyes from wastewaters: a review. Environ Int 30(7): 953-971.
- Panizza, Cerisola (2009) Direct and mediated anodic oxidation of organic pollutants. Chem Rev 109(12): 6541-6569.
- Murugananthan M, Bhaskar Raju G, Prabhakar S (2004) Separation of pollutants from tannery effluents by electro flotation. Sep Purif Technol 40(1): 69-75.
- Muthukumar M, Thalamadai Karuppiah M, Bhaskar Raju G (2007) Sep Purif Technol 55: 198.
- Krishna Prasad R, Srivastava SN (2009) Electrochemical degradation of distillery spent wash using catalytic anode: Factorial design of experiments. Chem Eng J 146: 22.
- Comninellis C (1994) Electrocatalysis in the electrochemical conversion/combustion of organic pollutants for waste water treatment. Electrochim Acta 39(11-12): 1857-1862.
- Kapalka A, Foti G, Comninellis C (2008) Kinetic modeling of the electrochemical mineralization of organic pollutants for wastewater treatment. J Appl Electrochem 38(1): 7-16.
- Li XM, Wang W, Jiao ZK, Chen ZY (2001) Study on Electrolytic Oxidation for Landfill Leachate Treatment. China Water and Wastewater 17(8): 14-17.
- Borras C, Laredo T, Scharifker BR (2003) Competetive electrochemical oxidation of p-nitrophenol on Bi-doped PbO2 Electrochim Acta 48(19): 2775-2780. 2
- Vlyssides A, Barampouti EM, Mai S, Arapoglou D, Kotronarou A (2004) Degradation of methylparathion in aqueous solution by electrochemical oxidation. Environ Sci Technol 38(22): 6125-6131.
- Gotsi M, Kalogerakis N, Psillakis E, Samaras P Mantzavinos D (2005) Electrochemical oxidation of olive oil mill wastewaters. Water Res 39(17): 4177-4187.
- Rajkumar K, Muthukumar M (2011) Optimization of electro-oxidation process for the treatment of Reactive Orange 107 using response surface methodology Environ Sci Poll Res 19(1): 148-160.
- Korbahti BK, Aktas N, Tanyolac A (2007) Optimization of electrochemical treatment of industrial paint wastewater with response surface methodology. J Hazard Mater 148(1-2): 83-90.
- El-Ashtoukhy SZ, Amina NK, Abdelwahab O (2008) Removal of lead (II) and Copper (II) from aqueous solution using pomegranate peel as a new adsorbent. Chem Eng J 223(1-3): 162-173.
- Guven G, Perendeci A, Tanyolac A (2009) Electrochemical treatment of simulated beet sugar factory wastewater. Chem Eng J 151(1-3): 149159.
- Lundstedt T, Seifert E, Abramo L, Thelin B, Nystrom A, Pertensen J, Bergman R (1998) Experimental design and optimization. Chemom Intell Lab Syst 42: 3-40.
- Ranjan D, Srivastava P, Talat M, Hasan SH (2009) Biosorption of Cr(VI) from water using biomass of Aeromonas hydrophila: central composite design for optimization of process variables Appl Biochem Biotechnol 158b: 524.
- Ranjan D, Hasan SH (2010) J Parametric Optimization of Selenite and Selenate Biosorption Using Wheat Bran. Chem Eng Data 55: 4808.
- Saravanathamizhan R, Mohan N, Balasubramanion N, Ramamuthi V, Ahmed Basha C (2007) Evaluation of Electro-Oxidation of Textile Effluent Using Response Surface Method Clean 35: (4)-355-361.
- Korbahti BK (2007) Response surface optimization of electrochemical treatment of textile dye wastewater. J Hazard Mater 145(1-2): 277-286.
- Box G, Hunter WG (1987) Statistics for experimenters: an introduction to design, data analysis, and model building. Wiley Interscience.
- Clesceri LS Greenberg AE, Eaton AD (1998) Standard Methods for the Examination of Water and Wastewater, 20th ed, American Public Health Association, Washington, DC.
- Fereidouni M, Daneshi A, Younesi H (2009) Biosorption equilibria of binary Cd(II) and Ni(II) systems onto Saccharomyces cerevisiae and Ralstonia eutropha cells: application of response surface methodology. J Hazard Mater 168(2-3): 1437-1438.
- Thakur C, Srivastava VC, Mall ID (2009) Electrochemical treatment of a distillery wastewater: Parametric and residue disposal study. Chem Eng J 148(2-3): 496-505.
- Raghu S, Ahmed Basha C (2008) Dye destruction and Simultaneous Generation of sodium Hydroxide. Industr Eng Chem Resear 47: 5277.
- Crini G, Badot PM (2008) Application of Chitosan, a Natural Aminopolysaccharide, for Dye Removal from Aqueous Solutions by Adsorption Processes Using Batch Studies: A Review of Recent Literature. Prog. Polym. Sci 33: 399-447.
- Yavuz Y, Kaporal AS (2006) Electrochemical oxidation of phenol in a parallel plate reactor using ruthenium mixed metal oxide electrode. J Hazard Mater B136:296.
- Chen X, Chen G (2006) Sep Purifi Technol 48: 45
- Sakalis A, Mpoulmpasakos K, Nickel U, Fytianos K, Voulgaropoulos A(2005) Evaluation of a novel electrochemical pilot plant process for azodyes removal from textile wastewater. Chem Eng J 111(1): 63-70.
- Sanroman MA, Pazos M, Cameselle C (2004) Optimisation of electrochemical decolourisation process of an azo dye, Methyl Orange. J Chem Technol Biotechnol 74: 1349.
- Rajkumar K, Muthukumar M (201B) Response surface optimization of electro-oxidation process for the treatment of C.I. Reactive Yellow 186 dye: reaction pathways. Appl Water Sci 1-16p.
- Rajkumar D, Song BJ, Kim JG (2007] Electrochemical degradation of Reactive Blue 19 in chloride medium for the treatment of textile dyeing wastewater with identification of intermediate compounds. Dyes Pigm
- Seferoglu Z, Ertan N, Hokelek T, Sahin E (2008) Quantum chemical studies on the structures of some heterocyclic azo disperse dyes. Dyes Pigm yy: 614.
- Dignac MF, Derenne S, Ginestet P, Bruchet A, Knicker H, Largeau C (2000) Fate of wastewater organic pollution during activated sludge treatment nature of residual organic matter. Environ Sci Technol 34: 3389.
- Miao H, Tao W (2008] Ozonation of Humic Acid in water. J Chem Technol Biot 83: 336
- Li GT, Qu JH, Zhang XW, Liu HJ, Liu HN (2006] The progress of catalytic technologies in water purification: A review. J Mol Catal A-Chem 259: 238.


