


Abstract
This study takes the Ctrip travel platform as the research object and investigates the impact of platform functions and user experience on user satisfaction based on empirical data from 460 video comments and reviews. The findings indicate that, in terms of platform functions, the duration of promotional videos, advertising recommendations, and the content of promotional videos positively influence user satisfaction, while live shopping for scenic area hotels and membership services have negative impacts. Regarding user experience, factors such as stress relief, knowledge enrichment, interpersonal communication, entertainment, and keeping up with current events significantly enhance user satisfaction. Through binary logistic regression analysis, this study constructs a model of factors influencing user satisfaction and proposes targeted improvement suggestions, including optimizing live shopping functions, improving membership services, and comprehensively enhancing user experience. The results not only provide a theoretical basis for the optimization of the Ctrip travel platform but also offer references for other online travel platforms to improve user satisfaction.
Keywords:Ctrip travel; User satisfaction; Binary logistic Regression model
Introduction
According to the data released by the Ministry of Culture and Tourism of the People’s Republic of China, as of 2024, the number of domestic tourist trips in China reached 5.615 billion, an increase of 724 million compared to the same period of the previous year, representing a year-on-year growth of 14.8%. Based on the 54th Statistical Report on the Development of the Internet in China issued by the China Internet Network Information Center (CNNIC), as of June 2024, the number of Internet users in China reached 1.09967 billion, with an additional 7.42 million people compared to December 2023, and the Internet penetration rate was 78.0%. Online travel platforms have gradually been integrated into people’s daily lives, with mainstream travel platforms such as Ctrip Travel, Qunar Travel, and Tongcheng Travel becoming an indispensable part of people’s daily travel.
Ctrip Travel, as a leading domestic online travel service giant, has expanded its service scope from initially focusing on basic businesses such as air ticket and hotel reservations to now covering many fields including travel guides, car rental, ticket reservation, customized tours, and local entertainment, becoming the preferred reference platform for young people traveling. With the rapid development of Internet technology, the services provided by Ctrip Travel have become more diverse and richer. However, some problems have also been exposed, such as the untimely update of some travel product information, the uneven quality of promotional videos, and the need to improve the speed of handling user feedback.
Based on this, this paper selects Ctrip Travel, the largest domestic travel platform, to deeply explore its inherent defects and weak links, and provides relevant improvement measures, which has practical significance for promoting the future healthy development of Ctrip Travel.
Literature Review
Currently, a substantial body of research has been dedicated to examining the current state of the Ctrip travel platform, with studies spanning across various domains such as business expansion [1], service quality [2], user experience [3], and brand development [4]. For example, Lian [5] conducted an analysis of user booking behavior data on the Ctrip platform to identify the factors that influence users’ booking decisions. [6] evaluated the personalized travel recommendation service introduced by Ctrip. This service, which relies on big data for precise recommendations and is designed with user needs in mind, not only meets users’ personalized demands but also enhances their overall experience, thereby highlighting Ctrip’s innovative approach to personalized services. [6,7] focused on the platform’s hotel booking service, examining its current status, identifying issues, and proposing strategies for improvement. [8] provided recommendations for enhancing the quality of travel guide content on the Ctrip platform. [9] explored the profit model and operational costs of Ctrip, analyzing its profit forms and deficiencies during development. [10] conducted a survey on user satisfaction with hotel service quality on Ctrip, analyzed the factors affecting user satisfaction, and proposed an integrated improvement strategy that encompasses service efficiency, attitude, and content, while also constructing a framework for enhancing platform service quality [11].
Regarding user behavior and satisfaction on the Ctrip platform, [12] analyzed orders and comments related to “red tourism” on the platform to investigate the relationship between topics and user satisfaction. [13] tracked the travel products released by Ctrip to study the influencing factors of user review behavior. [14] took Ctrip’s travel routes as the research object, extracted user evaluation data on different routes, compared the demand characteristics of various routes, and revealed the negative factors affecting user satisfaction from multiple dimensions. [15] analyzed the relationship between user satisfaction and the willingness to use online travel platforms.
A comprehensive review of the literature reveals that the majority of existing studies have focused on business expansion, service quality, and user behavior of the Ctrip platform, while there is a notable lack of systematic research on users’ overall satisfaction with the platform experience. Therefore, this paper aims to bridge this gap by correlating the functions of the Ctrip platform with user experience. It investigates user satisfaction with various services on the platform and provides suggestions for its development by analyzing the main factors. This study seeks to explore a sustainable development path for the platform, promote its further improvement, and offer guidance for satisfaction research on other online travel platforms.
Research Hypotheses
This chapter proposes hypotheses regarding the factors influencing satisfaction on the Ctrip Travel platform based on the Theory of Planned Behavior [15] and related studies.
Platform functions
The functions and content design of online travel platforms have a direct and significant impact on users’ daily usage experience. For example, the duration of promotional videos, the precision of travel advertising recommendations, the quality of promotional video content, live broadcasts of scenic areas and hotels, and exclusive benefits of membership services-all these functions and content are directly experienced by users when they use the Ctrip Travel platform, providing them with the most immediate experience. Therefore, the quality of these platformrelated functions and content greatly affects users’ overall satisfaction with the platform.
During its development, the Ctrip Travel platform has introduced many functions and content that are highly popular among users. Unlike some other online travel platforms, Ctrip Travel places greater emphasis on enhancing user experience through high-quality promotional videos and precise advertising recommendations. The duration and content design of its promotional videos enable users to gain a more comprehensive understanding of travel products and services, thereby making more informed decisions.
The travel advertising recommendation function, through big
data analysis of user preferences and historical behaviors, provides
users with precise travel product recommendations, significantly
improving users’ decision-making efficiency and satisfaction. The
richness and professionalism of promotional video content help
users better plan their itineraries, while live broadcasts of scenic
areas and hotels allow users to intuitively understand the actual
conditions of these places, enhancing their trust. Additionally,
membership services, by offering extra discounts and privileges,
further increase user loyalty and satisfaction. Based on this, the
following hypotheses are proposed:
Hypothesis1: The duration of promotional videos on the
Ctrip Travel platform has a positive impact on satisfaction.
Hypothesis2: Travel advertising recommendations on the
Ctrip Travel platform have a positive impact on satisfaction.
Hypothesis3: The content of promotional videos on the Ctrip
Travel platform has a positive impact on satisfaction.
Hypothesis4: Live shopping for scenic area hotels on the
Ctrip Travel platform has a positive impact on satisfaction.
Hypothesis5: Membership services on the Ctrip Travel
platform have a positive impact on satisfaction.
User experience
Subjective norm refers to the influence of the external social environment on an individual’s specific behavior, that is, when predicting others’ behaviors, these external influences can have different effects on whether an individual will adopt a specific behavior. Derived from subjective norm is the impact indicator of user experience, such as stress relief, knowledge enrichment, interpersonal communication, entertainment, and keeping up with current events. These factors can greatly influence users’ choices of online travel platforms.
In today’s fast-paced life, users turn to online travel platforms
to meet a variety of psychological needs. For example, when
browsing the Ctrip Travel platform, users may relieve stress by
viewing travel guides, beautiful landscape pictures, and videos,
thereby obtaining a relaxing and pleasant experience. At the same
time, users acquire rich travel knowledge on the platform, such
as the culture, history, and customs of different destinations. This
not only broadens their horizons but also enhances their interest
in and anticipation of travel. In addition, the community functions
and user comment sections of the Ctrip Travel platform provide
a space for interpersonal communication, where users can share
travel experiences and exchange ideas, thereby enhancing a sense
of belonging and social satisfaction. The entertaining content
on the platform, such as interesting travel stories and videos
shared by travel influencers, also offers users a way to entertain
themselves. Finally, by browsing the latest travel news and guides
on the platform, users can keep up with current events and stay
informed about the latest travel trends. Based on the above
analysis, the following hypotheses are proposed:
Hypothesis6: The experience of relieving stress by browsing
the Ctrip Travel platform has a positive impact on satisfaction.
Hypothesis7: The experience of enriching knowledge by
browsing the Ctrip Travel platform has a positive impact on
satisfaction.
Hypothesis8: The experience of interpersonal communication
by browsing the Ctrip Travel platform has a positive impact on
satisfaction.
Hypothesis9: The experience of entertainment by browsing
the Ctrip Travel platform has a positive impact on satisfaction.
Hypothesis10: The experience of keeping up with current
events by browsing the Ctrip Travel platform has a positive impact
on satisfaction.
Research Design
Research method
Logistic regression is a type of generalized linear regression
analysis model, also known as logistic regression. It estimates
probabilities using its inherent Logistic function to measure the
relationship between one or more independent variables and a
dependent variable. It is considered the preferred method for
binary classification problems. Therefore, this paper selects the
binary Logistic model for regression analysis, where the functions
and user experience of the Ctrip Travel platform are used as
independent variables. The number of video comments and live
broadcast comments on the platform are used as proxies for
overall satisfaction with the Ctrip Travel platform and are treated
as the dependent variable. The dependent variable includes two
outcomes: “dissatisfied” and “satisfied,” that is, it takes only one
of two values. In the regression analysis, the explained variable
is a dummy variable, with values limited to 0 and 1, as shown in
Equation: 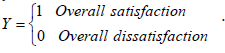
Logistic regression is a probabilistic nonlinear regression
model. It is a common method for analyzing the relationship
between relevant influencing factors and binary outcomes. The
dependent variable takes values of 0 or 1 and can be modeled based
on the linear regression model Y=α +β1X1 +...+βiXi (i =1,2,...n)
to establish the model formula. Assume that the probability
of user satisfaction with the Ctrip Travel platform is 0(0≤P≤1),
then the probability of dissatisfaction is (1-P), and it is assumed
that P is a linear function of the independent variables.
Introducing the impact of various services on the video
platform into the above formula to establish the model formula
 .
.
Here, β represents the coefficients of the impact of each
service, with its absolute value indicating the degree of influence
of each service. α is the constant term, and μ is the error
term. Since the values on the left side of the model are limited to
0 and 1, while the values on the right side of the equation cover
the entire real number set, the change in the dependent variable
is not proportional to the change in the independent variables.
Therefore, it is necessary to perform a Logit transformation on
the linear function P denoted as Logit(P), which is expressed as
Equation  .
.
After this transformation, the range of values for Logit(P) also
covers the entire real number set. Based on Equation 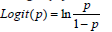 , the Logistic regression model is established, resulting in Equation

In which P has a correlation relationship with the independent
variables 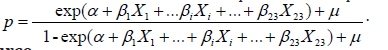
Data source
This paper draws on the data acquisition methods of existing scholars. Using the Octopus data crawler, we scraped the text data from the comments and bullet comments of the recommended videos on the homepage to obtain data reflecting user sentiment. A total of 460 pieces of data were collected and stored in a CSV file. We manually evaluated the sentiment of the comment text data, categorizing them as either “satisfied” or “dissatisfied.” Videos that were popular recommendations, had over 500,000 views, more than 10,000 likes, over 1,000 coins, or had the “One More Time” tag were labeled as “satisfied,” while the rest were labeled as “dissatisfied.” An example is shown in Table 1.


Empirical Analysis
Reliability analysis
To investigate the reliability of the data, reliability analysis is typically conducted. Reliability refers to the consistency and dependability of the test results. Cronbach’s reliability analysis is one of the most widely used methods, which describes the level of reliability based on a single metric, the Cronbach’s alpha coefficient (α value). If the α value is greater than 0.6, it indicates that the reliability of the data is acceptable, and the higher the reliability coefficient value, the greater the reliability.
In this paper, SPSS was used to analyze the data. As shown in Table 2, the α value corresponding to the overall satisfaction of the platform is 0.819. The α values for the satisfaction with platform functions and user experience are 0.722 and 0.801, respectively, both of which are above 0.6, indicating that the reliability of the data collected in this study is good. Additionally, according to the results in Table 2, the α values for individual measurement variables related to the platform are also above 0.6, which further confirms the high reliability of the data, making it suitable for research purposes.
Validity analysis
Validity analysis employs factor analysis to measure the degree of validity and is used to assess construct validity. Before conducting factor analysis, it is common to examine the interrelationships among the items. Therefore, this paper analyzes the relevant indicators using the KMO measure and Bartlett’s test of sphericity to examine the validity of the data. When the KMO value exceeds 0.7, it indicates that the data have strong interrelationships and are suitable for factor analysis.
In this study, validity analysis was conducted using SPSS software, and the detailed results are presented in Table 3. According to the data in the table, the KMO value is 0.801, which is greater than 0.7. The Bartlett test shows a p-value of 0.000, with Sig < 0.01. Additionally, the validity of the latent variables was examined, and the validity values for satisfaction with platform functions and user experience were both above 0.7, indicating high validity and strong interrelationships. Therefore, the data can be used for factor analysis.
Factor analysis
Factor analysis, as a widely used statistical method, is primarily based on the idea of dimensionality reduction. By reducing dimensions, variables with high correlations are grouped together, thereby reducing the number of variables that need to be analyzed and simplifying the complexity of the analysis. This method explores the correlation matrix among variables and groups them based on the degree of correlation, resulting in higher correlations within groups and lower correlations between groups. The new variables that represent the basic structure of each group are called common factors. Factor analysis can aggregate a large number of complex variables into a few common factors that reflect the main information of the original variables without or with minimal loss of information. This effectively reduces the number of variables while revealing the intrinsic relationships among them, which is its significant advantage.
To better investigate user satisfaction with the Ctrip Travel platform, this section employs factor analysis to identify the factors that influence the research variables through dimensionality reduction.
The reliability and validity analyses conducted show that the designed data are suitable for factor analysis. Based on this, when studying user satisfaction with the video platform, the factor analysis method chosen is principal component analysis. During the research, a total of 3 factors were constructed, with a cumulative explained variance of 60.250%.
In Table 4, the rotated component matrix of factors is presented. By analyzing the content of the table, the aforementioned 10 indicators can be categorized into 3 factors. The analysis reveals that the first factor includes 5 variables, representing user experience, which involves stress relief, knowledge enrichment, interpersonal communication, entertainment, and keeping up with current events. The second factor encompasses video duration, video content, and live shopping, totaling 3 factors. The third factor includes 2 variables, namely membership services and advertising recommendations. Among them, the second factor is referred to as Platform Function (I), and the third factor is called Platform Function (II), with both factors collectively representing platform functions in Table 5. After completing the aforementioned factor analysis, it is necessary to assess the quality of the results obtained from the factor analysis. This process typically employs principal component analysis to make judgments, identify the common factors that exist, and analyze the communalities to determine the quality of the data items that have been organized. The analysis results are shown in Table 6.
The analysis of the data in the table shows that the communality values for each observed variable are generally high, indicating that the statistical results reflected by the data organization in this study are satisfactory.
Logistic regression model results
Since the Logistic model is not suitable for variables with multicollinearity, it is necessary to conduct a suitability test for the model before establishing it. In this study, SPSS software was used to perform the regression analysis. Platform functions and user experience were used as explanatory variables, while overall platform satisfaction was treated as the explained variable. The analysis results are shown in Table 7.
Through linear testing of the sample data values, Table 8 shows that the adjusted R-squared is 0.385, and the Durbin- Watson value is 1.640, which remains close to 2, indicating that the equation established through regression analysis has a good correlation effect. The tolerance values of the 10 independent variables are all greater than the threshold of 0.1. The VIF values of the independent variables are 9.494, all less than the threshold of 10. The eigenvalues of the independent variables are not zero, which confirms that there is no significant multicollinearity among the variables. Therefore, the Logistic model can be used to perform regression analysis on the data.
Using SPSS to conduct Logistic regression analysis on each independent variable and the overall satisfaction as the dependent variable, all variables were included in the regression equation. Then, significance tests were performed on the independent variables to generate a relatively significant Logistic regression equation for each variable.
After five iterations, Table 8 shows the Hosmer and Lem show test results obtained from the analysis. The degrees of freedom are 0.722, which is greater than 0.6, indicating a good model fit.
Table 9 displays the results output by SPSS. The regression equation includes 10 variables, and the final statistical model obtained is

Here, X1 to X10 represent video duration, membership services, presence of advertisements, video content, live shopping, interpersonal communication, knowledge enrichment, stress relief, entertainment, and keeping up with current events, respectively. The odds ratios (Exp(B)) for each variable are 1.283, 1.190, 0.825, 1.309, 0.861, 1.159, 1.116, 1.173, 1.161, and 1.196, respectively.
Logistic model regression results
In the constructed regression equation, 376 users were overall satisfied with the Ctrip Travel platform, of whom 373 were correctly predicted, yielding an accuracy rate of 99.2%. Among the 84 dissatisfied users, only 8 were correctly predicted, with an accuracy rate of 9.5%. The overall prediction accuracy was 82.8%.
Conclusion and Implication
Conclusion
This study analyzed the impact of platform functions and user experience on overall satisfaction by crawling and analyzing live broadcast comments and review data from the Ctrip Travel platform. The findings indicate that, in terms of platform functions, the duration of promotional videos, advertising recommendations, and the content of promotional videos positively influence user satisfaction, while live shopping for scenic area hotels and membership services have negative impacts. Regarding user experience, factors such as stress relief, knowledge enrichment, interpersonal communication, entertainment, and keeping up with current events significantly enhance user satisfaction. Through binary logistic regression analysis, this study constructs a model of factors influencing user satisfaction and proposes targeted improvement suggestions, including optimizing live shopping functions, improving membership services, and comprehensively enhancing user experience.
As a leading domestic online travel service platform, Ctrip Travel has unique strengths in function design and user experience. Compared to other platforms, Ctrip places greater emphasis on enhancing user satisfaction through high-quality content and functions. The design of video duration and content allows users to gain a comprehensive understanding of travel products and services, thereby obtaining richer information and a more complete experience. Additionally, Ctrip’s travel advertising recommendation function, through precise big data analysis, provides personalized travel product recommendations, significantly improving users’ decision-making efficiency and satisfaction.
In terms of user experience, Ctrip Travel satisfies users’ diverse needs through rich content and functional design. For example, users can relieve stress by viewing travel guides, beautiful landscape pictures, and videos, thereby obtaining a relaxing and pleasant experience. The travel guides and information on the platform provide users with rich knowledge, helping them better plan their trips and enhancing their interest in and anticipation of travel. Moreover, the community functions and user comment sections of the Ctrip Travel platform offer a space for interpersonal communication, where users can share travel experiences and exchange ideas, thereby enhancing a sense of belonging and social satisfaction. The entertaining content on the platform, such as interesting travel stories and videos shared by travel influencers, also provides users with ways to entertain themselves. Finally, by browsing the latest travel news and guides on the platform, users can stay updated with current events and understand the latest travel trends. Besides, the study found that live shopping for scenic area hotels and membership services negatively impacted user satisfaction in some cases. This may be due to shortcomings in the user experience of live shopping for scenic area hotels, such as untimely updates of live content and insufficient interactivity. Regarding membership services, the gap between the promotion of membership benefits and the actual experience may lead to low user satisfaction.
Implication
Based on the results of the study, the current live shopping and membership services provided by the Ctrip Travel platform negatively impact overall user satisfaction, while the browsing experience on the platform positively influences overall satisfaction. Therefore, the platform should continue to enhance relevant functions. This section proposes strategic planning and optimization measures based on the conclusions and open suggestions from users.
Optimize live shopping function
Ctrip Travel should strengthen the planning and management of live content to ensure its timeliness and interactivity. Adding interactive elements between hosts and viewers, such as real-time Q&A and time-limited discounts, can enhance user participation and shopping experience. Additionally, optimizing the live interface design to make it more intuitive and user-friendly will improve usability. The platform should also enhance quality control of live-sold products to ensure they meet user expectations, thereby increasing user satisfaction with the live shopping function.
Optimize membership service function
Ctrip Travel needs to further refine its membership benefits system. Through user surveys and other methods, the platform should gain a deeper understanding of members’ needs and expectations and adjust the membership benefits accordingly. For example, adding exclusive discounts on travel products, priority booking rights, and free upgrade services can enhance members’ actual sense of gain. Furthermore, promoting membership benefits through various channels, such as the platform homepage, email notifications, and SMS alerts, will ensure members are fully informed and can enjoy the privileges offered by the platform, thereby increasing loyalty and satisfaction.
Strengthen overall user experience
Ctrip Travel should continuously optimize the overall user experience of the platform. In terms of content, maintaining high-quality promotional videos and travel guides, ensuring the accuracy and practicality of information, will help users better plan their trips. Functionally, enhancing the platform’s usability and convenience, such as optimizing search functions and simplifying booking processes, is essential. In terms of social interaction, strengthening community building and encouraging users to share travel experiences will enhance communication and interaction among users. Additionally, the platform can regularly host online activities, such as travel photography contests and guide-sharing competitions, to increase user engagement and platform activity. These measures will enable Ctrip Travel to comprehensively enhance user experience, thereby increasing user satisfaction and loyalty.
References
- Dong TT, Liu R, Meng XF (2024) Service design for corporate promotion of sustainable lifestyles: A case study of Ctrip's LESS Sustainable Travel Program. Zhuang Shi (9): 90-97.
- Qi J, Lu ZX (2024) Expression of “rurality” and scene construction of rural tourism destinations from the perspective of the youth. China Youth Studies (4): 25-34.
- Gao Z, Cheah JH, Lim XJ, Imm SNG, Cham TH, et al. (2024) Can travel apps improve tourists’ intentions? Investigating the drivers of Chinese Gen Y users’ Journal of Vacation Marketing 30(3): 505-534.
- Gao Z, Chang JYS, Lim XJ, Cham TH, Sigala M (2025) What makes users recommend their mobile travel app? Findings from an innovation diffusion and social exchange theory perspective. International Journal of Tourism Research 27(5): e70117.
- Lian, JQ (2024) From strategic segmentation to strategic collaboration: CSR marketing cooperation and coordination of digital tourism O2O supply chain enterprises. Tourism Review 8(5): 47-75.
- Lv JJ (2024) On the antitrust regulation of personalized pricing issues in life service platforms. Times Economics and Trade 21(9): 47-49.
- Peng JM, Chen JQ, Huang T (2025) The formation of memorable hotel experiences from the perspective of long-term memory: A case study of Sanya Atlantis Hotel. Tourism Tribune 40(10): 54-68.
- Jia WT, Huang ZF, Bao JQ (2023) Spatial-temporal differences in scenic area accessibility based on high-speed rail “door-to-door” travel: A case study of Shanghai-Nanjing intercity travel. Tourism Tribune 38(2): 148-159.
- Liu Y, Xu ZY (2023) The connotation, challenges, and promotion mechanisms of cultural and tourism digitalization. Qinghai Social Sciences (2): 80-93.
- Tong T, Lu XL (2025) A study on customer satisfaction of Hotel H based on Ctrip travel network review data. Business and Exhibition Economy (9): 84-87.
- Yuan WH (2025) Construction of red tourism immersive experience model based on online text analysis of red culture elements. Western Tourism (19): 1-4.
- Zhu BQ (2025) Media image and discourse practice of Internet-famous rural scenic spots: A case study of Wuyuan Huang ling. Science and Technology Communication 17(20): 105-110.
- Xie JL, Xiang QY, Ding YF (2021) Research on the creation path of sports-culture-tourism belt in the lower reaches of the Yellow River. Journal of Shandong University of Finance and Economics 33(6): 67-76+85.
- Chen CF, Chen YX (2023) Investigating the effects of platform and mobility on Maas users’ service experience and behavioral intention: Empirical evidence from MeNGo, Kaohsiung. Transportation 50(6): 2299-2318.
- Ajzen I (1991) The theory of planned behavior. Organizational Behavior and Human Decision Processes 50(2): 179-211.


