Abstract
Keywords:Tourism; Geographical congress; Landscapes; Valleys; Ecosystems; Lake; global expansion; Mammoth mountain
Introduction
Besides being the coldest place in the Northern Hemisphere, Yakutia is also known as the global capital of permafrost. In 1966, the Permafrost Institute of the Siberian Branch of the USSR Academy of Sciences successfully hosted the VIII Interdepartmental All-Soviet Union Geocryological Meeting, completed with a field trip to the remarkable “Mammoth Mountain” exposure on the Aldan River. In 1969, the Institute spearheaded the effort to organize the challenging international symposium, “Paleogeography and Periglacial Phenomena of the Pleistocene,” in Yakutsk. In 1973, hosting the II International Conference on Permafrost in Yakutsk brought the Permafrost Institute enhanced prestige and global recognition. Over 700 people attended, including 400 delegates, of whom 119 were foreign delegates from 14 countries.
The 1970s marked the beginning of Yakutia’s rise as a global diamond mining hub. Therefore, the Permafrost Institute’s 1975-76 scientific tour (E-12) included Central Yakutia’s thermokarst lakes, the Vilyui Reservoir, and the Mir diamond mine, aligning with the XIII International Geographical Congress. The International Permafrost Association Action Group “Permafrost and Culture” organized a field trip and working meeting in Yakutsk in July 2015, called “Yakutsk - Раc 2015”.
Potsdam, Germany hosted the 11th International Conference on Permafrost in 2016. Field trips to key permafrost areas have become a tradition at permafrost conferences. The 11th ICOP organizers requested the Melnikov Permafrost Institute to arrange a field excursion in Central Yakutia. This was since in recent decades Yakutia has attracted scientists with its unique permafrost landscapes and unprecedented intensity of cryogenic processes. Also, within the framework of the conference two more field trips were organized - to Spitsbergen and to the Alps. These findings demonstrate that permafrost landscapes could be used for scientific tourism [1].
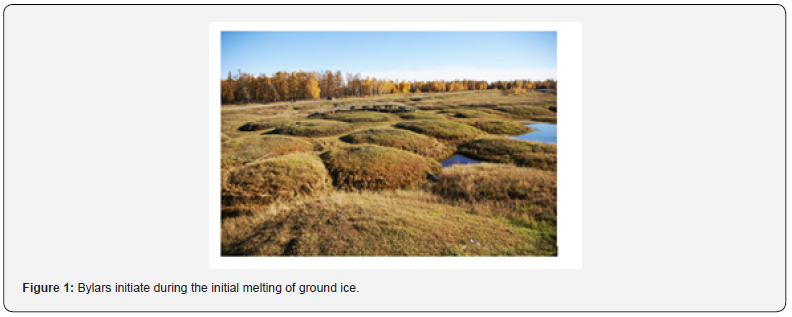
Landscapes developing on permafrost are defined by periglacial processes including frost heave, thermal erosion, and solifluction. Thermokarst creates alas, tympy, dyuedya, and bylar landforms (Figure 1); thermal contraction produces polygonal ground; solifluction creates terraces; heaving creates frost mounds; and many other landforms result from these processes. The Sakha Republic (Yakutia) is mostly covered by taiga and tundra. These landscapes include diverse ecosystems such as forests, meadows, alases, thermokarst lakes, bogs, steppes, icings (taryns), periglacial sand dunes (tukulans) and others. Every landscape type is unique and forms under specific geographical, climatic, geological, and biological conditions.
The Arctic desert occupies the New Siberian Islands archipelago north of 74°N, except for Bolshoy Lyakhovsky Island. Arctic islands and coasts, covering roughly 10% of Yakutia, are occupied by the tundra. Forest tundra is distinguished by its uneven distribution, bridging the taiga and tundra biomes. Coniferous forests, dominated by larch, define the taiga biome. Yakutia’s landscapes commonly feature meadows spread across alases, floodplains, river terraces, and gentle hillslopes.
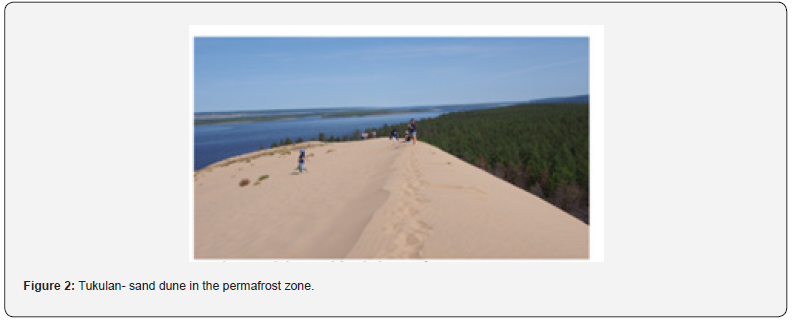
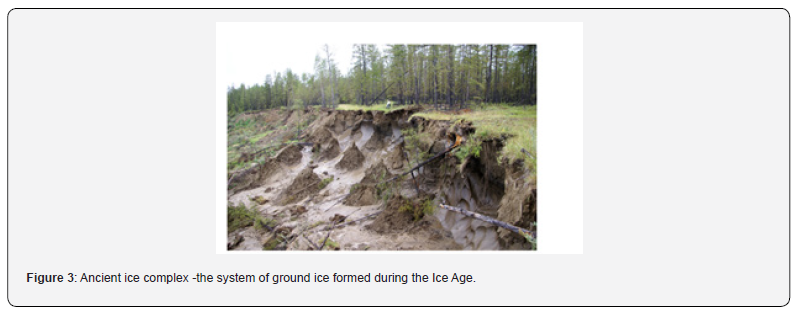
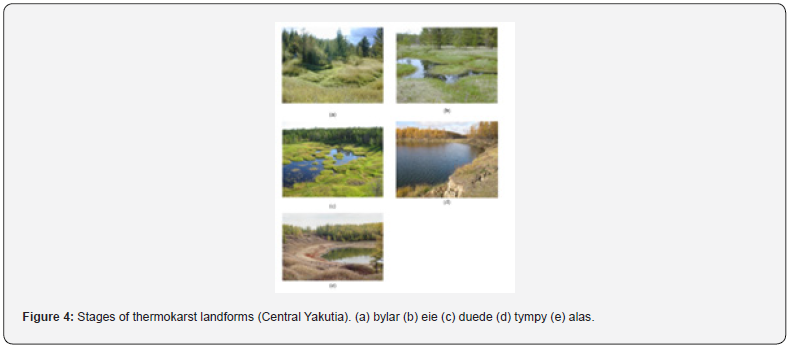
Swamps with sparse larch forests (mari) typically occur in poorly drained, gently sloping lowlands of watersheds. Tukulans are ancient alluvial sands formed during glaciation (Figure 2). Steppes are found in the Lena, Vilyui, and Amga valleys, on south- facing slopes and valley flanks in the middle Yana and Indigirka River areas. The formation and evolution of thermokarst lakes result from the thawing ground ice (Figure 3). Bylar, eie, dyuedya, and tympy represent the consecutive phases in thermokarst lake development (Figure 4).


Alases represent the final phase of thermokarst lake evolution. These gently sloping, flat-bottomed depressions, with thermokarst lake remnants and meadow-steppe vegetation, result from melting ground ice. The freezing of Alas Lake Talks creates perennial mounds with an ice core, known as ‘bulgunniakh’ or ‘hydrolaccoliths’ (Figure 5).

The formation of an icing, or aurei’s, occurs in winter on the ice covering rivers or lakes because of pressure discharge from surface and ground water when river channels or aquifers freeze (Figure 6). Consequently, the unique and interesting nature of permafrost landscapes makes them ideal for scientific tourism, a field experiencing global expansion [2].

The Environments of the 2020 Lisbon Green City Goals
Lisbon is the capital of Portugal and its largest city, with the municipality population reaching over 545,000 according to the 2021 Census (INE, 2023). It is on the southeast coast, the country’s main port and political and commercial center. Lisbon has experienced significant challenges in the past, particularly in 1755 when on 1 November an earthquake and tsunami devastated around 2000 of the 20,000 existing dwellings and left more than two-thirds uninhabitable [38], becoming “one of the most important eighteenth-century urban design achievements in Western Europe” [38,39].
More recently, the global economic downturn of 2008 greatly affected Portugal. Still, despite such challenges, Lisbon has made strides in cementing the city’s environmental sustainability strategy and in turn enhancing the quality of life of its citizens, showing that environmental protection and economic growth can go hand in hand [38]. The vegetable gardens and greens since the Middle Ages have been a) the sea as never felt before, b) the sea is our land, c) drawing in notebooks and photographs, d) exhibition on historical gardens in Lisbon, e) paper cities like reprints and arming constructions and f) exhibition of the master of the landscape [40]. “Rather than reiterating narratives of urban entrepreneurialism as dominated by narrow economic agendas and being socially exclusionary, this form of urban entrepreneurialism encourages us to look at cities as places that can be coproduced in context-sensitive ways by multiple entities” as say [41] about Bristol Green City in 2015 Table 2. The Sustainable Urban Mobility Lisbon, following the guidelines of the European Institute of Innovation and Technology (2023) has a cohesive city-wide vision for sustainable mobility and is achieving this through measures to restrict car use and prioritize walking, cycling, and public transport. In 2017 Lisbon launched a bikesharing scheme, with electric bikes comprising two-thirds of the fleet to encourage cycling in the hillier parts of the city [42].
Sustainable Land Use, Lisbon is committed to protecting and enhancing its natural areas while providing quality outdoor recreational space for citizens because of leisure spaces and social purposes [43]. This is exemplified in Lisbon’s management of Monsanto Park, for which the city has received the Sustainable Forest Management Certification. Like other cities, Green Growth & Eco-Innovation Lisbon is working towards a fully integrated city, employing a holistic approach to urban planning that considers all aspects of the city, including water, mobility, waste, education, and employment [2]. The city involves many stakeholders, such as citizens, businesses, academia, and international partners, in its policies and programs for urban innovation and urban agriculture [44]. The city also creates new green space along this corridor, allowing wildlife to flourish and protecting its biodiversity [45]. At the beginning of the century, there was a vital concern about the quality of life in cities from public policies [46].
Mike Childs in his forward to McLaren & Agyeman’s book (2015, vii) stated that “When Mayor of London Ken Livingstone, Mayor Michael Bloomberg from New York, and others set up the C40 Cities Network a decade ago, they had the vision that cities will be the locations where the world’s greatest environmental challenges will be solved”. Therefore, by 2030, Lisbon must guarantee everyone’s access to safe, adequate, and affordable housing, including its inherent essential services, and improve conditions in slums, like other cities in the EU (Lisbon Declaration on the European Platform on Fighting Homelessness, 2021).
In addition, it provides access to safe, accessible, sustainable, and affordable transport systems for all, improving road safety through the expansion of the public transport network, with particular attention to the needs of people in vulnerable situations, women, children, people with disabilities, and the elderly [40]. It increases inclusive and sustainable urbanization and capacities for participatory, integrated, and sustainable citizen consent planning and management in all appropriate locations in the city, according to the “2030 Agenda for Sustainable Development” [47,48]. It strengthens efforts to protect and safeguard cultural and natural heritage. Significantly reduces the number of deaths and the number of people affected by disasters and substantially the direct economic losses caused by this route in the Gross Domestic Product (GDP), including water-related cataclysms, focusing above all on protecting the most vulnerable people in situations of greater vulnerability to rare violent phenomena [49]. Reduces per capita negative environmental impact in cities by paying particular attention to air quality and municipal and other waste management [49,50].
Provide universal access to safe, inclusive, accessible, and green public spaces, particularly for women and children, older persons, and persons with disabilities phenomena [51]. Supports positive economic, social, and environmental relationships between urban, peri-urban, and rural areas, strengthening national and regional development planning [49]. Substantially increases the number of cities and human settlements that have adopted and implemented adopting and implementing integrated policies and plans for inclusiveness, resource efficiency, climate change mitigation and adaptation, and disaster resilience [52]. and finally develops and implements holistic disaster risk management [30]. The strengthening and improvement of the risks of disasters and accidents, natural or man-made manufactured, are in line with the Sendai Framework for Disaster Risk Reduction 2015- 2030 (United Nations, 2015) adopted at the Third United Nations World Conference in Sendai, Japan, on March 18, 2015, supported by the United Nations Office for Disaster Risk Reduction at the request of the UN General Assembly United Nations, 2015 [53-55].
Methodology
According to [56,57], the study was based on structured questions “sampling by convenience”. The sample was collected in 2020, using a non-probabilistic sampling method, due to accessibility and based on the principle that they can represent the population under analysis by “sampling by convenience”. For this purpose, 320 surveys were carried out. However, the sample was reduced to a set of 241 validated answers. It should be noted that 2020 was the beginning of the COVID-19 pandemic, having greatly conditioned the flow of tourism without historical precedents (INE, 2021). The global structure of the total sample is presented in Figure 1.
The Research Model
The statistical analysis started with the examination of statistical measures, such as the mean and standard deviation, in addition to the relative frequencies. We began by analyzing the Alpha Cronbach test to examine the internal consistency of each survey’s dimensions we studied. This section presents the model and methods of this work, providing the general framework of the research model. Statistical Methods and Techniques Used Data processing was performed using the SPSS26 software Table 3.

General model
The proposed research model is presented schematically
in Figure 2, which evaluates the Perception of Tourists Visiting
Lisbon (PTVL) relating to their profile as a) the Reasons for the
Visit, b) the Tourist Experience of the Visit, and c) the Perception
of the Historical Heritage. They are presented under the following
hypothesis:
Hypothesis 1 (Η1): The perception of tourists visiting Lisbon
about the Reasons for the Visit is positively related to the Tourist
Profile.
Hypothesis 2 (Η2): The perception of tourists visiting Lisbon
about the Tourist Experience for the Visit is positively related to
the Purpose of the Visit.
Hypothesis 3 (Η3): The perception of tourists visiting Lisbon
about the Tourist Experience of the Visit is positively related to
the Perception of Historical Heritage.
The present model defines the fact that Tourist Profile (Profile) and Perception of Historical Heritage (Perception) are independent variables (exogenous constructs), and Reasons for the Visit (Reasons) and Tourist Experience of the Visit (Experience) are dependent variables (endogenous variables). As presented in Figure 1, four constructs (two exogenous and two endogenous) and the four hypotheses are defined to represent the research model.
Based on the relations defined among the variables in the theoretical model, it becomes feasible to prove the hypotheses established by applying the modeling technique called Structural Equation Modeling (SEM). This multivariable analysis for linear models is the basis methodology for this study. Employing the SEM method, two sub-models are defined to statistically validate the rest [58,59] each model: the Structural Model (SM) and the Measurement Model (MM). In SM, the relationship between constructions (exogenous and endogenous) is established and influences how independent constructions affect the dependent constructs. In MM, the ties among constructs and their manifested variables are evaluated. Both sub-models will apply to be the Confirmatory Factor Analysis (CFA).
Data collection
Based on the literature review, a set of manifested variables was found to define the constructs, presented in Table 1.
A survey was conducted among Lisbon tourists, using the variables shown in Table 1 to collect data. Each variable was considered an answer based on a 5-point Likert scale: 1 – completely disagree and 5 – agree. The sample obtained was 241 validated answers, overcoming the defined value by Westland (2010) for the minimum sample size Table 4.

Source: own elaboration.

Source: own elaboration.

Source: own computation.

Source: own computation.

Models’ indicators for fitness and validation
To analyze the quality of the data collected in the established
models, an evaluation of the models (SM and MM) is required
concerning the fitness and the validity of the manifest variables.
In this research, the most common validation indices are:
a) Absolute indices: x2/df ratio (chi-square and degrees of
freedom ratio) and Goodness of Fit Index (GFI
b) Relative indices: Comparative Fit Index (CFI) [60] Tucker
Lewis Index (TLI) and Incremental Fit Index) [60]. (IFI)
c) Parsimony-adjusted index: Parsimony CFI (PCFI)
[61,62].
d) Population discrepancy index: Root Mean Square Error
of Approximation (RMSEA) [60].
e) Information theory-based index: Akaike Information
Criterion (AIC) [63].
f) The adjustment indices values and criteria to evaluate
the fit of each index are presented in Table 2.
Results
The parameters of the SM and MM were achieved using the SPPS Amos and SEM software and employing the Maximum Likelihood Method. Factorial weights, fitness, and errors are presented for the SM and the MM in Figure 3 & 4 respectively.
Practically all manifest indicators have significant factorial weight in their constructs, except the manifested variable Age (Profile2) in the construct Tourist Profile (Profile). This means that, based on the collected data, this variable does not influence the characterization of the Tourist Profile. Concerning the adjustment indices’ quality, the SM and the MM adjustments validation were plotted by the software Amos and are presented in Table 3.
An assessment of the theoretical sub-models is feasible under the values obtained in Table 3. The values of the adjustment quality in the Structural Model (SM) (x2/df = 3.09, GFI = 0.91, CFI = 0.90, TLI = 0.86, IFI = 0.90, PCFI = 0.69, RMSEA = 0.093, and AIC = 211.392) and the Measurement Model (MM), (x2/df = 1.95, GFI = 0.94, CFI = 0.96, TLI = 0.93, IFI = 0.96, PCFI = 0.70, RMSEA = 0.063, and AIC = 153.482) reveal that fair and good adjustments are achieved in both models, leading to an overall statistical fit in SM and MM. Table 4 shows the adjustment validation of the values obtained in the SEM software to estimate the structural relationships in the SM among the constructs.
In the SM model, all hypotheses were confirmed (p-values of,
Η1, Η2 and Η3 are less than 0.05). Based on the proposed model, the
results of this research prove that there is a relationship between:
a) The tourist profile with the reason for the Reasons for
Visit.
b) The purpose and the Tourist Experience of the Visit.
c) The Perception of the Historical Heritage and the
Touristic Experience of the Visit.
Discussion
The response to the challenges sets out above will be decisive in the Sustainable Development agenda and represents an opportunity for innovation with a focus on economic, environmental, and social progress, and with the intervention of all agents of the urban ecosystem – citizens, schools, local authorities, companies, and other organizations. For the United Nations (2023), it is the eleventh in seventeen of the Sustainable Development Goals – making cities and communities resilient. Among Portuguese cities, many have made sustainability a priority. Lisbon has been a pioneer in this effort and, for that very reason, received the European Green Capital 2020 award. By 2023, Lisbon must become a more sustainable urban city with mobility – of which the advances in the monthly transportation tickets are an excellent example, the preservation of green spaces and biodiversity, air quality, the fight against noise pollution and waste, efficient management of water and energy, sustainable growth, eco-innovation, and governance. The United Nations created the ranking of sustainable and environmental priorities in which the tourism sector is represented [64].
It is helpful for the community to know that cities with organized municipal governments pay back the collected taxes, in return for their goods and services. We know that in these cities the population pays relatively equitable taxes. The example comes from the European cities presented with this award aimed at focusing management results on “Best Quality of Life”. The Green Capital of Europe award has attracted wide interest in Europe. Until 2020, since its launch in 2010, 46 cities in 22 European countries competed for the title. Stockholm and Hamburg, Green Capitals of Europe for 2010 and 2011, are examples of how environmental protection and economic growth can be mutually supportive and coexist in relatively large cities [65]. With urban populations set to grow further, we face increasing pressures related to housing, transport, waste disposal, energy, and streams below ground. At the same time, we like to live and work in cities with clean air, easily accessible green spaces, well-managed waste and water systems, pedestrian and cycle facilities, and public transport.
These aspects make a city healthy and help create a sustainable urban environment for current and future generations. This European Green Capital award shows local efforts to improve the urban environment and promote sustainable growth cities [66- 70]. Cities must share ideas and encourage their counterparts to develop creative solutions for a sustainable way of life. Something ends up staying, such as innovative solutions to the environmental challenges that medium-sized cities face. More than 400 mediumsized cities in Europe have populations ranging from 100,000 to half a million. The European Green Capital competition ultimately aims to transform cities into more pleasant places to live and work. As the competition for Europe’s Green Capital in 2025 has been launched, we would like to see cities encouraged to take advantage of this opportunity to review and publicize their environmental credentials and plan a sustainable future for their citizens.
Conclusion and Lines for Future Research
For the EU, each Green Capital of Europe award is given annually to a European city with more than 100,000 inhabitants which is an example in terms of environmental, social, and economic sustainability. The submitted application demonstrates its path and the goals to be achieved for the seven sustainability indicators: i) air quality, ii) noise, iii) water, iv) nature, biodiversity, and sustainable land use, v) waste and circular economy, climate change, vi) mitigation and vii) adaptation. Lisbon is taking steps to meet these targets. Commitments to climate neutrality and zero waste, guarantees to environmental education, and structuring projects were some of the many highlights for a green Lisbon shortly. From the outset, it joined and led the work of the various institutions in the municipal perimeter, along with other public and private institutions, emphasizing tourism. As we can see from the framework of reliability statistics, the questions that make up the survey are of excellent reliability. It should be noted that the sum gives more than 100% because some respondents answered with more than one option, especially those who came for work and to participate in conferences and ended up staying in the city for leisure. Measurable variables are scientifically supported. The aggregation criterion in question blocks allowed the disaggregation of the variables and their integration into the respective groups. This is a partial work in order not only to relate the Green City to sustainable tourism but also to apply this link to sustainable tourism practices in an urban context, such as the city of Lisbon cities [71-76].
For future studies, we aim to apply preliminary analysis to the data (missing data and outliers) and perform descriptive data analysis. For example, if the missing data in each variable is more significant than 10% of the total, replacing it with the median of the scale will most certainly generate later problems of collinearity, being preferable to suppress it, or perhaps it is better to reduce the sample size excluding respondents that may contaminate these variables. Eventually, other data analyses will be carried out, also checking if more than a second-order factor emerges, through the construction of a model following its sequence, always using reflective constructs, and finally, a CFA analysis, using AMOS, which matches well with SPSS software.
References
- Ivanova RN (2016) Permafrost Landscapes as Objects of Scientific Tourism. In: Ivanova RN, Fedorov AN, Günther F, Morgenstern A (Eds.), Bibliothek Wissenschaft spark Albert Einstein. XI International Conference on Permafrost, Potsdam, Germany, p. 1209.
- Fedorov AN (2022) Permafrost Landscape Research in the Northeast of Eurasia. Earth 3(1): 460-478.


