Experimental Design Approach for Chromatographic Determination of Ketorolac Tromethamine from Bulk Drug and Tablet Formulation
Manwar JV, Patil SS, Bhalerao CA, Mandpe SR and Kumbhar DD*
KYDSCT College of Pharmacy, India
Submission: June 17, 2017; Published: July 20, 2017
*Corresponding author: Deepak D Kumbhar, KYDSCT’s College of Pharmacy, India, Tel: +91 8605145029; Email: dipakkl6@gmail.com
How to cite this article: Manwar JV, Patil SS, Bhalerao CA, Mandpe SR, Kumbhar DD. Experimental Design Approach for Chromatographic Determination of Ketorolac Tromethamine from Bulk Drug and Tablet Formulation. Glob J Pharmaceu Sci. 2017; 3(2): 555609. DOI: 10.19080/GJPPS.2017.03.555609
Abstract
Experimental design was successfully employed for chromatographic determination of ketorolac tromethamine from bulk drug and tablet formulation. The effect of simultaneously varying the flow rate, temperature and concentration of methanol in mobile phase water (0.05% w/v, o-phosphoric acid) on the chromatographic responses was studied using Plackett-Burman design with the help of response surface methodology (RSM). From RSM optimum regions were selected to be +1, +1 and +1 for flow rate (0.7ml/min), temperature (25 °C) and concentration of methanol in mobile phase water (0.05%w/v, o-phosphoric acid) (70%, v/v), respectively. Linearity was observed in the range of 10-50μg/ml with r2 value 0.9950. Obtained LOD and LOQ values were found to be 0.15 and 0.42μg/ml, respectively. Developed method was validated as per ICH guidelines and was successfully used for the analysis of tablet formulation.
Keywords: Experimental design; Plackett-Burman design; Response surface methodology; Ketorolac tromethamine
Abbreviations: NSAID: Nonsteroidal Anti-Inflammatory Drug; RSM : Response Surface Methodology; RSD: Relative Standard Deviation; LOD: Limit of detection; LOQ: Limit Of Quantitation; FDS: Forced Degradation Studies
Introduction
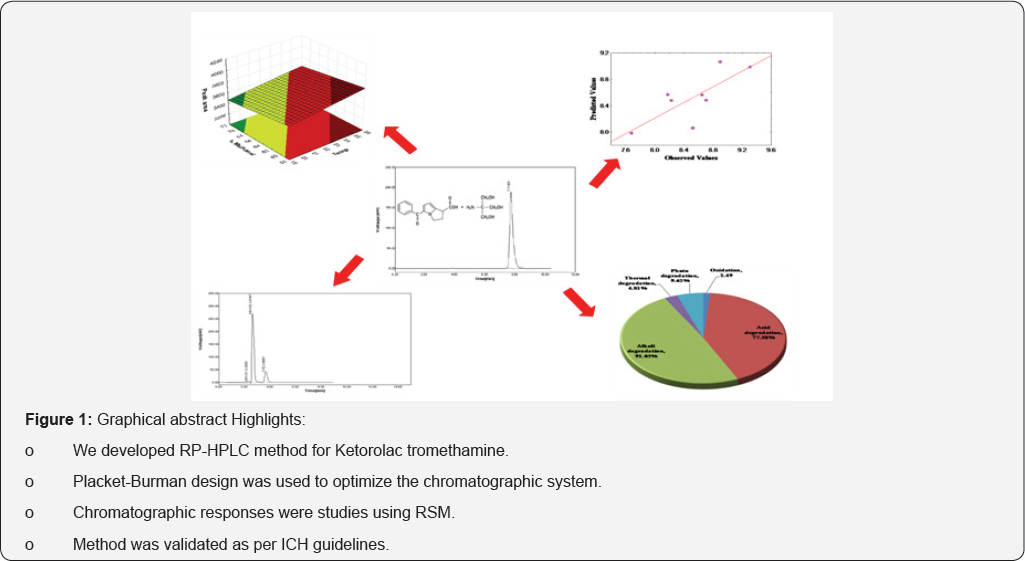
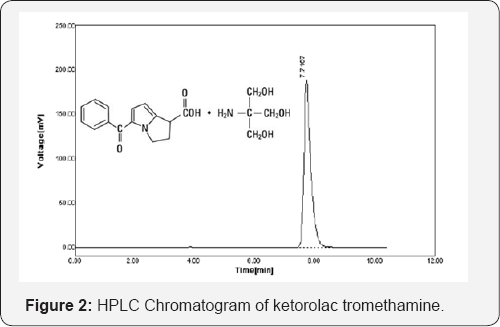
Ketorolac tromethamine (Figure 1 & 2), chemically 2-amino- 2-(hydroxymethyl)propane-1,3-diol;5-benzoyl-2,3-dihydro- 1H-pyrrolizine-1-carboxylic acid is an non-steroidal anti-inflammatory drug (NSAID). It used alone or in combination with other drugs for the short-term (up to 5 days in adults), management of moderately severe acute pain that requires analgesia [1,2]. Reported methods [3-6] significantly lack proper experimental design, and validation and stability studies as per ICH guidelines.
Thus, the key objective of present work was
o To develop validated stability indicating HPLC method for the determination of ketorolac tromethamine by employing statistical Plackett-Burman design,
o To study the effect of experimental variables like flow rate of the mobile phase, temperature and changes in the composition of the mobile phase chromatographic separation parameters using response surface methodology, and
o To undertake the forced degradation studies to check the chemical behavior of the molecule.
A Plackett-Burman design is used when we want to screen a large number of factors to identify those that are related to the dependent variable of interest. Response surface methodology (RSM), a surface plotted in three dimensions, provides large information about variables- response relationship. This is a relatively economical method as it allows testing the largest number of factor main effects with the least number of observations with as few runs as possible [7-9]. Here we have selected three experimental variables i.e., flow rate of mobile phase, column temperature and composition of mobile phase, as the possible causes for the change in chromatographic responses [10-15]. These variables are expected to show interactive results. Forced degradation studies involved subjecting the sample to a various stressed conditions to further evaluate the specificity of degradation products.
Material and Methods
Materials and instrumentation
Standard drug ketorolac tromethamine was kindly gifted by Dr. Reddy's Laboratories, Hyderabad, India. Methanol (HPLC grade) was procured from E-Merck Chemicals, India. The apparatus used was a The Agilent 1220 Infinity LC system coupled with a gradient mixer and degasser. The temperature of the column could be kept at any desired point between 15 and 50 °C using oven. A rheodyne injector with loop volume 20|il was used. The analyte was chromatographed on a Nucleosil C-18(4.6mm I.D x 250mm) column. The detection was measured using UV detector.
Optimization of chromatographic condition
Selection of system variables: As flow rate of mobile phase (X1) and column temperature (X2) determines the various responses of HPLC analysis, these two factors were taken as first two experimental variables for optimization of conditions [16,17]. Next to X1 and X2, as the polarity of the mobile phase (i.e., the % of organic solvent content in mobile phase) influence the chromatographic responses, therefore, concentration of methanol (a polar solvent) in mobile phase water (0.05% w/v, o-phosphoric acid, (OPA)) (X3) was taken as minor variable [18].
Selection of ranges of variables: Range of flow rate (X1) and column temperature (X2) was selected performing preliminary trials using standard stock solution of drug in methanol (100|ig/ ml). Flow rate in the range of 0.5-0.7 ml/min, and temperature in the range of 20-25 °C was selected in combination with methanol as a modifier of mobile phase water (0.05% OPA). As ketorolac tromethamine is a high molecular weight acidic drug, use of weak acid ifierortho-phosphoric acid in low amount (0.05%w/v) in mobile phase water further minimizes the interaction of drug with surface silanols on the silica packing because silanols do not ionize at acidic pH [17,19]. By considering the stability and pKa value of drug (pKa 3.5); only 0.05% OPA (pH 2.43) was used in water. This large difference between pKa of drug and pH of buffer keeps the drug unaffected from mobile phase [19]. The concentration range of methanol in water (0.05% OPA) (X3) used was 60-70%v/v. Column equilibration time between each run was maintained was used 30min.
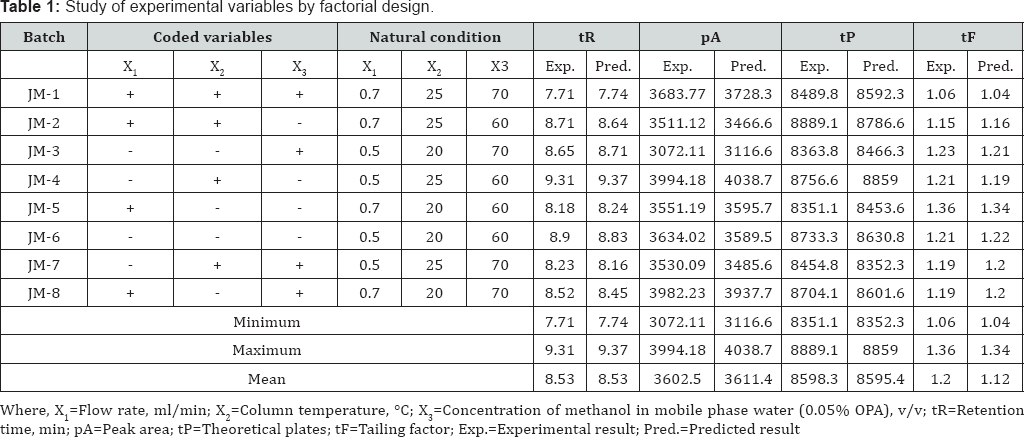
Experimental Design: Chromatographic conditions optimization process to achieve separation of drug with acceptable responses was carried out using Plackett-Burman design 23 trial. According to this design, total 8 trial batches were formed. All the batches were named as JM-1 to JM-8. For investigating the effect, each independent variable was studied at two levels, namely, "high" and "low". These levels define the upper limit and lower limits of the range covered by each variable. The values of coded levels of independent variables used in the experiment are listed in Table 1.
Response surface methodology: The best method for the optimization of experimental conditions is response surface methodology (RSM). This process will not only determine the optimum conditions, but also give the information required to design a process. It is a scientific approach for establishing the optimum conditions. The correlation of these three variables and chromatographic responses i.e. retention time, peak area, theoretical plates and tailing factor was studied. The response surface for each considered response was plotted against two different variables using STATISTICA (Version 8.0.360.0 English, Stat Soft Inc., Tulsa, USA) software. The response surface for each considered response was approximated by second order polynomial regression model Eq. (1) [14].
Y = β 0+ β1X1 +β2X2 + β3X3........ (1)
Where, Y=Chromatographic response; β0=Constant (intercept); β1=Coefficient of X1; β2 =Coefficient of X2;v β3=Coefficient of X3; X1=Flow rate of mobile phase, ml/min; X2=Column temperature, °C; X3=Concentration of methanol in mobile phase water (0.05% OPA),v/v.
Prediction profiling: When the results of an experiment are analyzed, the observed responses on the dependent variables were fitted to a separate prediction equation for each dependent variable (containing different coefficients but the same terms). Once these equations are constructed, predicted values for the dependent variables were computed at combination of levels of the predictor variables. The relationship between observed response values and predicted response values was studied by plotting the linear graph of observed response values against predicted response values calculated from respective regression models of each response separately
Analysis of RSM plots and regression models: Targeted responses viz. retention time, peak area, theoretical plates, and tailing factor, were studied by one-way ANOVA-based factorial examination. An RSM computation for the current optimization was performed by using software STATISTICA version 8 (Stat- soft, Inc., USA). The obtained data were fitted to the second order regression equation (Eq. 1), and competency of a fitted response was evaluated by ANOVA. By setting the statistical significance to p<0.05, produced response surfaces (3D surface plots), and relationship plot between observed and predicted values were critically examined.
Assay of tablets: For assay, an equivalent weight of the tablet (10mg ketorolac tromethamine per tablet; Ketorol DT® mfd. by Dr. Reddy's Laboratories, Hyderabad, India was transferred into a 100ml volumetric flask containing 30ml methanol, shaken for 30min and sonicated (Metrex Ultra Sonic)for 30min. Final volume was made up to 100ml mark with methanol. The solution was filtered through Whatman filter paper (0.45μ) and was analyzed for drug content. The drug content in sample solution was calculated from the regression equations of standard calibration graph.
Purity of peak: The peak purity of ketorolac tromethamine was assessed by comparing the spectra at peak start, peak apex and peak end positions at optimum conditions by injecting six replicates of standard solution and sample solution of equal concentration 50μg/ml separately (Figure 2).
Validation of method: Validation of developed method was carried out as per ICH guidelines [20].
Accuracy of method: Accuracy ofthe method was determined by performing recovery studies using standard addition method [21,22]. Recovery study was performed by applying the method to preanalysed drug sample to which known amount of standard drug corresponding to 80 and 120% of label claim was added. At each level of the amount six determinations were performed and the results obtained were compared with expected results.
Precision of method: Precision of method was determined with respect to both repeatability and reproducibility. An amount of the pre-analyzed tablet powder equivalent to 100% of the label claim of ketorolac tromethamine was accurately weighed and assayed. System repeatability was determined by six replicate applications and six times measurement of a sample solution at the analytical concentration. The repeatability of sample application and measurement of peak area for active compound were expressed in terms of % RSD (relative standard deviation). Method repeatability was obtained from RSD value by repeating the assay three times in same day for intra-day precision. Inter-day precision was assessed by the assay of three sample sets on different days (inter-day precision). The intra-day and inter-day variation for determination of drug was carried out at three different concentration levels 20, 30 and 40μg/ml.
Linearity and range
Linearity of the method was studied by injecting (20μL) six concentrations of the drug prepared in the water in the range 10-50μg/ml into the HPLC system. The peak areas were plotted against the corresponding concentrations to obtain the calibration graphs.
Limit of detection (LOD) and limit of quantitation (LOQ)
A signal-to-noise ratio between 3:1 and 10:1 is generally considered acceptable for estimating the limit of detection and limit of quantitation, respectively [23]. LOD and LOQ were experimentally verified by diluting known concentrations of ketorolac tromethamine until the average responses were approximately 3 or 10 times the standard deviation of the responses for six replicate determinations.
Forced degradation studies
In order to determine stability of method (stability- indicating), pure sample of drug was stressed under a variety of conditions to perform forced degradation studies (FDS). A standard stock solution of drug (100μg/ml) was used in FDS to draw an indication of the stability indicating property and specificity of proposed method. In all degradation studies the average peak area of standard drug and degraded sample after application of six replicates were obtained.
Oxidation degradation: About 2ml of hydrogen peroxide (1% v/v) was transferred to 2ml of standard stock solution of drug, separately and the solution was kept at room temperature. After 30 minutes, resulting solution was diluted to attain concentration 50μg/ml, 20μl of solution was injected and chromatograms were recorded.
Acid degradation: About 2ml of hydrochloric acid (0.01 N) was transferred to 2ml of standard stock solution of drug, separately and the solution was kept at room temperature. After 30 minutes, resulting solution was diluted to attain concentration 50μg/ml, 20μl of solution was injected and chromatograms were recorded.
Alkali degradation: About 2ml of sodium hydroxide (0.01N) was transferred to 2ml of standard stock solution of drug, separately and the solution was kept at room temperature. After 30 minutes, resulting solution was diluted to attain concentration 50μg/ml, 20μl of solution was injected and chromatograms were recorded.
Dry heat (thermal) degradation: About 100mg of pure drug was kept in hot air oven at 80 °C for 6 hrs. After heating, a concentration 50μg/ml was prepared using heated drug, 20μl of solution was injected and chromatograms were recorded.
Results and Discussion
Interpretation of RSM plots and regression models
All the batches were run using the concentration 50μg/ml selected from linearity data. Results obtained from all batches (JM-1 to JM-8) were analyzed by using STATISTICA (v8.0.360.0 English, Stat Soft Inc., Tulsa, USA). The effects and coefficients of regression models were measured by analysis of variance (ANOVA). The RSM plots were generated using same software and the adequacy of fitted model was tested by ANOVA [24,25]. The experimental plan and response are shown in Table 1. From RSM plots following interpretations are concluded.
Retention time
From RSM, it is clear that there is positive effect of all variables on retention time (Y1). From the results of tailing factor varying experimental variables, following regression equation was obtained to predict the Y1.
Y1 = 13.665-2.500X1-0.016X2-0.050X3......(2)
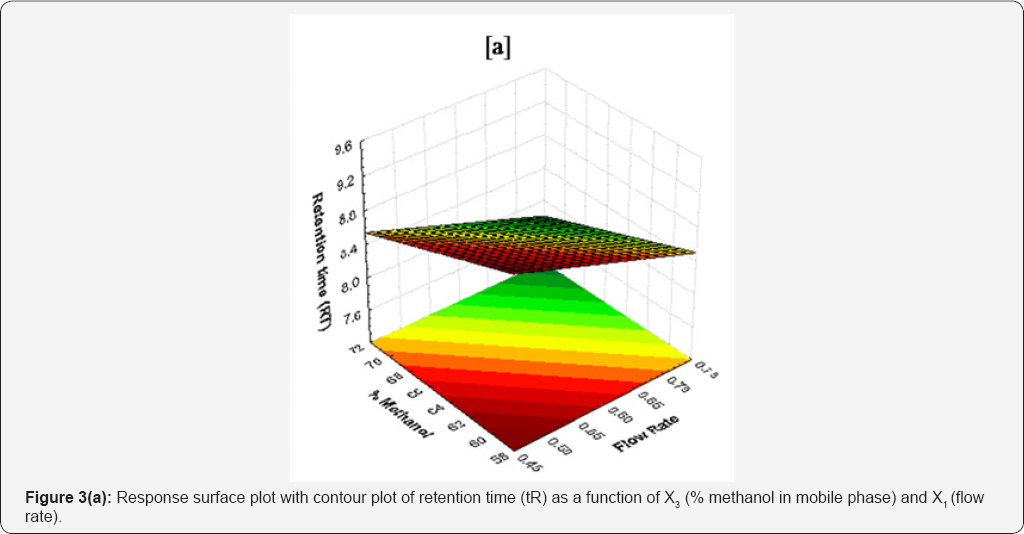
As evident in eq. (2), among the studied variables, X3 was adjudged as statistically significant variable (p=0.01638) influencing the retention time. This could be attributed to an increase in polarity of mobile phase with the addition of methanol, resulting in rapid equilibrium between mobile phase and stationary phase [18]. Thus, retention time decreases with an increase in methanol concentration in mobile phase. Besides, a high negative regression coefficient of X1 is indicative of decrease in retention time with an increase in flow rate. Thus, we can decrease the retention time by increasing the flow rate. However, here, it is necessary to realize that an increase in flow rate may result in reduced peak resolution, and backpressures may be beyond the limits of column. Also, the negative regression coefficient
For X2 suggested decrease in retention time with an increase in column temperature. This could be attributed to the reduction of mobile phase viscosity rendering the analyte to elute faster as a result of high diffusion coefficient [17]. Response surface plot of retention time (tR) as a function of X3 and X1 is shown in Figure 3(a). The average retention time of different batches was varied from 7.71 to 9.31min (Table 1). Statistical data for linear model is given in Table 2.
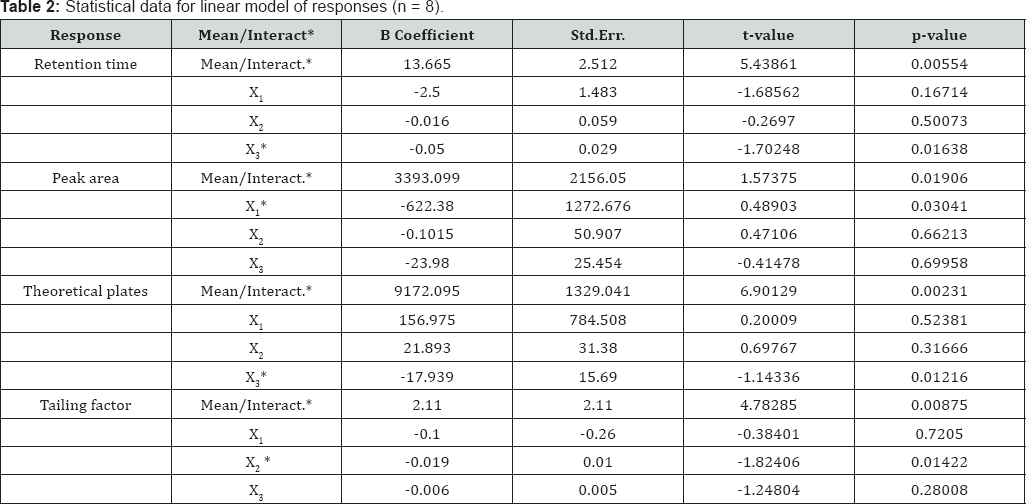
*P<0.05 (significant for a 95% confidence level); X1=Flow rate, ml/min; X2=Column temperature, °C; X3=Concentration of methanol in mobile phase water (0.05% OPA), v/v.
Peak area
From RSM, it is clear that there is negative effect of all variables on peak area ( Y2). From the results of Y2 varying experimental variables, following regression equation was obtained to predict the Y2.
The decrease in peak area may be due to increased temperature leads to the lowering of density of mobile phase, thereby enhance the mass transfer between phases and hence
Y2 =3393.099-622.387X1-23.980X2 -10.558X3.....(3)
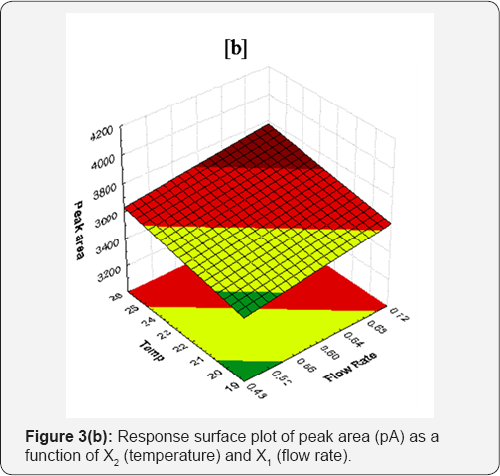
Eqation (3), clearly indicated that among the studied variables flow rate (X1) had statistically significant effect (p=0.03041) on Peak area. Eq. (3), it is clear that the peak area decreases with increase in experimental variables. Relative to temperature and % acetonitrile, flow rate has very high impact on peak area. Variable X2 (temperature) also decrease the peak area insignificantly as compare to flow rate. Concentration of methanol in water (0.05% OPA) exerts least effect.
The decrease in peak area may be due to increased temperature leads to the lowering of density of mobile phase, thereby enhance the mass transfer between phases and hence increase solubility of drug the in the mobile phase. Response surface plot of peak area (pA) as a function of X2 and X1 is shown in Figure 3(b). As shown in Table 1, the average peak area of different batches varied from 3619.83 to 3994.18. Statistical data for linear model is given in Table 2.
Theoretical plates
To predict the theoretical plates following regression equation was obtained.
Y3 = 9172.095+156.975X1+21.893X2-17.939X3 (4)
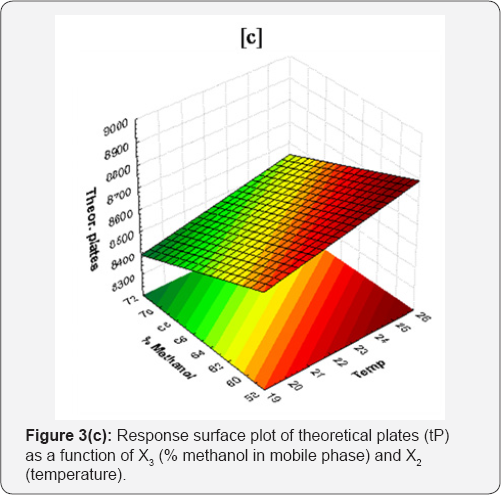
As obtained Eq. (4), the RSM analysis clearly indicated that among the studied X3 had statistically significant effect (p = 0.01216) on theoretical plates. The theoretical plates analysis revealed positive relationship with two experimental variables namely, X1 and X2. Nevertheless, as evidenced by high positive coefficient for X1, flow rate is the major variable affecting theoretical plates (theor. plates a flow rate). This might be due to effect of Van Deemter's principle which tells that number of theoretical plates (N) is function of height equivalent of a length of column and theoretical plate (H). The relationship between H, N and L is given by equation:
N = L/H
Where, H=Height equivalent of a theoretical plate, L=Length of column; and N=Theoretical plates. But, H is the function of eddy diffusion (A), longitudinal diffusion (B), resistance to mass to transfer (C) and linear flow velocity of mobile phase (V). The Van Deemter's equation is given bellow.
H= A + B/V + CV
Where, A=Eddy diffusion (proportional to particle size dp); B=Longitudinal diffusion (proportional to diffusion coefficients Dm); C=Resistance to mass transfer (proportional to dp2/Dm); V=Linear flow velocity.
As the length of column (L), particle size (dp) and ratio of dp2/Dm are constant, numbers of theoretical plates (N) establish proportional relationship with flow rate (i.e. theor. plates a flow rate, N a V). Thus eq. (5) follows the Van Deemter’s principle [16]. Increase in % of acetonitrile (X3) in mobile phase decreases the theoretical plates. Response surface plot of theoretical plates (tP) as a function of X3 and X1 is shown in Figure 3(c). The average theoretical plates of different batches were varied from 3072.11 to 3994.18 (Table 1). Statistical data for linear model is in Table 2.
Tailing factor
From RSM, it is clear that there is negative effect of all variables on tailing factor (Y4). From the results of Y4 varying experimental variables, following regression equation was obtained to predict the Y4.
Y4=2.110-0.100X1-0.019X2-0.006X3 ........(5)
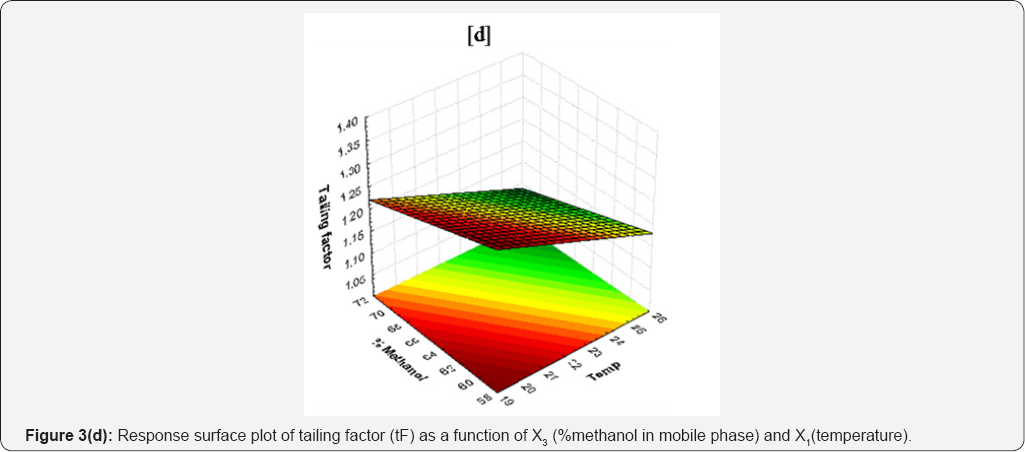
Eq. (5) indicate that the effect of all variables have very low effect on the tailing factor.Among the studied X2 had statistically significant effect (p=0.01216) on Y4. The equation indicates the tailing factor is decrease with increase in value of all variables. How-ever, a higher negative coefficient for X1 indicates the flow rate is a major factor affectingtailing factor. Usually, tailing factor is increases with flow rate. This causes increase in column back pressure due to rise in flow rate that causes the peak to becomes more non-Gaussian. But in this case, tailing is decreasing. This may be because of dominant effect of basic nature of drug as basic compounds do not causes higher tailing on silica [18]. Second reason for this low tailing is may be effect of steric hindrance of the access to silanols [26]. Once they are freely accessible, no peak distortions are encountered. Third reason for this low tailing may be due to the restricted dipole interactions between drug molecule and stationary phase resulting in decrease in tailing factor.

Next to X2, X3 is second most important factor that affect tailing factor. Increase in temperature of column increases the polarity of mobile phase thereby causing rapid equilibrium between stationary phase and mobile phase. This causes drug to elute faster with decreasing affinity towards stationary phase without causing peak distortion. Response surface plot of tailing factor (tF) as a function of X3 and X1 is shown in Figure 3(d). The average tailing factors of different batches were varied from 1.20 to 1.36 (Table 1). Statistical data for linear model is given in Table 3.
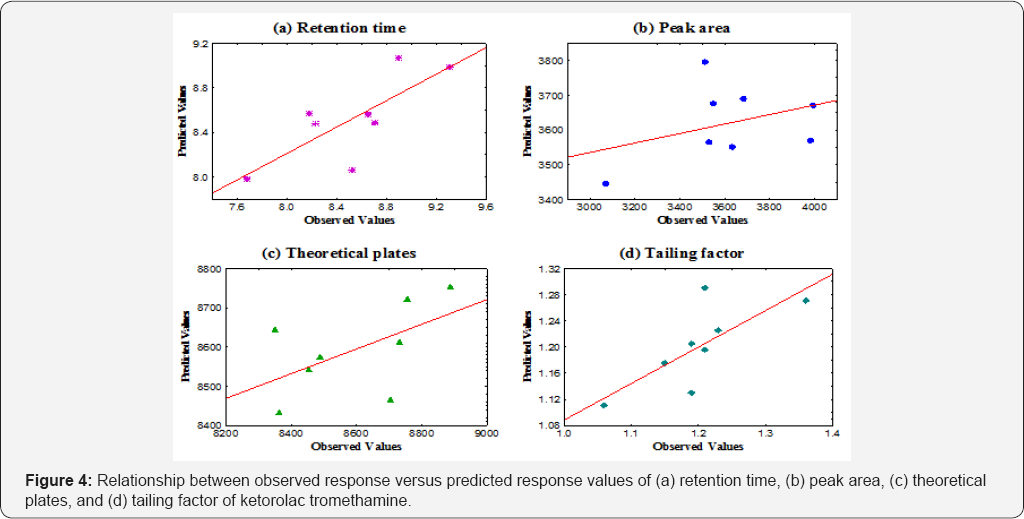
Relationship between Observed versus predicted values
The regression line for each response expresses the best prediction of the dependent variables i.e. retention time, peak area, theoretical plates and tailing factor given the independent variables. However, nature was perfectly predictable, and was substantial variation of the observed points around the fitted regression line (Figure 4 & 5).
Optimized set of chromatographic conditions
From the RSM study, it is clear that the selected variable X1, X2, and X3 are important for the regression model and their interactive effect has been observed on chromatographic responses. From RSM optimum regions were selected to be +1, +1 and +1 for flow rate (0.7ml/min), temperature (25 °C) and concentration of methanol in mobile phase water (0.05% OPA) (70%, v/v), respectively (Batch JM-1). This optimized set of conditions was further used for construction of calibration graph and method validation studies (Figure 6).
Validation of method
Accuracy of method: Accuracy was determined by performing recovery studies at two levels i.e. 80 and 120% by using standard addition method. Good recoveries (98.77 . jj-'ju 99.37%) at each concentration level with a very low % RSD(1.06-0.41%) indicated the accuracy of method (Table 4)

Precision of method: The average intra-day and inter-day precision were found to be 0.67 and 0.87%, respectively (Table 4).
Linearity and range: Linearity and range study was performed by determining the drug concentration in series of standard working solutions of concentrations 10-50|ig/ml in triplicate. The RSD of slope was less than 2 (Table 3).
LOD and LOQ: LOD and LOQ of method were confirmed by diluting the drug solution of known concentrations until the average responses were approximately 3 or 10 times the standard deviation of the responses of the blank for six replicate determinations. The signal/noise ratios 3:1 and 10:1 were taken as LOD and LOQ, respectively. The LOD and LOQ values were found to be 0.15|ig/ml and 0.42μg/ml, respectively (Table 3).
Purity of peak: In peak purity study of ketorolac tromethamine, good correlation (r=0.9991) was observed between standard and sample spectra. The average retention time for ketorolac tromethamine was found to be 7.71(SD±0.010) for six replicates.
Assay of tablets and recovery study: The percent drug content of ketorolac tromethamine in tablets was found to be 101.54 (%RSD±0.10). The mean recovery of drug from the tablet formulation was found to be 99.47% (%RSD±0.74) (Table 4).
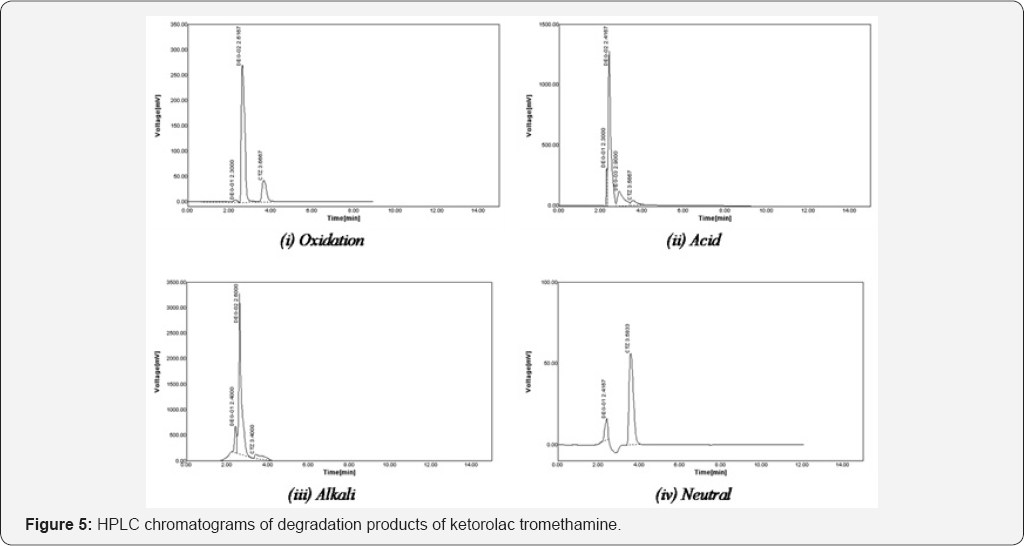
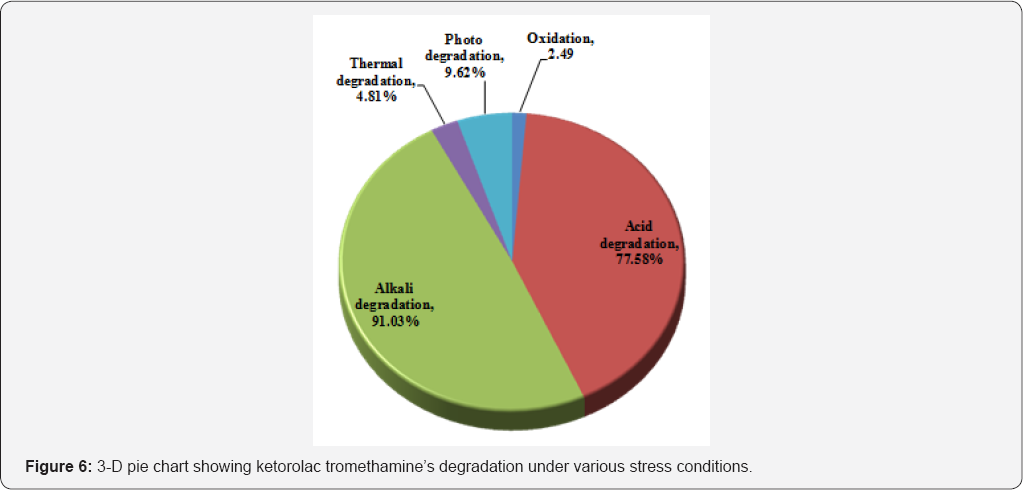
Forced degradation studies: Forced degradation studies clearly indicate that the drug ketorolac tromethamine is susceptible to oxidation, acid, alkali and heat (thermal). The highest amount of drug degradation found in alkali (91.03%) followed by acid degradation (77.58%) and photo degradation (9.62%) dry heat (56.99%). Little degradation was observed in thermal degradation (4.81%) and oxidation (2.49%).
Conclusion
Plackett-Burman design was successfully employed for the chromatographic separation of ketorolac tromethamine from bulk drug and tablet formulation. From RSM, optimum set of conditions for chromatographic separation of drug was found to be flow rate 0.7ml/min, temperature 25 °C, and concentration of methanol in water (0.05% OPA) 70% v/v. The studies indicate that temperature and concentration of methanol in water (0.05% OPA) are the two most important variables responsible for change in chromatographic responses. Results of forced degradation study indicate develop method is stability indicating.
The method was validated as per ICH guidelines and results were found statistically significant. As the method separates the drug from its degradation products, it can be employed as a stability indicating for quantitative analysis for determination of ketorolac tromethamine in bulk drug and tablet formulation, without any interference from the excipients and in the presence of its acidic, alkaline, and oxidative degradation products.
References
- Forbes JA, Kehm CJ, Grodin CD, Beaver WT (1990) Evaluation of ketorolac, ibuprofen, acetaminophen, and an acetaminophen-codeine combination in postoperative oral surgery pain. Pharmacotherapy 10(6 Pt 2): 94S-10
- 5S.
- Redden JR (1992) Ketorolac tromethamine: An oral/injectable nonsteroidal anti-inflammatory for postoperative pain control. J Oral Maxillofac Surg 50(12): 1310-1313.
- Chun IK, Kang HH, Gwak HS (1996) Determination of ketorolac in human serum by high-performance liquid chromatography. Arch Pharm Res 19(6): 529-534.
- Jamali F, Pasutto FM, Lemko C (1989) HPLC of ketorolac enantiomers and application to pharmacokinetics in the rat. Journal of Liquid Chromatography 12:1835-1850.
- Dubey SK, Duddelly S, Jangala H, Saha RN (2013) Rapid and sensitive reverse-phase high-performance liquid chromatography method for estimation of ketorolac in pharmaceuticals using weighted regression. Indian J Pharm Sci 75(1): 89-93.
- Rao BK, Golkonda R, Illuru J, Chintala R (2015) A novel stability indicating RP-HPLC method for the determination of ketorolac tromethamine in pharmaceutical formulations. Asian J Pharm Clin Res 8(2): 354-359.
- Manmode RS, Dhamankar AK, Manwar JV, Laddha SS (2011)?Stability indicating HPLC method for simultaneous determination of methocarbamol and nimesulide from tablet matrix. Der Chemica Sinica 2(4): 81-85.
- Manwar J, Mahadik K, Paradkar A (2013) Plackett-Burman design: A statistical method for the optimization of fermentation process for the yeast Saccharomyces cerevisiae isolated from the flowers of Woodfordia fruticosa. Ferment Technol 2(1): 109.
- Manwar JV, Sonawane BV, Patil SV, Takle SP (2011) Rapid RP-HPLC method for estimation of zidovudine from tablet dosage form. Der Chemica Sinica 2(5): 152-156.
- Li W, Rasmussen HT (2003) Strategy for developing and optimizing liquid chromatography methods in pharmaceutical development using computer-assisted screening and Plackett-Burman experimental design. J Chromatogr A 1016(2): 165-180.
- Heyden Y, Hartman C, Massart DL, Michel L, Kiechle P, et al. (1995) Ruggedness tests for a high-performance liquid chromatographic assay: comparison of an evaluation at two and three levels by using two-level Plackett-Burman designs. Anal Chim Acta 316: 15-26.
- Manwar J, Mahadik K, Paradkar A, Patil S, Sathiyanarayanan L, et al. (2013) Gas chromatography method for the determination of nonethanol volatile compounds in herbal formulation. Int J Ana Bioanal Chem 3(1): 12-17.
- Manwar JV, Mahadik KR, Paradkar AR, Takle SP, Sathiyanarayanan L, et al. (2012) Determination of withanolides from the roots and herbal formulation of Withania somnifera by HPLC using DAD and ELSD detector. Der Pharmacia Sinica 3(1): 41-46.
- Manwar JV, Vispute SS, Kumbhar DD, Manmode RS, Bakal RL, et al. (2017) Response surface based optimization of system variables for liquid chromatographic analysis of candesartan cilexetil. J Taibah Univ Sci 11: 159-172.
- Subramanian G, Chaudhury P, Malu K, Fowler S, Manmode R, et al. (2012) Lamin B receptor regulates the growth and maturation of myeloid progenitors via its sterol reductase domain: implications for cholesterol biosynthesis in regulating myelopoiesis. J Immunol 188(1): 85-102.
- Van Deemter JJ, Zuiderweg FJ, Klinkenberg A (1956) Longitudinal diffusion and resistance to mass transfer as causes of non ideality in chromatography. Chem Eng Sc 5: 271-289.
- David VM (2000) Effect of temperature and flow-rate on analysis of basic compounds in high-performance liquid chromatography using a reversed-phase column. J Chromatogr A 902(2): 311-321.
- Ahuja S, Dong MW (2005) Handbook of Pharmaceutical Analysis by HPLC (1st edn), Elsevier Academic Press.
- Snyder LR, Kirkland JJ, Glajch JL (1997) Practical HPLC method development, (2nd edn.), Wiley-Interscience, New York.
- ICH, Q2B (1996) International Conference on Harmonization, Geneva.
- Bakal RL, Manwar JV, Sahare AY, Bhajipale NS, Manikrao AM (2008) Spectrophotometric estimation of amitriptyline HCl and chlordiazepoxide in pharmaceutical dosage form. Indian J Pharm Educ Res 42: 23-26.
- Manwar JV, Nagargoje BU, Gurumukhi VC, Ratnaparkhi DG, Warade PP, et al. (2017) Application of simultaneous equation method for the determination of azithromycin and cefixime trihydrate in tablet formulation. Research J Pharm and Tech 10(1): 108-112.
- ICH, Q2A (1994) International Conference on Harmonization, Geneva.
- Lewis GA, Mathieu D, Phan-Tan-Luu R (1999) Pharmaceutical Experimental Design, Marcel Dekker, New York, UK.
- Carlson R (1992) Design and Optimization in Organic Synthesis (3rd edn) Elsevier, Amsterdam, Netherland.
- Kirkland JJ, Snyder LR (1997) Practical HPLC Method Development (2nd edn) Wiley Inter Science Publication, New York, UK.


