Correlation Between Voice, Speech, Body and Facial Types in Young Adults
Silvana Bommarito1, Patricia Barbarini Takaki1, Angélica da Veiga Said1, Marcela Dinalli Gomes Barbosa1, Gisele da Silva Dalben2, Eduardo Kazuo Sannomiya1 and Marilena Manno Vieira1
1Speech Therapy Department, São Paulo Federal University, São Paulo, Brazil
2Hospital for Rehabilitation of Craniofacial Anomalies, University of São Paulo, Bauru, Brazil
Submission: June 24, 2019; Published: July 16, 2019
*Corresponding author: Silvana Bommarito, Speech Therapy Department, São Paulo Federal University, São Paulo, Brazil
How to cite this article: Silvana B, Patricia B T, Angélica V S, Marcela D G B, Gisele S D, et al. Correlation Between Voice, Speech, Body and Facial Types in Young Adults. Glob J Oto, 2019; 20(4): 556041. DOI: 10.19080/GJO.2019.20.556041
Abstract
Introduction: Body proportions have been an issue since Ancient times. It started with an interest for personal aesthetics, followed by the concern for selecting the most skillful and physically prepared warriors afterwards. Measurement methods were improved over time, resulting in the emergence of biotypology and biometry, which differentiates individuals among themselves in a higher level when compared to age, gender or social factors.
Objective: To correlate voice, speech, biotype and facial type measures.
Method: The study was conducted on 124 individual’s college students, with mean age 22 years old. The sample was divided in three groups, according to biotype, and all individuals were submitted to anthropometric and vocal evaluation. The anthropometric evaluation consisted of body and facial type. Voice evaluation consisted of sustained phonation and acoustic analysis. All voice records were carried out and analyzed on an acoustic program PRAAT. Statistical analysis was performed by ANOVA and Pearson Correlation (0.05 significance level).
Results: A relationship was found in men between body type and F1 /i/ (p < 0.001, correlation -53.9%) and with F1 /a/ and F3 /u/ (p = 0.05 e p = 0.035, respectively). There was also relationship between F3 and facial types, with higher F3 values in men with short faces and women with long faces.
Conclusion: There is interference in F1 and F3 formants shaping by body type and in F3 formant shaping by facial type, concluding that body type reflects in different vocal tract shapes and in final speech product.
Keywords: Anthropometry; Biometry; Biotypology; Acoustics; Voice
Introduction
Body proportions have been an issue since Ancient times. It started with an interest for personal aesthetics, followed by the concern for selecting the most skillful and physically prepared warriors afterwards [1,2].
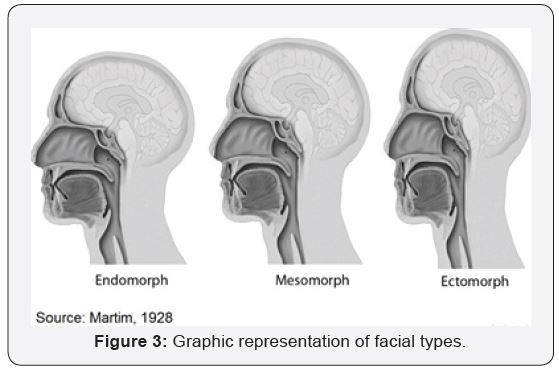
Measurement methods were improved over time, resulting in the emergence of biotypology and biometry, which “differentiates individuals among themselves in a higher level when compared to age, gender or social factors” [3]. Biotypology provided the establishment of standards in the search for ideal and universal body proportions [4]. Obtained by Cormic Index [3-5] and related to Facial Types (FT) [6], it may classify individuals into three different biotypes [2,7,8] as follows:
a) Endomorph: Presents a longer upper body compared to the extremities, has brachycephalic skull and is euryprosopic, characterized by a widened face. Such individuals present short and broad muscles, allowing them for better performance in tasks that involve strength and resistance. They also have shortened and enlarged necks, resulting in a wider vocal tract, as well as oral and nasal cavities.
b) Ectomorph: Exhibits longitudinal development, with longer extremities than the torso, dolichocephalic skull and is leptoprosopic, characterized by a prolonged face. Their muscles are long and slim, promoting better results in speed and agility activities. They have thin necks, with slender oral and nasal cavities.
c) Mesomorph: The intermediate biotype, with more symmetric body measures. The characteristic FT described by the Italian School is mesoprosopic, which also presents more symmetry between measurements.
Therefore, it is possible to infer that, for each biotype, a different FT, larynx and vocal tract anatomy are expected, with variations in muscle diameter and length, airspace and vocal folds [9], as shown in Figure 1. These differences may modify muscular activities during phonation, causing changes in vocal measures [8,9] and resonance [10,11] parameters. Due to the flexibility of the vocal tract and articulatory structures, it is still unknown how body measures reflect on voice characteristics [12,13]. It is only known to be influenced by age and sex, [14,15] and the vocal tract’s characteristics and ability to change shape influence the frequency of formants [16,17]. Since publication of these studies and also considering the evidences of different effects resulting from resonance tube length [10,14], articulation point, mouth opening [18] and other fine adjustments on the vocal tract, new vocal therapy methods were developed addressing the vocal tract (e.g. Semi Occluded Vocal Tract method) [19]. These evidences reinforce the need to understand the relation of biotype to voice and speech for enhancing diagnostics precision and therapeutic accuracy, possibly guiding the selection of exercise type and its focus - speed and agility or resistance and strength - besides to facilitate the definition of proper exercises and therapeutic boundaries for each case, which is what believe. Hence, considering the lack of studies concerning biotype and its implications in speech, the present study is proposed, aiming to correlate biotype, facial type, voice and speech measures.

Methods
This analytical, observational and cross-sectional study was approved by the Institutional Review Board (No 288.430). The study was conducted on 124 young adults (68 men and 56 women), with mean age 22 years, with normal occlusion or Angle’s Class I malocclusion [20] and with no vocal complaints. All individuals agreed to participate and signed a written consent form and were distributed according to the biotype classification (43 endomorph, 42 mesomorph and 39 ectomorph). Individuals with smoking or alcoholism habits, history of occupational vocal abuse, with syndromes or malformations, physical or mental disabilities, that suffered cranioencephalic trauma, submitted to head or neck surgery or intubation procedure were excluded from the analysis. In addition, individuals with nasal obstruction, myofunctional and vocal disorders, open or cross bite, dental malocclusions (except for Angle’s Class I, the most frequent occlusion in Brazil), temporomandibular dysfunction (TD) or who had undergone orthodontic treatment in less than two years were also excluded. All individuals underwent clinical evaluation of the upper airways with otolaryngologist and dental specialist of TD.
To ensure that the voice samples were within normal variability, a perceptual evaluation of vocal quality was carried out by impartial professionals. For this evaluation, a visual analog scale was used according to Yamasaki’s method and cutoff values [21], including voices scored up to 35.5 mm. The voices were presented randomly and blindly, with repetition of 10% of the sample to verify the intraexaminer reliability. Thereafter, the intra- and interexaminer reliability was analyzed by Cohen’s Kappa, which revealed a very low interexaminer statistical agreement (Kappa = 0.18). Thus, evaluation by a single examiner with the highest intraexaminer reliability (Kappa = 1) was conducted to evaluate the vocal quality of individuals. All participants were submitted to a personal information interview to assess the vocal habits and orthodontic history, and the latter was used as exclusion criteria. Then, they were submitted to anthropometric assessment and voice and speech evaluation. All instruments were sanitized with 70% ethyl alcohol after each procedure. The measures were taken three times to increase reliability, and the mean values were used for further analysis. The heads of all individuals were positioned taking as reference the Frankfurt Horizontal Plane and the Midsagittal Plane.
Anthropometric Assessment
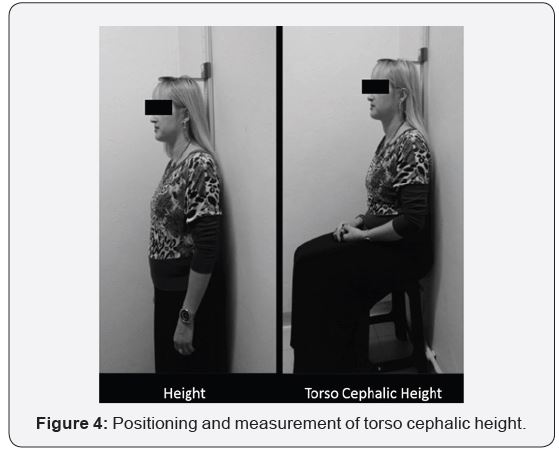
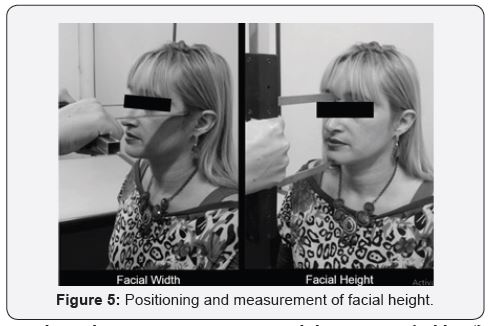
Body measures were taken to obtain the facial and Cormic Index (CI) for subsequent body and facial type classification. For biotype assessment, the height and torso cephalic measures were taken using a stadiometer with 1-mm precision. All individuals were positioned standing with their backs straight, perpendicular to the ground, shoeless, with parallel feet and joined heels. For torso cephalic height - the distance between the vertex and the ischia in a straight line - individuals were positioned sitting in a 45 cm-high standard seat with their backs straight against the stadiometer (Figure 2). The measure consists of the height from head to the ground, deducting the height of the seat. The CI, created in 1907 by Giuffrida-Ruggeri (Figure 1), was calculated using a specific equation (CI = torso cephalic height / height x 100). For males, values less than or equal to 51,0 are considered logilineos; from 51,1 to 53 are mesolineos and up to 53,1 are brevilineos. For females values less than or equal 52,0 are logilineos, from 52,1 to 54 are mesolineos and up to 54,1 are brevilineos. Facial eavluation was performed by Martin´s Facial Index [5], by formula = face height / face width x100, being considered hiperprosopic the individuals with measures equal or below to 78,9; euriprosopic from 79,0 to 83,0; mesoprosopic from 84,0 to 87,9; leptoprosopic from 88,0 to 92,9 and hyperprosopic equal or higher than 93,0. Facial height is the distance in a straight line between the Nasion (N) and the Gnathion (Gn), and was measured using a 500 mm CESCORF® bone caliper, positioned perpendicular to the ground Figure 2. Facial width is measured with the caliper parallel to the ground, by the distance between the two most lateral points of the zygomatic arches (bizygomatic diameter) (Figure 3).

Voice and Speech Evaluation
Each individual was positioned sitting, with their heads and backs comfortably straight. Voice recordings were achieved using a unidirectional auricular microphone (model Karsect HT-9, Guangdong), with condenser, plugged to an external soundboard (USB-SA 2.0, model Andrea, Pure Audio™, Pleasant Grove – UT), and positioned at a 5 cm distance from the individual’s mouth, at a 45º angle with the head midline. All exercises were recorded and stored using PRAAT software (v.5.3.85, Boersma and Weenink, Amsterdam, Netherlands), installed in a Lenovo Yoga 2.13 notebook. The sustained phonation of vowels /a/, /ε/, /i/ and /u/ and /s/ and /z/ sounds was recorded. All individuals were asked to breathe deeply and articulate the sounds as longer as possible, in the same intensity of habitual speech (Figure 4).
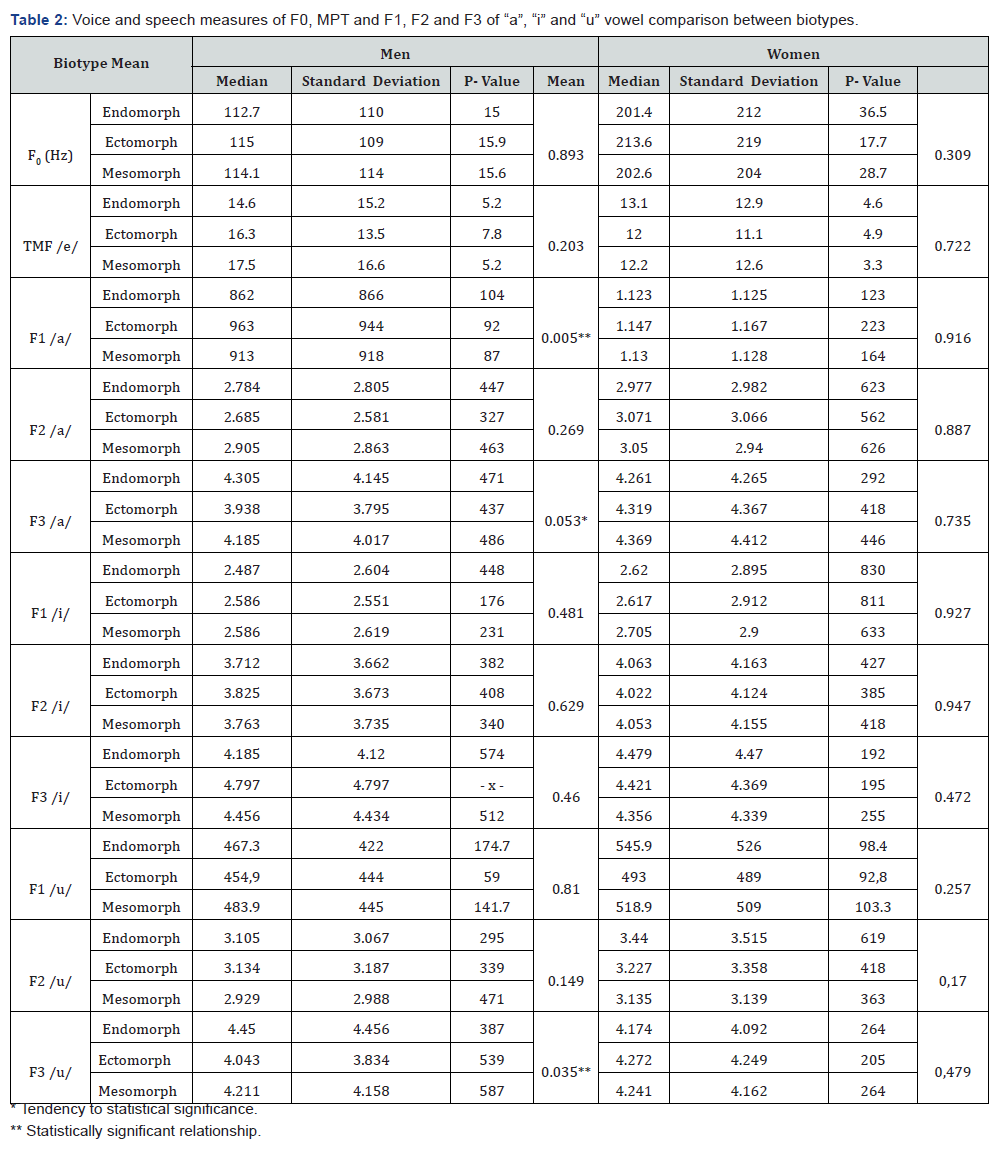
The fricative sounds /s/ and /z/ were calculated for discard a possible presence of glotic cleft if the difference between the sounds was greater 1,2 seconds according Behlau, Madazio, Oliveira [15]. The Maximum Phonation Time (MPT) was calculated from the recordings of the sustained /ɛ/ vowel. The Fundamental frequency (F0) was extracted in PRAAT from the recordings of the sustained vowel /ε/. A spectrographic analysis was made using the emissions of vowels /a/, /i/ and /u/. Therefore, the values of the three first formants (F1, F2 and F3) were determined. After evaluations, data were statistically analyzed by ANOVA test and Pearson Correlation, parametric tests, considering a significance level of 5% and statistical confidence of 95% (Table 1). The correlation intensity was determined by the classification scale, according to Table 2.
Results
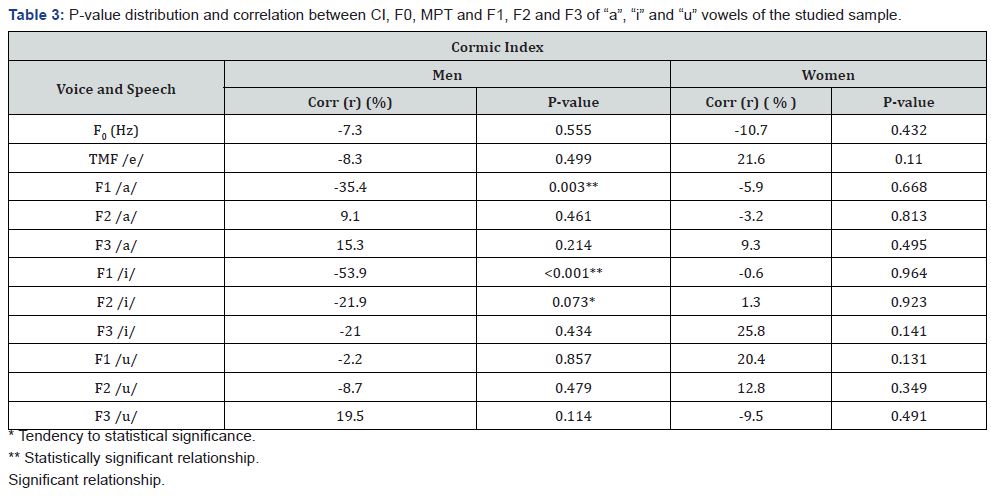
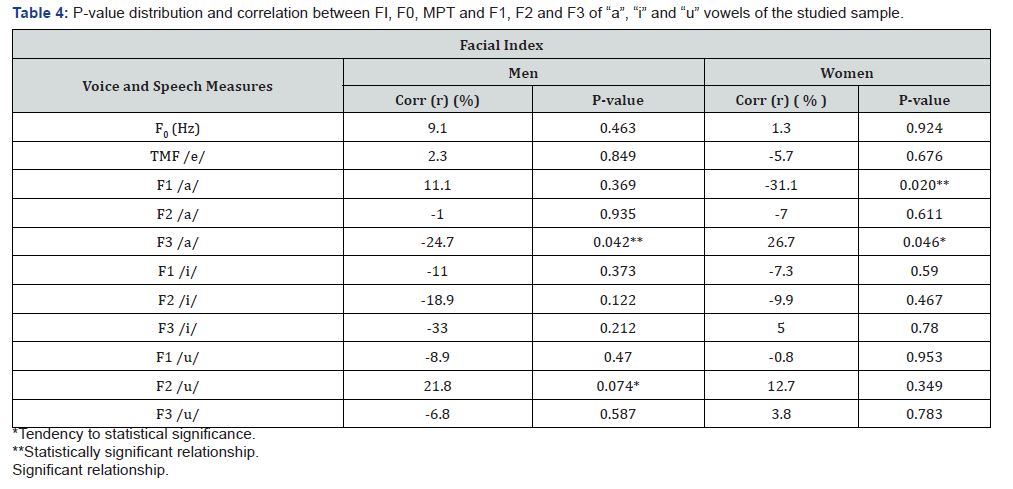
The final sample distribution and descriptive statistics are depicted in Table 1. The test results for each evaluation step is presented in tables. Firstly, no correlation between biotype and facial type was found (for males p = 0.529, corr = 7.8%; and for females p = 0.532, corr = -8.5%). Analysis of the relation between biotype and voice and speech measures (Table 3) revealed a highly significant, inversely proportional correlation between CI and F1 /i/ among males. When comparing the mean values by ANOVA (Table 2), statistically significant difference was found in males between biotypes in F1 /a/ and F3 /u/. In females, no difference was found in any of evaluated parameters. Crossing male’s F1 /a/ and F3 /u/ p-values, it can be inferred that the difference found in Table 2 occurred between endomorph and ectomorph (p = 0.004 and p = 0.034, to F1 /a/ and F3 /u/). Similarly, a correlation test was performed to analyze FI and voice and speech measures in males and females. Table 4 shows that no significant relation was found among variables (Figure 5).


Thus, the means were compared by ANOVA (Table 5)
and statistically significant difference was found between
facial types in F3 /a/ among males and females. Accordingly,
crossing of F3 /a/ p-values revealed that this difference in
men occurred between Euryprosopic and Leptoprosopic,
and between Mesoprosopic and Leptoprosopic (p = 0.049
and p = 0.048, respectively). In females, the same difference
was observed between Euryprosopic and Leptoprosopic, and
between Euryprosopic and Mesoprosopic (p= 0.032 and p =
0.033, respectively). The findings are: the longer the torso, the
lower the pharyngeal and anterior to tongue spaces (< CI,
Discussion
Biotypology first started to be thoroughly studied in Italy, with biometry, which resulted in definition of the Cormic Index (CI) in 1907, described by Giuffrida-Ruggeri [22] This index is considered the main determinant factor for bodies and functions variables [1,9,23,24], highlighting the relevance of biotype classification. The bio typology Italian School argues that torso and body parts measures are proportional to the facial structures [3,7], and, in this case, it would be a symmetry indicator. Besides, body proportions differentiate themselves after puberty [23] and determine muscles’ shape and position, which in turn plays a role in the variation of speech, agility, resistance and strength (SARS) [5]. A very important finding in the present study was that biotype did not appear to have any correlation with facial type, contradicting the symmetry theory of the Italian School [3,5,8,9]. Nevertheless, in a more relevant sense, it agrees with the study of Brown in 1934 [23], which described the population as heterogeneous and peculiar, without any metric agreement or symmetric measures. The significant ethnic admixture in the Brazilian population brought about severe disordered alterations in body proportions and therefore can be a possible explanation for this finding. This study, along with Brown’s [2-3], may emphasize the need to evaluate the individuals as a whole and respect their particular characteristics.
Another hypothesis to this divergence with the Italian School symmetry theory could be the manner through which the Facial Index was obtained, whose classification does not consider gender as a distinction factor [6]. This distinction is important when considering the numerous differences between males and females, especially concerning body type and shape, muscle mass and body functions [25]. This difference is also noticeable in the voice, resulting in changes of vocal measures depending on the vocal tract length and amplitude of pharyngeal and oral cavities [12,19,26,27]. This, emphasized by biotype classification, allows to infer that gender is an important variable to be considered when establishing a standard [22]. Analyzing biotype and voice and speech measures, it was observed that CI influenced the shaping of F1 and F3 in men, as shown in Tables 2 & 3. Among women, however, no relation was found between variables. Even so, these results suggest that ectomorph individuals have smaller posterior and anterior to tongue spaces (F3) and greater mouth opening and vertical tongue displacement (F1), only to name a few of the characteristics found. Facial type and voice and analysis of speech measures did not show any correlation, as shown in Table 4. When analyzing the difference between the facial types means, statistical difference in F3 /a/ means was observed both in males and females (Table 5).
However, this occurred differently between genders, which means that F3 means were lower in men with long faces but higher in women also with long faces. This suggests that men and women differ according to the shapes and sizes of cavities, even though Ávila´s classification6 considers the same facial type for both.
This finding may be used as a guide for future studies about facial type differences according to gender, following the bio typology’s line [2-3]. The authors encourage further studies to analyze if this difference is indeed relevant to facial type, searching for greater precision in measurement, so that light can be shed on the vocal tract’s air space, especially concerning differences between men and women. The literature also described that individuals with short face (endomorph) tend to have higher formant values [28] when compared to elongated facial measures (ectomorph). Table 2 presents the statistical difference between F1 /a/ and F3 /u/ means between biotypes (p = 0.005 and p = 0.035), specifically between endomorph and ectomorph. These data corroborate the theory in the literature concerning differences in cavities shape and size between those two biotypes [2,3] and their effects on speech quality. These findings contribute to a better understanding of differences between biotypes, such as ectomorph compared to endomorph individuals [6,7,9], as shown in Figure 1.
Therefore, this study confirms biotypes’ anteroposterior dimensions (Figure 1) and their functional impact, besides corroborating previous studies about the effect of vocal tract size on voice and speech [6,11,12,16,18]. It is worth mentioning that long face individuals present greater vertical dimensions of the vocal tract than short face individuals, as well as all soft tissues, with long and slim shape [2,3,6,7]. In clinical practice, these findings contribute to establish the therapeutic prognostic, since it is known that euryprosopic individuals have wide and short oral and nasal cavities, which will favor better tongue positioning in the oral cavity, as well as articulatory amplitude and vocal projection. This would not occur with leptoprosopic individuals, who have long cavities. Besides, the use of SARS concepts [5] will possibly enhance therapy planning and implementation, promoting speech and agility in endomorph and resistance and strength in ectomorph, according to the therapist’s judgement. The authors acknowledge that the absence of imaging exams in our sample was an important limitation to this study, considering that it could have provided more precise measures in oral, nasal and pharyngeal cavities, added to the possibility to obtain volume and air space measurements. This way, it would have been possible to deepen the understanding of internal anatomic differences among biotypes. Nevertheless, these differences in speech measures were found, expressing their anatomical distinction and their projection in speech function.
Conclusion
The authors concluded that biotype classification may interfere in F1 and F3 shaping, assigning different oral, nasal and pharyngeal cavities sizes and shapes. Facial type interfered specifically in F3 shaping, even though more studies are required to better understand its classification regarding gender. The present study might suggest that biotype reflects in different vocal tracts’ shapes and the speech final product.
References
- Ruff CB (2000) Body size, body shape, and long bone strength in modern humans. J Hum Evol 38(2): 269-290.
- Westbrook KE, Whitten R (2018) Anatomy, Head and Neck, Facial Muscles. Stat Pearls [Internet]. Stat Pearls, Publishing Treasure Island, Florida, USA.
- Gomes AC, Silva AL, Vaz AF (2013) The Biometric Cabinet of the Escola de Educação Física do Exército: measuring and classifying to produce ideal bodies, 1930-1940*. His Ciênc Saúde Manguinhos 20(4): 1551- 1569.
- Steel K, Ellem E, Baxter D (2015) The application of biological motion research: biometrics, sport, and the military. Psychon Bull Rev 22(1): 78-87.
- Martim R, Lehrbuch (2018) Der anthropologie in systematischer Darstellung [book online]. Heidelberg: Fischer pp. 1181.
- Wang TT, Wessels L, Hussain G, Merten S (2017) Discriminative thresholds in facial asymmetry: a review of the literature. Aesthet Surg J 37(4): 375-385.
- Gomes AC (2018) The rise of biotypology in Brazil: measuring and classifying the morphology, physiology and character of Brazilians in the 1930s]. Bol Mus Para Emílio Goeldi Ciênc Hum 7: 705-719.
- Fitzgerald R, Graivier MH, Kane M, Lorenc ZP, Vleggaar D, et al. (2010) Facial aesthetic analysis. Aesthet Surg J 30(Suppl 1): 25S-27S.
- Vieira MM (2004) Avaliação da face: prosopometria. São Paulo: Atheneu.
- Lindblom BE, Sundberg JE (1971) Acoustical consequences of lip, tongue, jaw, and larynx movement. J Acoust Soc Am 50: 1166-1179.
- Simberg S, Laine A (2007) The resonance tube method in voice therapy: description and practical implementations. Logoped Phoniatr Vocol 32(4): 165-170.
- Fitch WT, Giedd J (1999) Morphology and development of the human vocal tract: a study using magnetic resonance imaging. J Acoust Soc Am 106(3 Pt 1): 1511-1522.
- Yamasaki R, Behlau M, do Brasil Ode O, Yamashita H (2011) MRI anatomical and morphological differences in the vocal tract between dysphonic and normal adult women. J Voice 25(6): 743-750.
- Ptacek PH, Sander EK (1963) Maximum duration of phonation. J Speech Hear Disord 28: 171-182.
- Behlau M, Madazio G, Oliveira G (2015) Functional dysphonia: strategies to improve patient outcomes. Patient Relat Outcome Meas 6: 243- 253.
- Cohen D (1962) Acoustic theory of speech production, with calculations based on X-ray studies of Russian articulations. L’Ann Sociol 13: 554-557.
- Sundberg J (1963) Vocal tract resonance in singing. J Sing 12-31.
- Behlau M (2008) Voice: The book expert. Revinter: New York, USA.
- Titze IR (2006) Voice training and therapy with a semi-occluded vocal tract: rationale and scientific underpinnings. J Speech Lang Hear Res 49(2): 448-459.
- Angle EH (1899) Classification of malocclusion. J Dent Assoc 41: 248- 264.
- Baravieira PB, Brasolotto AG, Neto Montagnoli A, Silvério KC, Yamasaki R, et al. (2016) Auditory- perceptual evaluation of rough and breathy voices: correspondence between analogical visual and numerical scale. Codas 28(2): 163-167.
- Giuffrida-Ruggeri V (1918) A sketch of the anthropology of Italy source. J R Anthropol Inst 48: 80-102.
- Mitra S, Samanta M, Sarkar M, Roy P, Chatterjee S (2012) Can cormic index be a marker of pubertal onset and progress? J Trop Pediatr 58(4): 334-338.
- Evans S, Neave N, Wakelin D (2016) Relationships between vocal characteristics and body size and shape in human males: an evolutionary explanation for a deep male voice. Biol Psychol 72(2): 160-163.
- Vorperian HK, Kent RD, Lindstrom MJ, Kalina CM, Gentry LR, et al. (2005) Development of vocal tract length during early childhood: a magnetic resonance imaging study. J Acoust Soc Am 117(1): 338-350.
- Gusmão CS, Campos PH, Maia ME (2010) The singer’s formant and the laryngeal adjustments used to realize it: a descriptive review. Per Musi [serial online]. 21: 43-50.
- Oliveira VL, Pinho SMR (2010) A qualidade da voz e o trato vocal nos indivíduos de face curta e face longa. In: Pinho SMR. Tópicos em voz. Rio de Janeiro: Guanabara Koogan p. 81-88.
- Behlau MS, Tosi O, Pontes PA (1985) Determination of the basic frequency and its variations in height (jitter) and intensity (shimmer), for Brazilian Portuguese speaking subjects. Acta AWHO 4: 5-10.


