Transient Effect of Auditory Brainstem Responses onS|| DPOAE in Adults with Normal Hearing Sensitivity
Suchi Soni*, Srishti Rawat, Hrudanand Sahu and Vivek Mandal
Department of Audiology, AIISH, India
Submission: April 25, 2017; Published: March 34, 2017
*Corresponding author: Suchi Soni, Department of Audiology, AIISH, B32/Vanarash, UP, India, Tel: 09891497705; Email: shivayestore@gmail.com
How to cite this article: Suchi S, Srishti R, Hrudanand S, Vivek M. Transient Effect of Auditory Brainstem Responses on DPOAE in Adults with Normal Hearing Sensitivity. Glob J Oto 2017; 8(2): 555734. DOI: 10.19080/GJO.2017.08.555734
Abstract
The hearing assessment of clinical population and infant screening is usually assessed by the combined use of auditory brainstem response (ABR) and DPOAEs carried out in sequence, with normally the ABR recording preceding the DPOAE testing. This study reports a cautionary finding that the use of this accepted regimen yields a reduced DPOAE response. When the DPOAEs were performed after ABR testing, transient reduction of the DPOAE amplitude and SNR was observed at all frequencies. The reduction in DPOAE was temporary: when re-tested at one hour, DPOAE amplitudes recovered to pre-ABR levels. However recovery showed three different patterns i.e. partial; complete; no recovery. Toxic noise exposure is known to negatively impact OAE, transient decrease in DPOAE levels following standard ABR assay has not been previously described. A practical outcome from this study is a recommendation for reversal of the traditional order for carrying out auditory tests, with the OAE measurements preceding ABR assessment, thus ensuring that the DPOAE response is unaffected.
Keywords:: ABR: Auditory Brainstem Response; TTS: Temporary Threshold Shift; SNR: Signal To Noise Ratio; SPSS: Statistical Package for Social Sciences; MOC: Medial Olivocochlear; OHCs: Outer Hair Cells; MEM: Middle Ear Muscle
Introduction
OAEs are non-invasive and objective in nature so they are widely used in clinical settings and in hearing screening programs for newborns and infants [1]. It is also used for the objective assessment of hearing status in difficult-to-test population, objective estimation of the degree of hearing loss, and as a valuable tool in the audiological diagnostic test battery to determine the site of lesion [2]. Further OAE is used in monitoring the cochlear hearing status during or after therapeutic intervention [3]. DPOAE is a type of EOAE which is the result of an inter modulation distortion produced by the nonlinear aspects of cochlear processing in response to two simultaneous, primary tones that are nearby in frequency. It is recorded in the ear canal, and effective reverse transmission is needed to transmit the OAEs from the inner ear to the ear canal [4].
It is known that DPOAEs are emitted at a known frequency related to the stimuli; it helps in determining the exact place on the basilar membrane, which responds to two known stimuli, but there are various factors which influence DPOAEs. These factors include; stimulus parameters, patient variables and environmental factors [5]. Among environmental variables exposure to noise is most important. DPOAE analysis is important in studies related to acquired hearing losses as most often hair cells are primarily affected such as during the initial stages of noise exposure [6,7]. Hearing assessment in noise- exposed groups such as chinchillas has shown a decrease in DPOAE amplitude but ABR thresholds didn't differ much [8]. Similar results have been reported in army recruits [9-12]. Thus, reduced OAEs are considered as a risk factor which can indicate future hearing loss in people exposed to continuous and impact noise [10].
In a similar study ABR evoked temporary threshold shift was assessed by Mhatre et al. [13] in multiple mouse strain. DPOAE was performed before and just after ABR measurement and they found reduced DPOAE response, when the DPOAEs were performed post ABR testing. However the reduction in DPOAE was temporary and when retested after one hour, DPOAE amplitude was same as that to pre ABR level. Thus above studies support the view that DPOAE is a very useful clinical tool in early detection of threshold shift due to noise exposure.
The hearing assessment of clinical population and infant screening is usually assessed by the combined use of auditory brainstem response (ABR) and DPOAEs carried out in sequence, with normally the ABR recording preceding the DPOAE testing. The use of this regimen can yield lower DPOAE response, when the DPOAEs are performed after ABR testing, thus might lead to mis diagnosis. In a study by Mhatre et al. [13], DPOAEs amplitude were temporarily reduced in all frequencies post- ABR in multiple mouse strains suggesting that ABR can induce temporary threshold shift (TTS) and DPOAEs can provide a sensitive measure of the functional integrity of the outer hair cell.
Thus, present study would help in deciding the protocol whether there ought to be reversal of the conventional order for carrying out audiological tests with the OAE measurements preceding the ABR assessment, thus ensuring that the DPOAE response is unaffected, leading to proper diagnosis of hearing sensitivity. The main objectives of this study was to assess the immediate effect of ABR on DPOAE amplitude and signal to noise ratio (SNR) across frequencies and to assess DPOAE amplitude and SNR across frequencies after one hour of ABR recording.
Method
Participants
Data was collected on 50 participants. All the participants were in the age range of 18 to 29 years (mean age = 22.5 years)
and had hearing thresholds within normal limits (confirmed through routine audiometric testing) in both the ears. DPOAEs were recorded from any one randomly chosen ear of each subject.
DPOAE Measurement
DPOAE was recorded using the ILOV6 OAE analyzer (Otodynamics Ltd). Two primary signals were used to record distortion products. Prerecording preparation include unobstructed outer ear canal, optimal positioning of the probe, relatively quiet recording environment. Primary signals f1 and f2, with f2/f1 = 1.3, generated with test frequencies ranging from 1001 Hz to 6006 Hz with a frequency resolution of one DPOAEs per octave was used. Two level chosen were L1 = 65 dB SPL, L2 = 55 dB SPL. L2 was lower than L1 to equate the amplitudes of the vibration of the travelling waves representing the two primaries, where they interact on the BM [4]. The response parameters to consider DPOAE as present included DP amplitude and SNR. A peak at 2f1 - f2 in the spectrum was accepted as a DPOAE if it is 3 dB above the noise floor.
ABR Measurement
While recording ABR, the participants were made to sit on a reclining chair, instructed to relax, close the eyes and sleep if possible. The sites of electrode placement were prepared with skin preparing gel. Disc type silver coated electrodes were placed with conduction gel at vertex (active electrode), ipsilateral mastoid (negative), contra lateral mastoid (ground). Filter setting used was 100 Hz to 3000 Hz. The broadband clicks were used as stimulus presented at the rate of 30.1 per second and responses averaged over 1500 trials using ER-3A Insert earphones. The intensity of the stimulus was initially set at 90 dB nHL and sequentially attenuated in 10 dB steps until a threshold level was reached. The whole experiment was conducted in two steps including pre exposure measurement and post exposure measurement.
Pre exposure Measurements
Three repeated DPOAE recordings were taken before the ABR test. For three DPOAEs recordings the probe was removed and replaced before each measurement. This was done to reduce the variability seen in DPOAE due to probe insertion and the average of three recordings was considered for final analysis.
Post exposure Measurements
Post-exposure DPOAE measurement was done twice; one immediately after ABR recording and another one hour after ABR recording. Thus the DPOAE recording for each subject included the three measurements which were taken just after ABR recording and three measurements taken one hour after ABR recording, reason for 3 measurements being the same as mentioned in pre exposure test. DPOAE recording 1 hour post ABR was done to look for TTS recovery.
Results and Discussion
The present study was aimed to evaluate the transient effect of ABR on DPOAE amplitude and SNR across frequencies and DPOAE amplitude and SNR across frequencies after one hour of ABR recording. To reach the aim, a series of DPOAE test was performed before, after and one hour after ABR testing at different frequencies. Data obtained from the subjects after three measurements was averaged and tabulated and analysis was done for each condition using statistical package for social sciences (SPSS) software version 17.
Data was analysed using repeated measure ANOVA and Friedman test and results show that there was change in DPOAE amplitude and SNR response before and after ABR testing. The results of the present study will be discussed under three headings. a) Effect of ABR on SNR. b) Effect of ABR on DP amplitude. c) Recovery Pattern of DPOAE.
Effect of ABR on SNR
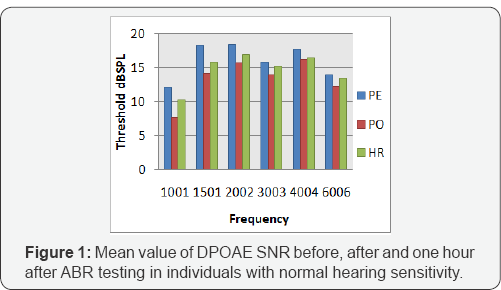
DPOAE SNR for all the 50 subjects was measured in all the three conditions. A significant inter subject variation was seen in SNR. Figure 1 represents the mean for SNR values of DPOAE across each frequency. It can be noted that the mean absolute DPOAE SNR value obtained for lower frequencies after ABR exposure is lower than at higher frequencies (Figure 1).
Later repeated measure ANOVA was performed to analyse the significant difference in SNR across three conditions, and it showed that time of measurement (pre, post and after one hour) and frequency has a significant effect on DPOAE SNR values, where significant difference in SNR was seen across all the frequencies for all the 3 conditions (p<.05). Results also revealed that frequency was a significant variable indicating that pattern of attenuation and recovery was not similar for all the frequencies, which can be seen in Table 1. To analyse the difference across conditions pair wise comparison was done using Bonferroni multiple comparison. It revealed the significant difference between pre and post (p<.01) and also between post and one hour recovery (p<.01). The significant p values for difference between pre, post and one hour after ABR testing for individual frequencies are given in Table 2 where shaded values show no significant changes (Tables 1 & 2).


From the above tables it is evident that ABR induced DPOAE reduction in terms of SNR was seen in all the subjects with some inter subject variability. It is also evident that attenuation in DPOAE is more significant at lower frequencies (1001 Hz to 3003 Hz) than higher frequencies (4004 to 6006) indicating the effect of ABR exposure was more at the frequencies which fall under click frequency spectrum.
Effect of ABR on DP amplitude
The mean and standard deviation of DPOAE amplitude across each frequency was calculated. It was found that standard deviation for DP amplitude across frequency was higher than the mean, so median was considered for the analysis. The nonparametric analysis was done using Friedman test for all the frequencies. The magnitude of difference between three conditions for individual frequencies of DPOAE is presented in the form of bar graph in Figure 2.

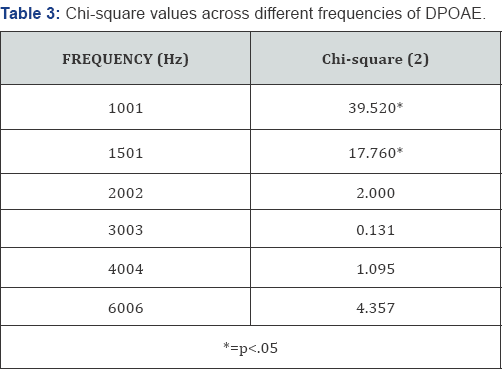
The Friedman test was performed to see the difference in DP amplitude across three conditions (pre, post and after one hour). Table 3 shows the Chi-square value of all the frequencies of DPOAE & it can be noted that the DP amplitude of low frequencies is significantly affected (p<0.05) compared to high frequencies post ABR testing. Later Wilcoxon Signed Ranks Test was performed for lower frequencies to analyse the significant difference and it revealed that time of measurement had a significant effect on DPOAE amplitude. Also frequency was a significant variable indicating that the effect of ABR and recovery was not equal at all frequencies, where significant difference in DP amplitude was seen for frequencies between 1001 Hz and 1501 Hz for all the 3 conditions. The significant Z values for difference between pre, post and one hour after ABR testing for individual frequencies are given in the Table 4.

The purpose of this study was to evaluate the change in the amplitude and SNR of DPOAE in response to non hazardous sound stimulus, clicks, commonly used in routine clinics to assess hearing sensitivity (standard ABR test), which was previously not reported on humans. The temporary shift in DP amplitude and SNR was seen in 50 individuals with normal hearing sensitivity, which recovered after one hour rest period. The DPOAE amplitude reduction following ABR testing may reveal a direct effect on the sensory hair cells in response to constant acoustic stimulation. On the other hand, central control may also be accountable for the reduction in OHC activity as Medial olivocochlear (MOC) neurons project to outer hair cells (OHCs). Abdala, Mishra & Williams [14] and Deeter, Abel, Calandruccio and Dhar [15] have revealed that activation of the MOC neurons leads to diminished DPOAEs. Thus, it is possible that the ABR stimuli could activate the MOC neurons that bring suppressive effect over OHC and their OAEs results.
The middle ear muscle (MEM) reflex (which can be elicited by non hazardous ABR testing), can also affect OHC activity [16]. Elicitation of the MEM reflex results in a stapedius muscle contraction which can alter the sound pressure in the ear canal, and thus will reduce the OHC response which intern can attenuate DPOAE response. However, reduction in DP response induced by ABR is highly variable. Differences across subjects were seen in (1) magnitude of the DPOAE shift; (2) frequency specificity of DP shift (3) recovery pattern. Studies have shown that usually a high inter subject variability is seen on DPOAE shift because of noise exposure [17]. In the present study the variability can be attributed to individual susceptibility to sound exposure (Table 5).
In the present study the DPOAE response was maximally affected from frequencies between 1-3 kHz. It could be because ABR was measured using click stimulus and the click has its frequency concentration between the same frequency ranges. This finding is also consistent with Gupta [18] who observed that most threshold shift occurred at and above the frequency of their TTS-inducing stimulus. Previous studies have also shown that frequency of the noise exposure has an effect on TTS. Reuter et al. [19] investigated the effect of 1 kHz pure tone exposure (lasting for 3 min at a SPL of 105.5 dB) on DPOAE properties in 39 individuals with normal hearing. The results showed a similarity between DPOAE and TTS which were found in the affected frequency region and the time course of recovery.
Although findings in the present study and that performed earlier by Mhatre et al. [13] are similar with respect to the effect of ABR stimulus exposure over DPOAE amplitude and SNR. However it was reported that effect produced by ABR exposure was more at higher frequencies on multiple mouse strain in a study by Mhatre et al. [13]. Whereas in present study reduction in DPOAE response was seen across all test frequencies but effect was more significant at lower frequencies between 1001 Hz to 3003 Hz. This difference could be attributed to the difference in stimulus used for ABR test. In the present study click were used as a stimulus for ABR assessment, whereas in their study click and tone burst (8, 16, 24, 32 KHz) were used as a stimulus for ABR testing (Figure 3).
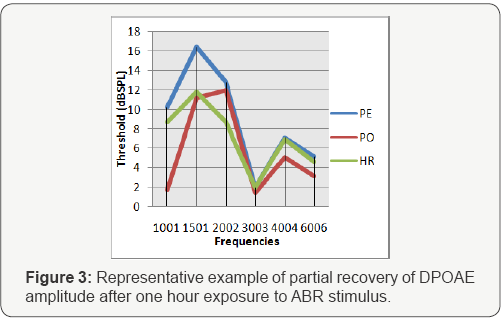
Moreover in the present study difference in DP amplitude was seen only at lower frequencies (1 KHz and 1.5 KHz) in all the three conditions (PE, PO and HR) whereas for SNR the difference was seen for all the frequencies in all the three conditions. However for SNR the difference was more significant at lower frequencies. The reason for DP amplitude variation could be attributed to the fact that higher frequencies had lower amplitude in pre exposure condition itself. Also the reason as to why SNR variation was seen at all frequencies could be due to the higher contamination of noise at low frequencies [20].
Recovery patterns of DPOAE
After exposure to continuous stimulus of ABR there was a reduction in DPOAE amplitude and in SNR. However after a rest period of one hour, three different types of DPOAE recovery patterns were seen. The group-recovery DPOAE-shift shows the greatest DPOAE shift seen in the frequency range between 1 kHz to 3 kHz, with a maximum value of 4.4 dB. The recovery patterns of DPOAE post ABR exposure is discussed under 3 headings of Partial recovery, complete recovery, no recovery.
Partial recovery
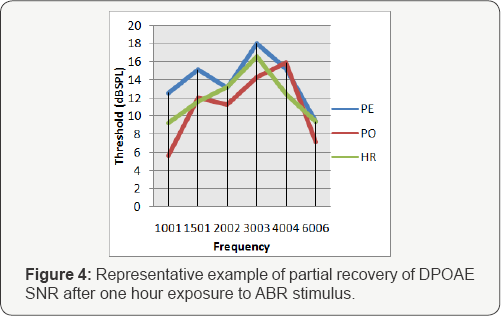
In most of the participants, only a partial recovery was seen i.e. the DPOAE amplitude and SNR did not return to pre exposure level. An example from one participant with partial recovery is shown in Figure 3 and 4 which were characterized by a progressive decline and loss of DPOAEs at test frequencies lower than 3003 Hz, and weakly diminished DPOAEs at frequencies of 4004 to 6006 Hz (Figures 4 & 5).
Overshooting/complete recovery
In some of the participants the initial loss of DPOAE amplitude and SNR was very short lived which was returned to pre exposure level completely within one hour post exposure. This overshoot or complete recovery was seen at higher frequencies between 3003 Hz to 6006 Hz in the same participants as shown in Figure 3 & 4.
No recovery

In few participants a complete and persistent loss of DPOAE was observed even after one hour of recovery period. This loss of DPOAE was persistent in all the test frequencies as shown in Figure 5 & 6.
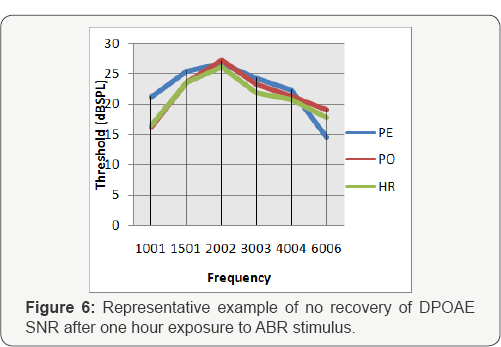
Thus it is evident that continuous but short exposure of click stimulus produced variable outcomes both in terms of attenuation of DPOAE and recovery patterns. Some participant's DPOAE recovered quicker and completely than others whereas some didn�x2019;t show a significant recovery in DPOAE. Similar recovery patterns were obtained in a study done by Emmerich, Richter, Reinhold, Linss and Linss [21]. They studied DPOAE level shifts before and after noise exposure and found 70% partial recovery of the DPOAEs within 4 months after noise exposure and in 16% of the investigated ears no recovery of DPOAEs was observed. It has been observed that recovery pattern depends on individual susceptibility to noise damage, which probably differs as a function of age and health of the individual [22].
Even though some inter subject variability was seen in terms of reduction and recovery of DPOAE, the present findings support the assumption that routine ABR testing causes some amount of fatigue to the hair cells which in turn can lead to temporary and partial attenuation of DPOAE, which is in agreement with the study done by Mhatre et al. [13]. The results form presents study demonstrate that indeed ABR testing when performed before OAE evaluation can lead to misdiagnosis. Thus, present study would help in deciding the protocol whether there should be reversal of the traditional order for carrying out auditory tests with the OAE measurements preceding ABR assessment, thus ensuring that the DPOAE response is unaffected, leading to proper diagnosis of hearing sensitivity [23-31].
Conclusion
OAE and ABR evaluation are very important in the assessment of the hearing acuity and hearing screening in children. A functional outcome of this study is the recommendation for reversal of the order for carrying out the audiological tests. Thus the OAE measurements should be done prior to the ABR assessment which will ensure that the DPOAE responses are unaffected. However if ABR recording has to be done before OAE measurement, then at least one to two hours of gap is recommended between these tests.
References
- Prieve BA (2002) Otoacoustic emissions in neonatal hearing screening. Otoacoustic Emissions: Clinical Applications (2nd edn.). Thieme, New York,USA, 348-374.
- Lonsbury-Martin BL, Martin GK (2003) Otoacoustic emissions. Otolaryngology Head Neck Surgury 11: 361-366.
- Lonsbury-Martin B L, Martin GK (2001) Evoked otoacoustic emissions as objective screeners for ototoxicity. Seminars in Hearing, 22(4): 377392.
- Robinette MS, Glattke TJ (2007) Otoacoustic Emissions: Clinical Applications. Thieme medical publishers, New York, USA.
- Hall JW (2000) Handbook of Otoacoustic Emissions. singular publishing group, California, USA.
- Clark WW, Bohne BA (1978) Animal model for the 4- kHz tonal dip. Ann Otol Rhinol Laryngol Suppl 51: 1-16.
- Davis RI, Ahroon WA, Hamernik RP (1989) The relation among hearing loss, sensory cell loss and tuning characteristics in the chinchilla. Hear Res 41(1): 1-14.
- Harding GW, Bohne BA, Ahmad M (2002) DPOAE level shifts and ABR threshold shifts compared to detailed analysis of histopathological damage from noise. Hear Res 174(1-2): 158-171.
- Desai A, Reed D, Cheyne A, Richards S, Prasher D (1999) Absence of otoacoustic emissions in subjects with normal audiometric thresholds implies exposure to noise. Noise Health 1(2): 58-65.
- Lapsley Miller JA, Marshall L, Heller LM, Hughes LM (2006) Low-level otoacoustic emissions may predict susceptibility to noise-induced hearing loss. J Acoust Soc Am 120(1): 280-296.
- Lapsley Miller JA, Marshall L, Heller LM (2004) A longitudinal study of changes in evoked otoacoustic emissions and pure-tone thresholds as measured in a hearing conservation program. Int J Audiol 43(6): 307-322.
- Lapsley Miller JA, Marshall L (2001) Monitoring the effects of noise with otoacoustic emissions. Semin Hear 22(4): 393-403.
- Mhatre AN, Tajudeen B, Welt EM, Wartmann C, Long GR, et al. (2010) Temporary reduction of distortion product otoacoustic emissions (DPOAEs) immediately following auditory brainstem response (ABR). Hear Res 269(1-2) 180-185.
- Abdala C, Mishra KS, Williams LT (2009) Considering distortion product OAE fine structure in measurement of the medial olivocochlear reflex. J Acoust Soc Am 125(3):1584- 1594.
- Deeter R, Abel R, Calandruccio L, Dhar S (2009) Contralateral acoustic stimulation alters the magnitude and phase of distortion product otoacoustic emissions. J Acoust Soc Am 126(5): 2413-2424.
- Goodman SS, Keefe DH (2006) Simultaneous Measurement of Noise-Activated Middle-Ear Muscle Reflex and Stimulus Frequency Otoacoustic Emissions. J Assoc Res Otolaryngol 7(2): 125-139.
- Kemp DT (1978) Stimulated acoustic emissions from within the human auditory system. J Acoust Soc A 64(5): 1386-1391.
- Gupta BH (2002) Effect of oral magnesium on temporary threshold shift. Unpublished Msc. Thesis.
- Canlon B, Borg E, Lofstrand P (1992) Physiologic and morphologic aspects to low-level acoustic stimulation. Noise-Induced Hearing Loss, Mosby Year Book, pp. 489-499.
- Sliwinska-Kowalska M, Kotylo P (1997) Is otoacoustic emission useful in the differential diagnosis of occupational noise-induced hearing loss. Med pr 48(6): 613-620.
- Carhart R, Jerger J (1959) Preferred method for clinical determination of pure tone thresholds. Journal of Speech and Hearing Disorders 24: 330-345.
- Dancer A (1995) Use of animal models in the study of the effects of noise on hearing. Philadelphia 10(3): 535-544.
- American National Standards Institute (1991) Criteria for Maximum Permissible Ambient Noise during Audiometric Testing. ANSI 3: 1-1991.
- Marshall L, Lapsley Miller JA, Heller LM, Wolgemuth KS, Hughes LM, et al. (2009) Detecting incipient inner-ear damage from impulse noise with otoacoustic emissions. J Acoust Soc Am 125(2): 995-1013.
- Newby HA, Popelka GR (1992) Audiology (6th edn.), Prentice Hall, Englewood Cliffs, USA.
- Norton SJ, Stover LJ (1994) Otoacoustic emissions: An emerging clinical tool,'' in Handbook of Clinical Audiology. Williams and Wilkins, Baltimore, USA, pp. 448-462.
- Norton SJ (1992) Cochlear function and Otoacoustic emissions. Semin Hear13(1): 1-14.
- Schiavetti N, Metz DE (2006) Evaluating research in communicative disorders (5th edn.), Boston, Allyn & Bacon, USA.
- Sheskin DJ (2003) Handbook of Parametric and Nonparametric Statistical Procedures. CRC press, USA, pp. 77.
- Stach BA (2008) Clinical Audiology: An introduction. Singular publishing group, California, USA, pp. 81.
- Water TV, Staecke H (2005) Otolaryngology: basic science and clinical review. Thieme medical publishers, New York, USA.


