Administering Saturated Signalized Networks Through Fuzzy Technique
Woroud A Alothman1*, Saad Suliman2 and Hashim MN Al-Madani3
1 Department of Mechanical Engineering, University of Bahrain, Bahrain
2 Department of Manufactural Engineering, University of Bahrain, Bahrain
3 Department of Transportation and Civil Engineering, University of Bahrain, Bahrain
Submission: July 27, 2018; Published: September 07, 2018
*Corresponding author: Woroud A Alothman, College of Engineering, University of Bahrain, Manama, 00973, Kingdom of Bahrain, Bahrain, Kuwait, Adan city, Tel: +965 97779650, Email: woroudalothman@gmail.com
How to cite this article: Woroud A A, Saad S, Hashim MN Al M. Administering Saturated Signalized Networks Through Fuzzy Technique. Eng Technol Open Acc. 2018; 2(3): 555589. 10.19080/ETOAJ.2018.02.555589
Abstract
An adaptive control system is developed using a fuzzy method to improve the traffic control system performance and to reduce the overall delay for four phases simple intersections within a grid of network. The main functions of the developed control system are to accelerate the cycle time and to reduce the loss time by determining the green time for each phase based on traffic flow. The fuzzy rules are employed using visual basic and computer-based program (Excel) to run the validation process. The developed control system is tested on five intersections in a simulated network in the State of Kuwait during four different peak periods. The results indicated that the number of vehicles passing through intersection phases has increased in most phases by an average of 12.9%, 23.3%, 10.4% and by 21.2%. The green time is increased by an average of 9.1%, 5.8%, 9.9% and 6.3%. Number of intersections’ cycles remain constant at most of the time which means that the developed control system distributes the green phases’ times based on the traffic situation. The developed control system can be applied on simple intersections with four perpendicular phases that consist of collector, major arterial or minor arterial roads.
Keywords: Artificial intelligence; Fuzzy logic; Intelligent transportation systems; Traffic control systems
Introduction
Rapid growth of personal vehicles resulted in excessive congestion. Traffic congestion affects operational management of business, energy consumption and tourism. As known to the experts’ congestion reduces human productivity and leads to delays in products and services in small and big cities. A traffic signal is among the most important traffic control devices that are used to manage traffic flow efficiently, but it may lead to traffic congestion if it is poorly handled. Most traffic signals are operated by either fixed time signal or actuated control systems. Controlling isolated traffic signal is easy specially when the intersection demand is below the capacity, but it is difficult when the intersection is within a network. Fuzzy techniques are used to solve traffic problems. It might improve road capacity, improve traffic light performance and reduce vehicle delay by adjusting parameters such as cycle time, splits, phase sequences and offsets per change of the traffic volume.
Fuzzy Logic Traffic Control System
The artificial intelligent concept combines the objective knowledge, formula and equations, subjective knowledge, and linguistic information, to assist solving traffic problems. Fuzzy is one of the most famous artificial traffic control systems that is used to improve the traffic situation and to increase the traffic capacity. The fuzzy technique is used to develop the traffic control system due to its ability to process various data, vague and uncertain inputs of the system, and provide results that are suitable for the decision making. Fuzzy logic is capable to incorporate human knowledge and experience to respond quickly in unknown environments, adapt conditions, and an ability to involve decisions with incomplete information, complex equations, and non-linear processes. It allows the manipulation of linguistic inexact data as a useful tool in the design of the intelligent traffic control system. The fuzzy logic control system consists of different components: fuzzification, fuzzy control decisions block; rule matrix and fuzzy interference engine; and defuzzification as shown in Figure 1.
Based on a literature survey of the application of fuzzy control traffic systems, it can be observed that the implementation of fuzzy systems in transportation has a large impact on traffic levels. Consequently, the following highlights can be made: Traffic fuzzy systems had different shapes, which are often recurrent; improving flow rate, forecasting traffic capacity, controlling phase selection, and controlling signal timing. Most of the researchers used Mamdani type inference and depended on historical data to compare between the proposed and existing systems. Many researchers work on control of an isolated intersection with fuzzy control method [1-5]. Few of them work in a simple isolated intersection [6,7]. A few of them work in a roundabout intersection [8,9]. Furthermore, some researchers work on T-intersection [10,3,11]. Many others worked on twoway intersections [3,12,13]. Few researchers apply a fuzzy logic system to the coordinated control of arterial or area traffic. Finally, the results showed that the traffic performance of Fuzzy Logic Traffic Control Systems has better performance than traditional traffic signal controls, specifically during heavy and uneven traffic volume conditions.

Existing Traffic Control System in Kuwait
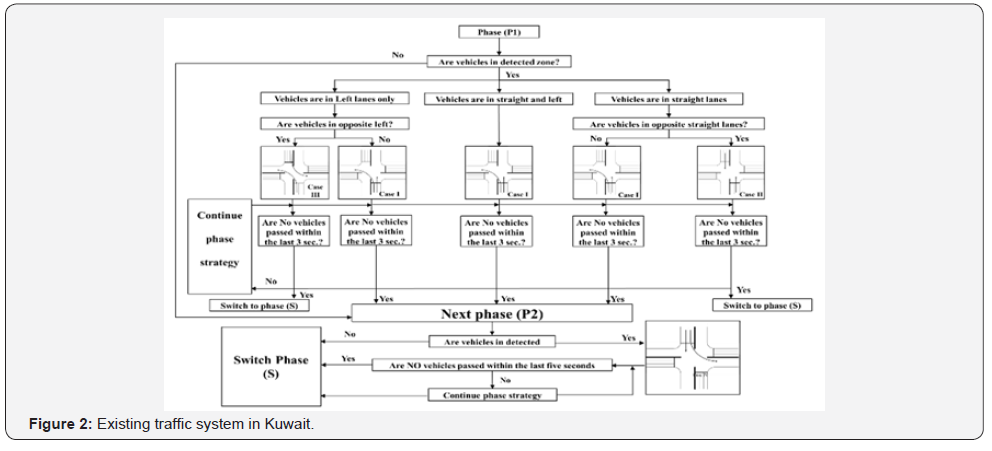
The signal control system strategies used in the State of Kuwait to control the flow and vehicle movements are either fixed time or semi-actuated signal control systems. The fixed time control system is used in all the intersections through the day in non-peak periods. Whereas, the semi-actuated control system is used only for the free time periods to adjust the green phases time continuously. The order and the sequence of the phases are fixed during the fixed time control system. The traffic signal timing plans are generated in Kuwait by a Synchro program, where each intersection has its timing and phasing strategy. The block diagram for the existing system in Kuwait is shown in Figure 2.
Proposed System
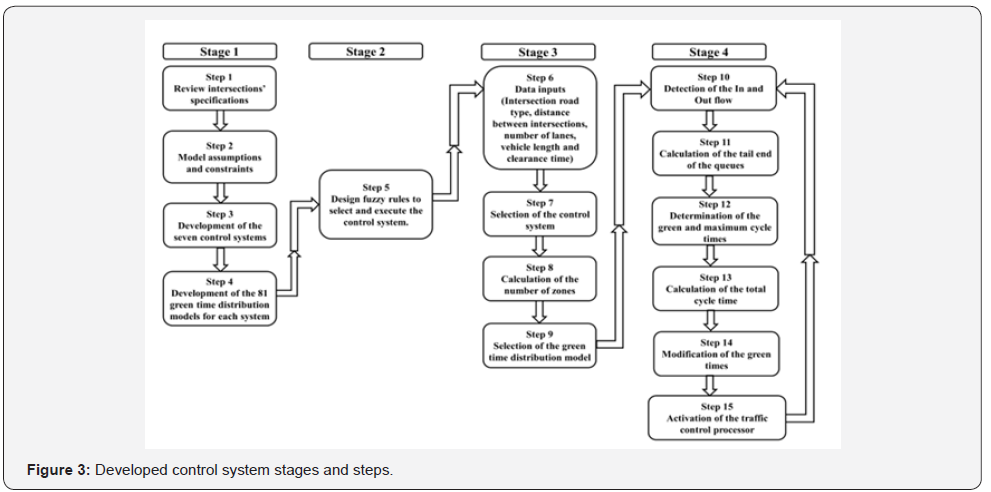
The developed control system is designed based on the principle being that the vehicle can move ahead only if there is a space for passing. The developed control system is designed using a fuzzy expert system that is different from the traditional control system methods. Detectors are placed at every entry and exit of the intersections to count the number of cars passing through the intersection. The developed control system is designed through four stages where each stage is designed through several steps. Each stage has different inputs and outputs and a different function. Figure 3 shows the design stages and the steps of each stage. Stage 1: design of the green time distribution models through steps 1 to 4, Stage 2: design of the fuzzy rules for the selection of signal timings through step 5, Stage 3: initialization of the control system through steps 6 to 9, and Stage 4: execution of the developed control system through steps 10 to 15.
Stage 1: Design of the Green Time Distribution Models
Stage 1 is realized through step 1 to step 4. At step 1, the intersections’ specifications, geometries, road types, vehicle movement strategies, traffic devices, control systems in addition to the fuzzy control systems are reviewed, analyzed and compared to develop the control system constraints and assumptions. At step 2, a list of system assumptions and constraints were specified as follow: the control system is designed for an unsynchronized simple intersection with four perpendicular phases. Each phase consists of three vehicle movements as straight-through, left, and right turns. The control system is designed for all traffic conditions (under saturation, saturation, and over saturation). The system is developed based on the flow that arrives and departs in a deterministic, uniform and steady way and distributed equally on the phases lanes. The distance between the intersections (Ld ) , ranged between (Ld )max = 2400m and ( ) 800 d L min = m. The distance length between two intersections is divided into several zones (Z). The minimum distance length unit zone ( ) 800 unit Z = m , and the last zone of the intersection phase is critical zone ( ) critical Z . The vehicle length to be used in system calculation is specified as a medium personal vehicle with length ( ) 7.5 lV = m . The timing parameters (cycle time, maximum and minimum phase green time, red clearance time and the queue detector location) for each road type and speed are specified as shown in Table 1.


At step 3, seven control systems are developed for a combination of intersection of two road types (collector, major arterial, and minor arterial) as shown in Table 2. The control systems are named by the intersection roads type.
For each control system, a scenario of eighty-one green time distribution models are developed and tabled at step 4. These tables are filled with the timing parameters (maximum cycle time, minimum green time, default time and maximum green time) that are specified based on the system designing rules as shown in Table 3.
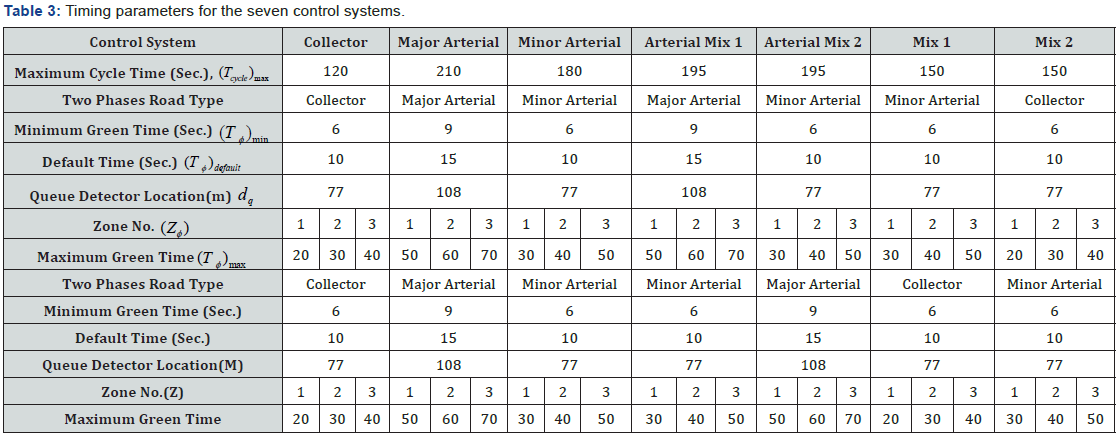
Timing parameters are specified for a specific number of zones, but for better accuracy, each zone is divided into intervals where each interval 0.5* 400 unit = Z = m except the first and second intervals. The first interval is specified by the distance between stop-line and queue detector location ( ) q d , and the second interval is specified by the distance between queue detector location and 400 m away from queue detector. The green time for each interval is calculated as the ratio between the interval length and the whole length as in Eqn (1).

Stage 2: Design of Fuzzy Rules for Signal Timings
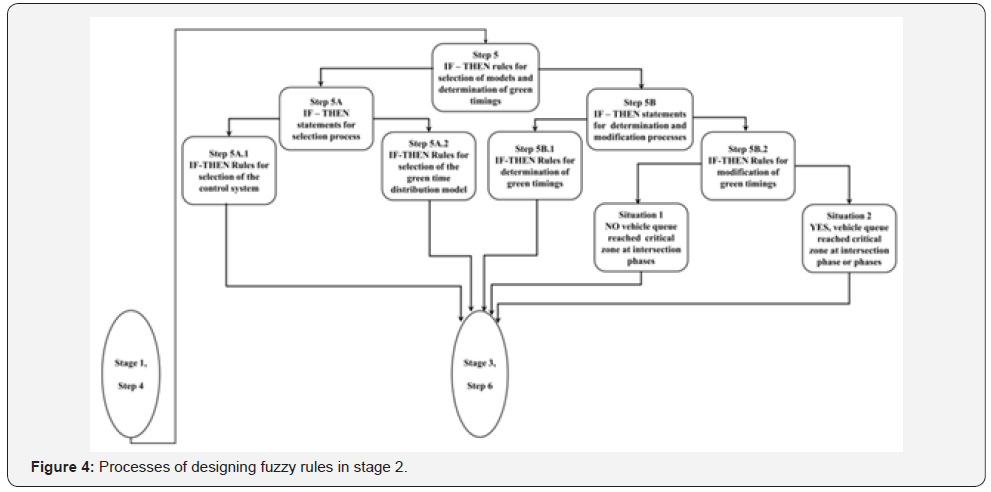
At step 5 sets of fuzzy rules are designed to determine the signal timing through two processes. The first process is to select the actual green time distribution model. The second process is to determine the intersection timing parameters. The fuzzy rules for the selection process are designed in step 5A which is divided into 5A.1 and 5A.2. The fuzzy rules for execution process of the developed control system are designed in step 5B, which in turn is divided into 5B.1 and 5B.2 as shown in Figure 4.
Stage 3: Initialization of the Control System
Stage 3 is designed through steps 6 to 9 for initialization of the control system. Several inputs are specified in step 6. These are to be used in different steps based on their calls and functions in the selection and actual run processes. These inputs are: the intersection in terms of road types (used for selection the control system model); distance between intersections ( ) d L (used for selection the green time distribution model); number of lanes (n ) φ ; vehicle length ( ) Vl (used for running process); and clearance time (Tc) (used for modification process). At step 7, the system processes the intersection roads’ types (input) by the first set of the fuzzy rules 5A.1, (Figure 4) to select the actual control system from the seven developed control systems. At step 8, the system retrieves the distance Ld) and calculates the number of zones at each intersection phase. At step 9, the system processes the calculated number of zones by the second set of fuzzy rules 5A.2, (Figure 4) to select the actual green time distribution model from the eighty-one models.
Stage 4: Execution of the Developed Control System
Stage 4 is designed through steps 10 to 15 for execution of the developed control system. Running the developed control system depends on the system inputs, fuzzy rules, and the flow in/out that is read by the system detectors. At step 10, the developed control system reads the traffic flow entering the intersection from the four directions by gridlock detectors that are placed at the entrance of the phases. At the same time, the control system reads the traffic flow exiting from the intersection to the surrounding four directions by step-line detectors that are placed at the stop-line. The system at step 11 calculates the vehicle residual using Eqn (2).

Where; Ri+1) φ is number of residual vehicles formed in the (cycle) i+1 , (Flowφ)out , number of vehicles entering the intersection phase during the cycle time, (Flowϕ)Out, number of vehicles exiting from the intersection phase during the green phase time, (Ri) φ , number of the residual vehicles from the (cycle) i+1 . After calculating the vehicle residual, the system calculates the queue length in each phase of the intersection as follow:

Where: Zφq is the queue length at the intersection phase in meter, nφ , number of lanes for the considered intersection phase, Vl , average vehicle length in meter.
At step 12, the control system processes the calculated vehicle queue to determine the green times (Tφ) , clearance time (Tc) , and the maximum cycle time (Tcycle)max from green time distribution model by applying the fuzzy rules (5B.1, (Figure 4). The control system at step 13 calculates the total cycle time ( )total T as follows:

Where; φ is the intersection phase, Tφ , the phase green time in the green time distribution models in second, Tc , the clearance time in second.
During the clearance time of the last phase, the system modifies the determined green time.
The modification process is an important process in the control system that happens during the clearance time of the last phase. The system at step 14 processes the vehicle queues and their locations in the intersection phases with the relation between (T)cycle and (T)total by applying the fuzzy rules (5B.2, (Figure 4) to modify and change the control system green phases times. At step 15, the control system sends to the traffic signal the actions for the next cycle timing. At step 16, the control system provides a report that includes intersection cycle time, green times, phases flow in (flow)In , phases flow out (flow)Out and vehicle queue length to be used in the system analysis.
Results
Real life test for the validity test of the control system was not possible due to the cost constraint and excessive time needed to acquire approvals from several ministries. Therefore, historical data are used for traffic simulation of an existing grid network controlled by the developed system. Hence, system performance can be measured and compared with the existing traffic control system. The developed control system is applied to a network of thirteen intersections in Kuwait town having the system conditions and criteria. The five central intersections in the network are specified for running the developed control system by using their data to measure the system performance. The results of the individual intersections and for the network are presented next.
Intersections’ results:
The sample network considered consists of five intersections, where each intersection consists of four phases (total of 20 phases in the sample network). Table 4 shows the simulated results of the developed system compared with the existing system for vehicle passing intersections’ phases and the time needed to pass through these intersections during four considered periods.
The simulated results of the developed system for periods 6:45 to 7:00 and 14:15 to 14:30 show that 55%, i.e. 11 out of 20 phases, of the network phases exhibit increases in both the number of vehicles crossing during the green phase relative to the performance of the existing system. Furthermore, 30% of the network phases exhibit increases in the number of passing vehicles, but they show decreases in the green time. That means, there is a loss in the green time in the existing control system and the green time is distributed in insufficient way where the developed control system distributes the green time based on the traffic flow. However, 10% of the network phases show decreases in both the number of passing vehicles and the green time. Where, the existing control system distributes extra green time where it is not needed. Results show that 5% of the network phases show decreases in the number of passing vehicles and increases in the green time.
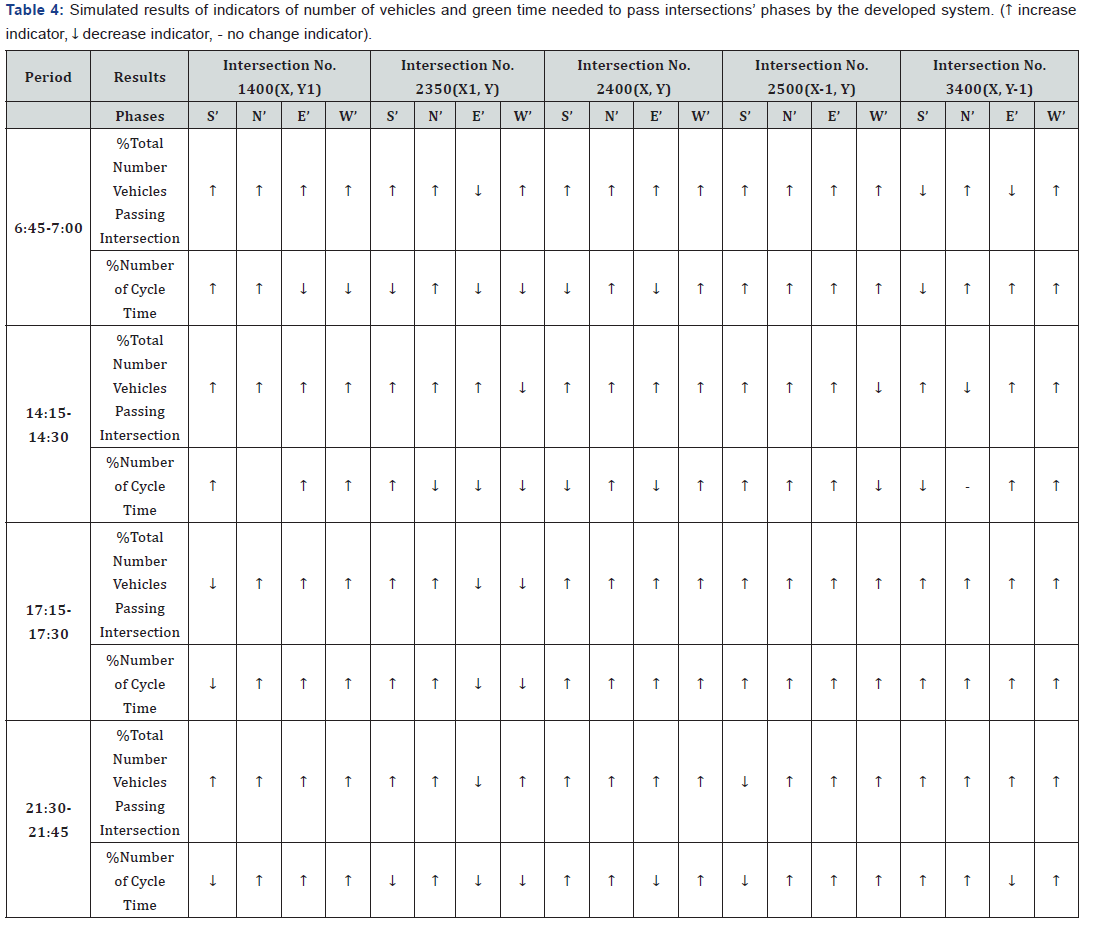
The results of the period 17:15 to 17:30 show that 85% of the network phases exhibit increases in both the number of passing vehicles and the green time. However, 15% of the network phases show decreases in both the number of passing vehicles and the green time. Furthermore, the results of the period 21:30 to 21:45 show that 65% of the network phases resulted in increases in both the number of passing vehicles and the green time. Whereas, 25% of the network phases show increases in the number of passing vehicles and decreases in the green time. For this same period, 10% of the network phases show decreases in both the number of passing vehicles and the green time. From previous analysis, 85%, i.e. 17 out of 20 phases, of the phases in the network show increases in the number of vehicles passing through phases during 6:45 to 7:00, 14:15 to 14:30, and 17:15 to 17:30 periods, while 100% of the phases in the network show increases during the period 21:30 to 21:45.
The simulated overall results of the developed system for the total number of vehicles passing intersections’ phases and the number of cycles during the four specified periods are shown in Table 5.
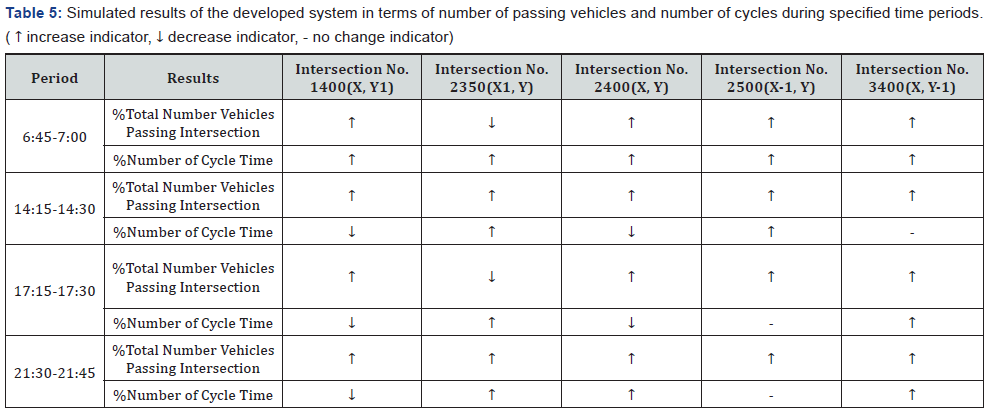
As can be observed from Table 5, 80% of the network intersections show increases in the total number of vehicles passing the intersections during the periods 6:45 to 7:00 and 17:15 to 17:30. On other hand, 100% of the network intersections show increases in the total number of vehicles passing the intersections during the periods 14:15 to 14:30 and 21:30 to 21:45. All the intersections showed higher number of cycles during specified period during 6:45 to 7:00. That means the developed system shortened and accelerated the cycles through the specified periods to reduce the waiting time. Forty percent of the intersections show increases during the periods 14:15 to 14:30 and 17:15 to 17:30, while 20% do not show changes in the number of cycles during these periods. Furthermore, 60% of the intersections Showed higher number of cycles during the period 21:30 to 21:45.
Table 6 presents the percentages of the differences in the number of vehicles passing intersections’ phases between the developed and existing systems, and the percentages of the differences in the green times needed to pass through these phases during the four periods (6:45 to 7:00, 14:15 to 14:30, 17:15 to 17:30, 21:30 to 21:45).
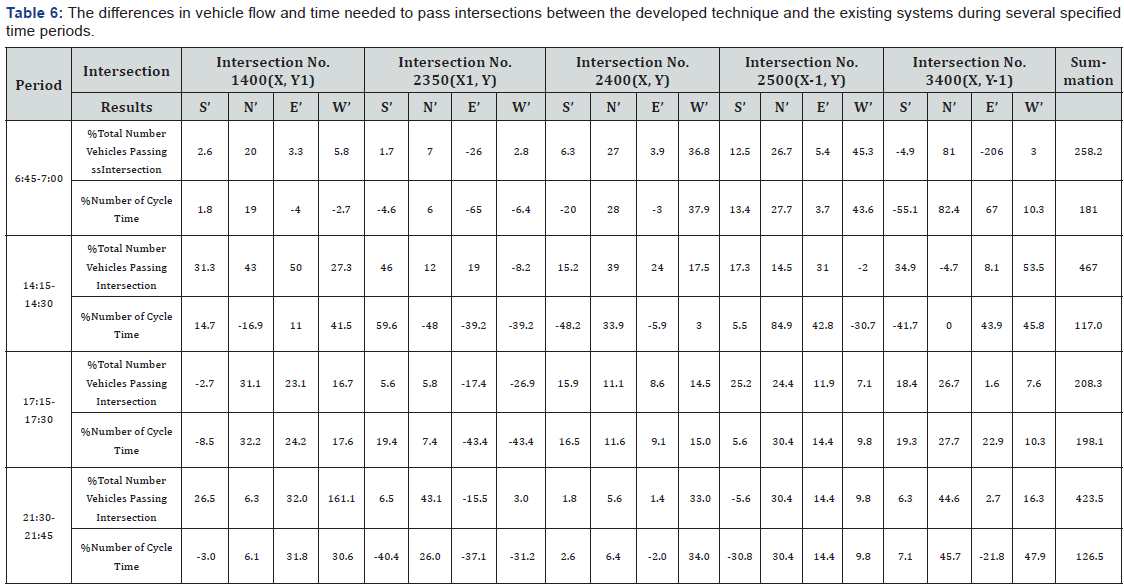

vFor period 6:45 to 7:00, the total percentages of the differences between number of vehicles passing the five intersections’ phases (20 phases) is increased by 258.2%. For the five intersections, the average percentage of the number of vehicles passing the intersections’ phases is increased by 12.91% (258.2%/20 phases).The total percentages of the differences between green time needed to pass through the five intersections’ phases is increased by 9.05% (181%/20 phases). By comparing the increasing of percentages in number of vehicles passing the intersections’ phases to the increasing of percentages in green time needed for vehicles to pass these phases, the increase in the green time is less than the increase of number of vehicles. This means, the developed control system improves the network performance by increasing number of vehicles passing the intersections’ phases during the period 6:45 to 7:00.
For period 14:15 to 14:30, the total percentages of the differences between number of vehicles passing the five intersections’ phases (20 phases) is increased by 467%. For the five intersections, whereas the average percentage of the number of vehicles passing the intersections’ phases is increased by 23.3% (467%/20 phases). The total percentages of the differences between green time needed to pass through the five intersections’ phases is increased by 5.85% (117%/20 phases).
For period 17:15 to 17:30, the total percentages of the differences between number of vehicles passing the five intersections’ phases (20 phases) is increased by 208.3%. For the five intersections, while the average percentage of the number of vehicles passing the intersections’ phases is increased by 10.4% (208.3%/20 phases). The total percentages of the differences between green time needed to pass through the five intersections’ phases is increased by 9.9% (198.1%/20 phases).
Furthermore, for period 21:30 to 21:45, the total percentages of the differences between number of vehicles passing five intersections’ phases (20 phases) is increased by 423.5%. For the five intersections, the average percentage of the number of vehicles passing the intersections’ phases is increased by 21.2% (423.5%/20 phases). The total percentages of the differences between green time needed to pass through the five intersections’ phases is increased by 6.3% (126.5%/20 phases)
Network results
The testing sample, as mentioned earlier, consisted of a grid network considering four directions; S’, N’, E’ and W’, within each direction a set of three successive intersections are considered. The increasing and decreasing tendencies in the percentage differences between number of vehicles passing through the network directions between the developed technique and the existing system, along with the necessary time for the vehicles to pass through these directions during certain tested periods, are shown in Table 7.
The results of period 6:45-7:00 show that the number of vehicles passing through the S’ direction is increased and the time to pass the vehicles through same directions is decreased, number of vehicles and the time needed to pass through the N’ direction are increased, as well as in W’ direction, while number of vehicles and the time needed to pass through E’ direction are decreased as shown in Table 7. That means, 25% of the network (direction S’) exhibits increase in the number of vehicles and decreases in the time needed to pass through S’ direction. And, 50% of the network (directions N’ and W’) exhibits increases in both the number of vehicles and the time needed to pass through these directions. Whereas, 25% of the network (direction E’) exhibits decreases in both the number of vehicles and the time needed to pass through this direction.
The results of period 14:15-14:30 show that the number of vehicles passing through the S’, E’ and W’ directions is increased and the green time to pass the vehicles through same directions is decreased. Whereas the number of vehicles passing through the N’ direction is decreased, and the green time needed to pass through the direction is increased. That means, 75% of the network (directions S’, E’ and W’) exhibits increases in the number of vehicles and decreases in the green time needed to pass through these directions. And, the 25% of the network (direction N’) exhibits decreased in the number of vehicles and increase in the green time needed to pass through N’ direction.
The results of period 17:15-17:30 show that the number of vehicles and the green time needed to pass through the S’, and N’ directions are increased. The number of vehicles passing through E’ direction is increased while the green time needed to pass through this direction is decreased. For direction W’, the number of vehicles and green time needed to pass through the direction are decreased. That means, 25% of the network (direction E’) exhibits increases in the number of vehicles passing through the direction and decreases in the green time needed to pass through this direction. Fifty percent of the network (directions S’ and N’) exhibits increases in the number of vehicles and the green time needed to pass through these directions. Furthermore, 25% of the network (direction W’) exhibits decreases in both the number of vehicles and the green time needed to pass through W’ direction.
The results of the last period 21:30-21:45 show that the number of vehicles and the green time needed to pass through the S’, N’ and W’ directions are increased. The number of vehicles passing through E’ direction is increased while the green time needed to pass through this direction is decreased. That means, 25% of the network directions represented by E’ exhibit increases in the number of vehicles passing through the direction and decreases in the green time needed to pass through this direction. While, the 75% of the directions (S’, N’, and W’) exhibits increases in both the number of vehicles and the green time needed to pass through these directions.
Conclusion
A fuzzy system is utilized to control the setting of a network of signalized intersections. The design consisted of two stages; a modelling system for green time distribution based on the intersections roads geometric specifications; and designing fuzzy rules that are implemented by using visual basic and computerbased program (Excel). The objective of the developed control system is to increase flow crossing the various intersection phases in lesser than the existing technique by distributing the green time of the intersections’ phases based on the traffic situation.
The developed control system is applied on five intersections in a grid of a network during four different periods during the day. It is evaluated by simulating a real network using actual data, and the performance results are compared with the historical results obtained by the existing control system. The developed control system reduces the waste in the green time of some phases that are specified by the existing system. This time loss is added to the other phases of the developed control system. The developed control system increases the intersection cycle time to its maximum to increase the green interval. That appears in the cases where the number of passing vehicles and the green time are increased.
Some results show that the green time is reduced by the developed control system while the number of passing vehicles is increased. It means that the associated phase has a time loss exercised by the existing system. The existing system specifies the green time as a constant at each period while the developed control system specifies it based on the traffic situation. The developed control system reduces the green time in some phases since the traffic of these phases does not reach its critical situation. This yields in decreasing the number of passing vehicles through these phases.
For the cases where the number of vehicles passing the phases is decreased and the green time is increased, it means that application of the developed control system rules increases the total cycle time to the maximum. The developed system distributes the green time among the four phases based on the traffic situation. Thus, when a phase has long distance and long queue, the control system gives this phase further green time.
The developed control system increases the number of vehicles passing through the network directions, and at the same time increases the time, which means that the developed system reduces the time loss from the other directions and adds it to the critical direction. The developed control system decreases the trip time, which means that the system eliminates the time loss from a direction and distributes it to the other directions. For the directions where the traffic is not in a critical situation, the developed system decreases both the trip time and the number of vehicles passing in these directions in the network.
The developed system increases the number of the passing vehicles at most phases for most periods while the green time is increased in some phases and it is decreased in other phases. The developed system reduces the time loss from some phases and adds it to the phase that needs it to increase the number of vehicles passing through. Furthermore, the green time is increased in some intersections while in others remains constant where the system increases the total cycle time to the maximum and adds the extra time to the phases in need. The time is decreased in some phases by the developed system while the passing vehicles number is increased where the developed control system reduces the time loss from these phases.
The total cycle time in the developed control system is specified dynamically based on the traffic situation and the vehicle queue at the phases. Thus, the number of cycles is varying based on the traffic situation.
The developed system can be used to control the intersections having similar specifications that the developed control system is built for. The intersections should be simple with four perpendicular phases, and consist of the collector, major arterial and minor arterial roads’ specifications. Each road should include three detectors (stop line, queue, and gridlock) to obtain actual traffic data. Any changes in the variables such as clearance time, vehicle length, number of lanes, etc. should be used as new inputs to run the system.
The green times in the green time distribution models could be distributed in any other way for the similar control system model’s specifications as number of zones and the probability of combination between them. The new green time distribution models can be used by the developed control system with the same fuzzy rules.
Acknowledgement
This work is extracted from a Ph. D thesis in Mechanical Engineering submitted to University of Bahrain.
References
- Nair BM, Cai J (2007) A Fuzzy Logic Controller for Isolated Signalized Intersection with Traffic Abnormality Considered, Intelligent Vehicles Symposium, pp. 1229-1233.
- Abbas SA, Sheraz SM, Noor H (2009) Fuzzy Rule-Based Traffic Signal Control System for Oversaturated Intersections, International Conference on Computational Intelligence and Natural Computing, Wuhan, China pp. 162-165.
- Hossein M, Zarandi F, Rezapour S (2009) A Fuzzy Signal Controller for Isolated Intersections, Journal of Uncertain Systems, 3(3): 174 – 182.
- Andrade M, Jacques MAP, Ladeira M (2010) Exploratory Studies on Network Operation of Fuzzy Signal Controllers, Lisbon, Portugal.
- Soh AC, Rhung LG, Sarkan HM (2010) MATLAB Simulation of Fuzzy Traffic Controller for Multilane Isolated Intersection, International Journal on Computer Science and Engineering 2(4): 924-933.
- Askerzade IN, Mahmud M (2011) Design and Implementation of Group Traffic Control System Using Fuzzy Logic, International Journal of Recent Research and Applied Studies 6(2): 196-202.
- Mehan S (2011) Introduction of Traffic Light Controller with Fuzzy Control System, International Journal of Electronics and Communication Technology 2(3): 119-122.
- Fahmy MM (2007) An Adaptive Traffic Signaling for Roundabout with Four-Approach Intersections Based on Fuzzy Logic, Journal of Computing and Information Technology 1: 33-45.
- Mwangi CM, Kangethe SM, Nyakoe GN (2012) Design and Simulation of a Fuzzy Logic Traffic Signal Controller for A Signalized Intersection, Kenya.
- Vonglao P (2007) The Solution of Traffic Signal Timing by Using Traffic Intensity Estimation and Fuzzy Logic, Australia.
- Zang L, Zhu W, Hu P, Li J (2012) Study on Intelligent Control Algorithm for Traffic Signals at Multi-Phase Intersections, Journal of Computational Information Systems 8: 10477-10484.
- Zaied AH, Al-Othman W (2011) Development of a Fuzzy Logic Traffic System for Isolated Signalized Intersections in the State of Kuwait, Expert Systems with Applications 38(8): 9434–9441.
- (2009) Manual on Uniform Traffic Control Devices (MUTCD) for streets and highways Washington, USA.


