Total Costs in The Brazilian Efficiency Model of Distribution System Operators: An Analysis
Sandra de Sousa Xavier*, Robinson Semolini and José Francisco Moreira Pessanha
Department of engineering, Goiano Federal Institute, Brazil
Submission: July 02, 2018; Published: August 07, 2018
*Corresponding author: Sandra de Sousa Xavier, Goiano Federal Institute, Street 88, number 310, Goiânia, Brazil, 74085-010, Tel: +55 31 9 9792 0708; Email: sandraxavier@gmail.com
How to cite this article: Sandra de Sousa Xavier, Robinson Semolini, José Francisco Moreira Pessanha. Total Costs in The Brazilian Efficiency Model of Distribution System Operators: An Analysis. Eng Technol Open Acc. 2018; 2(2): 555585. 10.19080/ETOAJ.2018.02.555585
Abstract
This study analyses the efficiency of electricity distributors in Brazil by considering total costs. The impact of the inclusion of total costs is evaluated with four different efficiency models using Data Envelopment Analysis and Stochastic Frontier Analysis. The analyses are conducted using a sample of 60 companies over two periods of time. The years 2008 to 2010 are used to calculate the efficiency frontier, and the years 2011 to 2012 are used to validate the methodology. The results show that, on average, the total costs estimated by benchmarking methods are approximately 7% lower than those observed in 2011 and 2012, that is, utilities need to reduce their total annual costs by approximately R$40 million on average.
Keywords: Efficiency; Electricity distributors; Methodologies; Electricity sector; Competitive; Environment; Incentive regulations; Operating costs; Distribution system operators; Territorial extension; Efficiency scores; Environmental variables; Tariff reviews; Remuneration; Minor components costs
Abbrevations: DSOs: Distribution System Operators; CR: Capital Remuneration; RD: Regulatory Depreciation; MC: Minor Components Costs; AC: Additional Costs; DEA: Data Envelopment Analysis; CRS: Constant Returns to Scale; VRS: Variable Returns to Scale
Introduction
Since 1990, number of infrastructure sectors around the world, including the electricity sector, have initiated long reform processes, replacing rate of return regulation with incentive regulation. Although the structures and methodologies adopted by the electricity sector have changed since the reforms, the main objective of efficiency improvement has been maintained [1].
Rate of return regulation, which was widely used before the reform process, had an adverse effect. Specifically, it encouraged companies to overinvest to obtain greater capital remuneration. This effect is known in the literature as the Averch-Johnson effect [2]. In this scenario, consumers are penalized by having to pay high tariffs.
Following the reform process, incentive regulation has become popular in the electricity transmission and distribution segments because it incentivizes companies to become more efficient [3]. Under this type of regulation, benchmarking techniques are applied to detect inefficiencies during the electricity transport process. In short, these techniques aim to compare similar companies in a competitive environment [4].
In Brazil, rate of return regulation is partially employed in the definition of capital costs, whereas incentive regulation is fully applied in the calculation of operating costs. However, economic regulation best practices follow a different trend: the adoption of incentive regulation for capital and operating costs. This practice is based on the existence of a potential trade-off between the two costs [1]. If they partially adopt rate of return regulations for capital costs and incentive regulations for operating costs, companies will simultaneously seek to raise the former and reduce the latter [5].
In this context, the present study proposes the use of total costs for the efficiency analysis of Brazilian distribution system operators (DSOs) from an incentive regulation perspective.
Several studies analyzing the efficiency of Brazilian DSOs have been published, but, to the best of our knowledge, no study has evaluated the economic effect of the adoption of total costs in the efficiency model. Xavier, Lima, Lima, and Lopes [6] propose an alternative form of efficiency analysis for Brazilian DSOs motivated by the great territorial extension. Despite the use of total costs with physical variables as a proxy, their study does not analyses the economic impact. Costa, Lopes, and Matos [7] evaluate operating cost models proposed by Brazilian regulators and discuss their main inconsistencies. Corton, Zimmermann, and Phillips [8] investigate the effect of incentive regulation on the operating costs of Brazilian DSOs, focusing on service quality. Altoé, Júnior, Lopes, Veloso, and Saurin [9] analyse the relationship between technical efficiency and some financial variables related to capital management using operating costs, costs related to service quality, and non-technical losses. Gil, Costa, Lopes, and Mayrink [10] examine the statistical correlation between efficiency scores and environmental variables using operating costs as inputs.
Despite the previous research, studies that investigate the incentive regulation effects on the total costs of Brazilian electricity distributors are still necessary. At the moment, this proposal is subject to an internal study by Brazilian regulator. However, given the global trend, a shift towards total costs will become essential. Thus, this study provides empirical evidence of the impact of adopting total costs on efficiency analysis by comparing four different models.
Brazilian Electricity Distribution Regulation
Since 2003, DSOs have been regulated by a price cap model, which specifies an average rate under which tariffs should be adjusted considering inflation and productivity targets (X factor). The electricity distribution segment has completed three tariff reviews (2003-2006, 2007-2010, and 2011-2014) and is completing the fourth (2015-2018). During a tariff review, capital and operating costs are redefined.
Capital Costs
Capital costs consist of capital remuneration (CR) and regulatory depreciation (RD). CR is the product of the remuneration rate and the net remuneration base, which corresponds to recognised investments and is not depreciated. RD is the product of the average depreciation rate and the gross remuneration base, which corresponds to total recognised investments.
In the fourth tariff review, the previous asset base was maintained and updated by the inflation index. New assets were valued according to the concept of the optimised and depreciated replacement cost, and a utilization index was applied to all accepted assets to reduce overinvestment.
A reference price base is used to calculate the average minor components costs (MC) and additional costs (AC), which make up the final fixed asset value (replacement new value-RNV), according to Equation 1:
RNV=ME+MC+AC (1)
Where:
ME-main equipment, such as circuit breakers and current transformers;
MC-fixed components associated with a particular constructional standard, such as control cables and insulators;
AC-setting up the good, consisting of design, management, assembly, and freight costs.
ME is valued according to the company’s price base, whereas MC and AD are valued according to the reference price base, which has created an incentive mechanism within capital costs.
The reference price base is structured in a modular way such that a module is associated with each type of ME according to the company’s group. The regulator applies a clustering technique to segregate 63 DSOs into five groups to take into account different levels of investment in electricity distribution systems. Each company has an average group cost considering differences between the concession areas. Once the prices of the ME, MC, and AC are known, the RNV is calculated.
Operating Costs
The Brazilian regulator applies Data Envelopment Analysis (DEA) as an efficiency analysis, with operating costs as an input. The outputs are the underground network, the over ground network, the high-voltage network, distributed energy, the number of consumers, non-technical losses, and service quality. The sample has 61 DSOs, with mean values for the variables during 2011, 2012, and 2013. The analysis preserves non-decreasing returns to scale and the input orientation. The regulator creates a confidence interval around efficiency scores because DEA has a deterministic aspect.
From these restrictions, an operating cost target is set to be reached over the regulatory period. At the time of review, the target is compared to real operating costs. The difference between real and target costs determines a regulatory trajectory. Part of the difference is incorporated at review time, and the remaining portion is considered in X Factor [11].
International Electricity Distribution Regulation
Unlike in the early years of reform, when regulators were worried about operating costs, a current emerging question is how to ensure that utilities set efficient investment levels. Over the years, DSOs have improved their performances in response to incentive regulations. However, significant investment is needed over the next few years, and this need, combined with incentives to reduce costs, accentuates a new challenge between efficiency and investment [12].
This broad view of total costs has several motivations, including the trade-off between operating and capital costs, the freedom of companies to choose different strategies, and the trade-off between cost efficiency and quality.
An analysis that segregates operating, and capital costs encourages substitution between these cost categories [13]. Consider a benchmarking model in which operating costs are the only input and the distribution network is the only output. Utilities will increase investments by focusing on maximizing output and the return to capital, resulting in greater operational efficiency; however, tariffs will increase.
Companies can adopt different combinations of operating and capital costs to operate and improve their networks [1]. When total costs are considered, a DSO is free to choose an optimal cost composition.
In addition, total costs play an important role in service quality analysis. As more DSOs invest in network reliability, total costs and quality improvement marginal costs will be higher. Therefore, a total cost model is more appropriate to evaluate this possible trade-off [14].
Finally, a total cost model is considered one of the best regulatory practices, according to Haney and Pollitt [15]. A similar result is presented by Mesquita [16], who investigates aspects of the efficiency analyses currently employed by European and Latin American countries. The analysis considers ten European countries and eight Latin American countries and finds that most of the countries surveyed use total costs.
However, adopting total costs in efficiency models can also mean a strong incentive to reduce capital costs and may jeopardize long-term investments [17]. The possible adverse effect of discouraging investment and jeopardizing the future performance of energy distribution networks has been pointed out as one of the possible causes for the non-adoption of total costs by the Brazilian regulator. However, the regulator recognizes its use as an international trend:
‘Discussions like this point toward benchmark model based on total cost, which has been a trend in international regulatory experience. However, a breakthrough in this direction requires a much deeper study and certainly a space for methodological transition and adaptation of agents’ [18].
This adverse effect is not observed by Cullmann & Nieswand [19] when analyzing incentive regulation effects on the investment behavior of 109 German DSOs. The results show an increase in investments from 2009 for both public and private companies. The authors conclude that an analysis of investment decisions should include all institutional aspects of incentive regulation.
From a similar perspective, Poudineh & Jamasb [20] explore the determinants of the investment decisions of 129 Norwegian DSOs in the period from 2004 to 2010. The results show that the main factors influencing these decisions are the rate of return under the previous period’s investment, socio-economic costs, and the lifespan of useful assets.
Cambini, Fumagalli, & Rondi [21] investigate the relationship between incentives, service quality, and the investment levels of Italian DSOs. The results indicate a causal relationship between incentives and investment levels, and, in the process of performance improvement, penalties are more effective than rewards are.
Benchmarking Methods
The most recent advances in the field of efficiency, microeconomics, and econometrics studies are focused on efficiency frontier analysis. Given the impossibility of observing theoretical efficiency frontiers, efficiency is determined by empirical boundaries, estimated by observing the minimum use of inputs given an output level or the maximum output given an input level. This study uses DEA and Stochastic Frontier Analysis (SFA) in estimating the efficiency of Brazilian DSOs.
Data Envelopment Analysis
DEA is a nonparametric methodology that uses real data to measure the relative efficiency of a DMU. It was proposed by Charnes, Cooper & Rhodes [22] to address the efficiencies of companies operating in constant returns to scale (CRS) and further extended by Banker, Charnes & Cooper [23] to variable returns to scale (VRS).
This efficiency analysis can be focused on input reduction or output expansion. The result from an input-oriented model is the maximum reduction possible in the inputs level for a given level of output. With an output-oriented focus, the model seeks the maximum output quantities that can be generated by the actual level of inputs used by the company. The efficiency scores can vary from 0 to 1, where 1 denotes the efficient company
The majority of the DEA models consider either CRS or VRS. For CRS model, outputs and inputs increase (or decrease) by the same proportion along the frontier. Where the technology exhibits increasing, constant or decreasing returns to scale along different segments of the frontier, the VRS model is indicated. The CRS model assesses the overall technical and scale efficiency, while a VRS model measures only the technical efficiency.
The efficiency score of the ith company of N companies in CRS models takes the form specified in Equation 2, where θ is a scalar (equal to the efficiency score) and λ is a Nx1 vector that represents the weight of each Decision-Making Unit in the construction of the reference company. Assuming that the companies use E inputs and M outputs, X and Y represent ExN input and MxN output matrices, respectively. The input and output column vectors for the ith company are represented by xi and yi respectively. In Equation 2, company i is compared to a linear combination of sample companies which produce at least as much of each output with the minimum possible amount of inputs. The Equation 2 is solved once for each company.
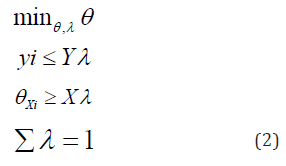
For VRS models, a convexity constraint Σλ = 1 is added that ensures that the company is compared against other companies of a similar size.
Stochastic Frontier Analysis
SFA, a parametric method, was originally developed by Aigner, Lovell, and Schmidt [24] and Meeusen and Broeck [25] and allows the estimation of the inefficiency associated with a production function or cost.
The stochastic frontier consists of
(i) a deterministic component,
(ii) a stochastic component representing random error in the estimation of the frontier, and
(iii) an inefficiency component for each company. It is calculated, in most studies, using an input-oriented Cobb- Douglas functional form with stacked data, as in Equation 3.

The SFA model allows the error to be disaggregated into two independent components, vit and uit, and to be uncorrelated with the explanatory variables [26].
The component vit is random noise that represents deviations of the deterministic component from the frontier due to the non-inclusion of an explanatory variable or measurement error. We adopt the assumption that the error vit is independent and identically distributed and normally distributed with a zero mean and constant variance. This error term has all the characteristics of the error term used in the classical linear regression model.
The uit component is a positive error term that reflects the cost inefficiency of firms. This term indicates the cost excess relative to the stochastic frontier. When this component is null, the firm is at the efficiency frontier. Aigner, Lovell, and Schmidt [24] propose using the half-normal distribution as the probability distribution for this term, as in Equation 4:

This model is referred to as SFA-ALS. Even today, this is the most common specification used in SFA models found in the literature. Subsequently, other distributions have been proposed for the u term, the most common of which are the exponential, normal truncated, and gamma distributions [26].
Methodology
Choice of variables
The choice of inputs and outputs is a crucial aspect of benchmarking methods, especially for DEA, as the discriminatory power of these methods decreases as the number of variables increases [27]. Therefore, a researcher needs to be parsimonious in choosing variables, opting for those that best describe the evaluated process.
There is no consensus on the best variables to describe the electricity distribution process. Jamasb and Pollitt [13] investigate the most frequently used variables in benchmarking studies. Among inputs, the following stand out: operating costs, number of employees, transformer capacity, and network extension. With regard to outputs, distributed energy and the number of consumers are the most common choices.
This study uses monetary and physical variables that are widely adopted in benchmarking studies as well as non-technical losses and service quality indicators. The monetary variables are operating and total costs. The physical variables are the same as those adopted by the Brazilian regulator in the current tariff cycle, namely, the underground network, the over ground network, the high-voltage network, distributed energy, and the number of consumers. Non-technical losses and the service quality indicators are also the same as those adopted by the Brazilian regulator that consider the difference between actual and expected values [18].
Data
An efficiency analysis is conducted using data from 60 Brazilian DSOs from 2008 to 2012. The dataset can be found at the website of the Brazilian regulator (www.aneel.gov.br) and was divided into two periods: 2008 to 2010 for the efficiency frontier calculation and 2011 to 2012 for the model validation.
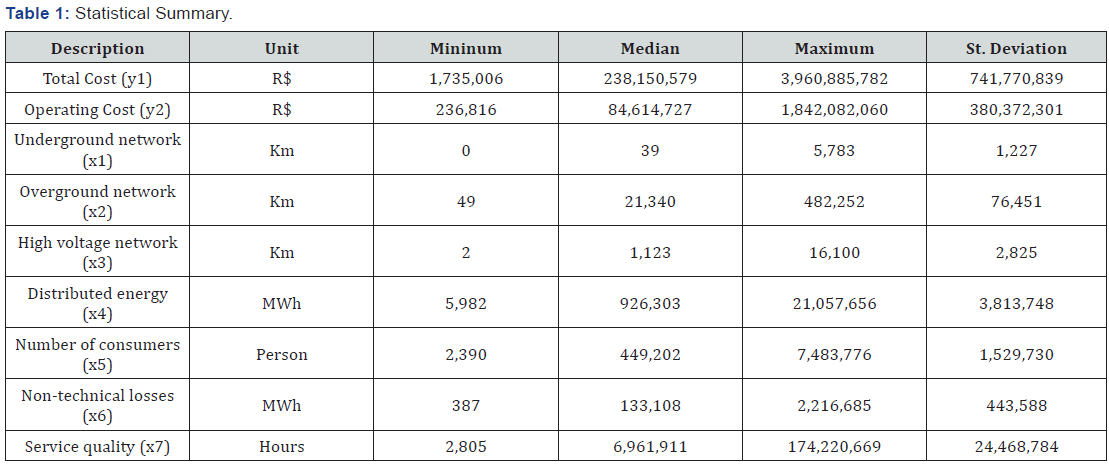
The methodology used to calculate capital costs was the same as that used by the regulator in Technical Note 185/2014 from the Economic Regulation Superintendence [18]. Operating costs and outputs were the same as those from Technical Note 66/2015 from the Economic Regulation Superintendence database [11]. Table 1 shows sample descriptive statistics.
This data shows great variability between companies, especially for underground networks, which are only found in the capitals of large countries.
Models
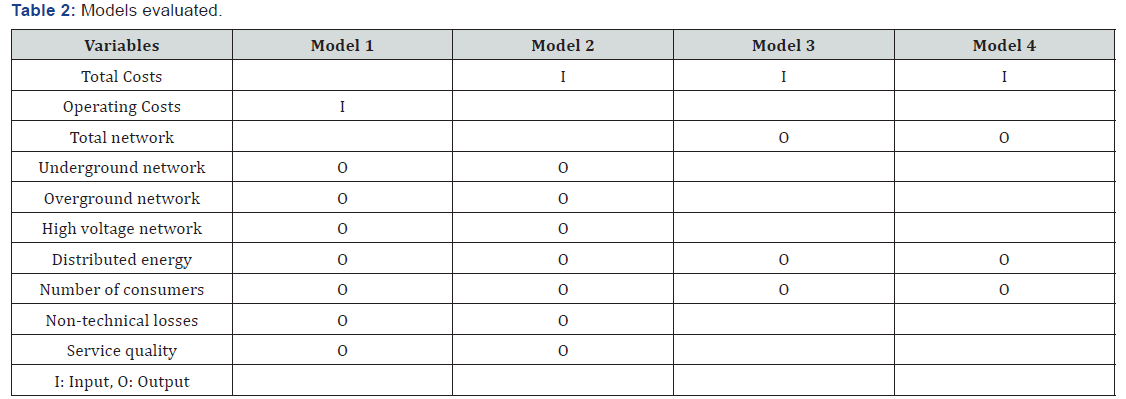
Four distinct models are evaluated in Table 2: three DEA models and one SFA model. The first two models were selected to evaluate the impact of total costs on efficiency analysis. This choice was based on the literature review presented in Section 3. The last two models were included in the analysis to validate the DEA results using SFA, a guideline recommended by Bogetoft and Otto [28].
Results
The proposed methodology was applied to the four models defined in Section 5.3 using data from sixty Brazilian DSOs from 2008 to 2010. Models 1, 2, and 3 were based on DEA using an input orientation and non-decreasing returns to scale. Model 4 applied SFA and was estimated using an input-oriented cost function. Table 3,4 shows the estimated results.
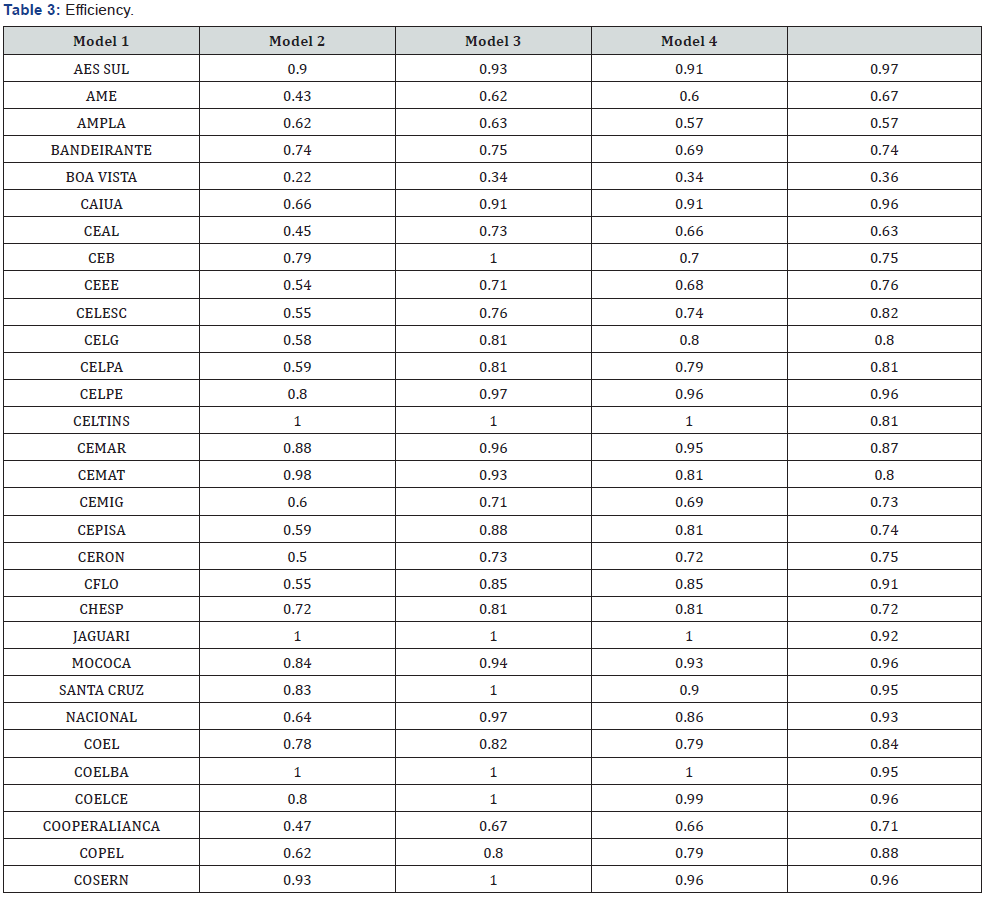

The results indicate that DSOs have average efficiency scores of 0.70, 0.84, 0.80, and 0.81 in Models 1, 2, 3, and 4, respectively, which indicates room for improvement.
Model 1 considers ten utilities as efficient, including three small and seven large companies. Two of them, Eletropaulo and Light, are located in high consumer density areas. Others that have reached the frontier do not have such high densities, which implies relatively efficient input management. Other utilities have an average efficiency of 0.67. This inefficiency can be explained by low load densities and dispersed consumers, which make such areas expensive and challenging for energy distribution. Three CPFL Energia DSOs are considered efficient: Piratininga, CPFL Paulista, and RGE. These results suggest a possible advantage associated with holding characteristics, as Semolini [29] also concludes. Twenty-nine utilities have efficiency scores under 0.67, including AME, Ene. Paraíba, Ene. Sergipe, CEMIG, and CEEE. The first three are located in the Brazilian north or northeast, which are characterized as less urbanized regions with the lowest monthly income [30]. Analysis indicates that these companies should reduce operating costs by 55% on average.
Model 2, which considers total costs as inputs, indicates lower efficiency levels for three DSOs (Piratininga, CPFL Paulista, and Light). New companies are considered efficient, such as, for example, CEB, Coelce, and Cosern. Comparatively, these companies have partial productivities that are higher than their segment averages, especially for total costs and the highvoltage network ratio. Therefore, some companies’ efficiencies decrease under Model 2, whereas those of others increase, and the segment average efficiency rises from 0.70 to 0.84. The efficiency scores have a correlation of 0.76 with those of Model 1. Light is located at the efficiency frontier in Model 1. However, with total costs, the DSO receives a score of 0.90; a reduction of 10% in its efficiency. On the other hand, Cepisa achieves better results. Under Model 1, it has an efficiency of 0.59 compared to Celtins, Coelba, and João Cesa. Under Model 2, the company obtains a score of 0.88, and its peers are Celtins and Coelba. This evidence indicates that Model 1 can penalise companies that are efficient in total costs and can favour those that are efficient in operating costs.
Model 1 can distort the incentives given to companies. For example, Coelce obtains an efficiency of 0.80 in Model 1 and of 1.00 in Model 2. These results corroborate the existence of a possible trade-off between operating and capital costs. Therefore, models with total costs are more appropriate for efficiency analysis [1]. In fact, Model 1 does not capture the aspect of DSOs’ total costs.
In contrast with the previous models, Model 3 considers only seven companies to be efficient. CEB, Coelce, and Cosern have lower scores following the changes to the model, such as the exclusion of service quality and non-technical losses and the aggregation of the distribution network. Some companies, such as Coelba and RGE, remain on the frontier in all three models. The results of Model 3 results have a 0.89 correlation with those of Model 2. In addition, the efficiency of Light is considerably lower in Model 3, with a value of only 0.61. The company obtained scores of 1.00 and 0.90 in Models 1 and 2, respectively. This change can be explained by inclusion of the non-technical loss variable, given that difference between the expected and real values is minimal.
Model 4 estimates efficiency using SFA and estimates the cost function using the Cobb-Douglas functional form. An exponential probability distribution is used to estimate the inefficiency term of the u error. The coefficient on the logarithm of the products is shown in Table 5.

Table 5 shows that all estimates of the product coefficients are significant at the 5% level. The significance of the variance parameters of the error components, σ and λ, validate the use of the SFA stochastic model. We observe that the most important product is the distributed energy, which has an importance of almost 50% between the three products. The sum of the coefficients of the three products is 1.01, indicating the possibility of constant returns to scale. The results of the application of this model have a 0.76 correlation with those of Model 3, since Model 3 is constructed using the same inputs and products as this model is.
Of the sixty DSOs, thirteen companies have efficiencies greater than 0.95, and only two companies have efficiencies less than 0.5. Of these two DSOs, one is João Cesa, with a score of 0.45, but in Models 1, 2, and 3, this company is considered a benchmark. This company has the smallest outputs in the sample, and this fact may be distorting its efficiency.
Discussion
To analyses the economic impacts of the different models, we calculate:
(1) the average segment efficiency for each model,
(2) each distributor’s score divided by the average segment efficiency,
(3) the product of the previous result and the average real total cost from 2008 to 2010, and
(4) the comparison of the previous result with the average real total cost from 2011 to 2012. The results can be seen in Table 6,7.
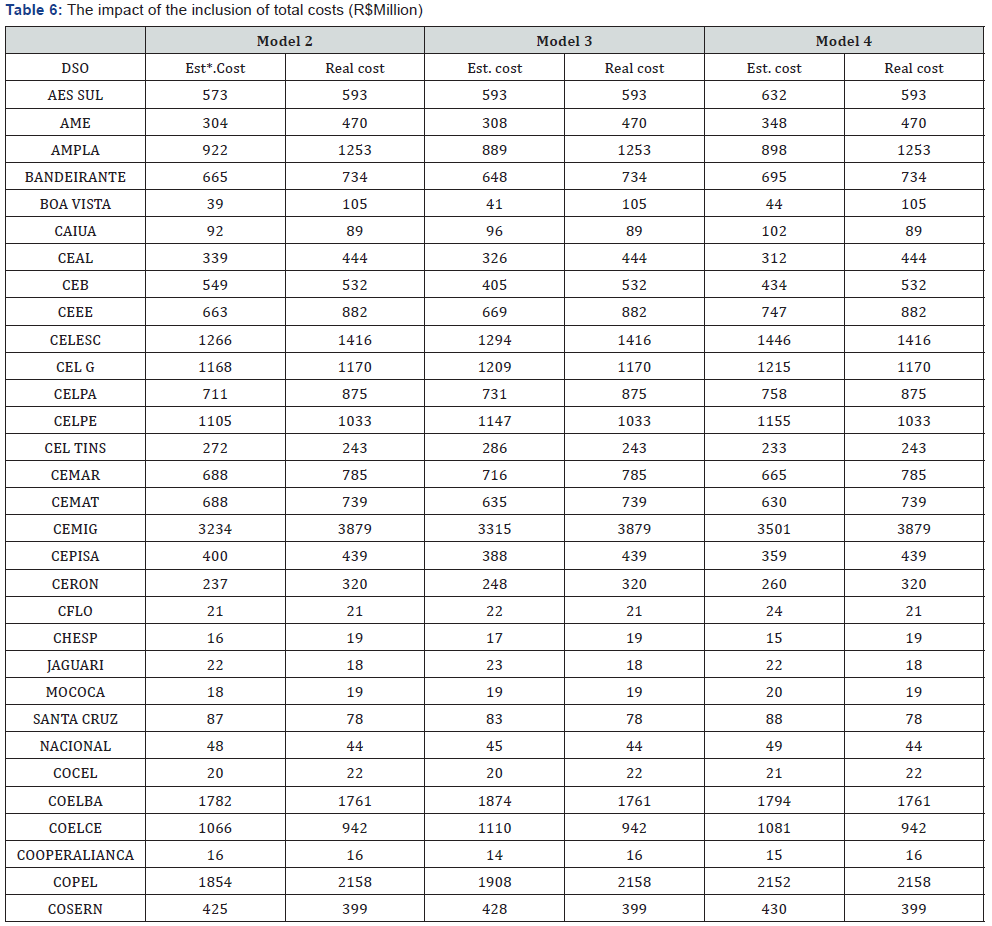
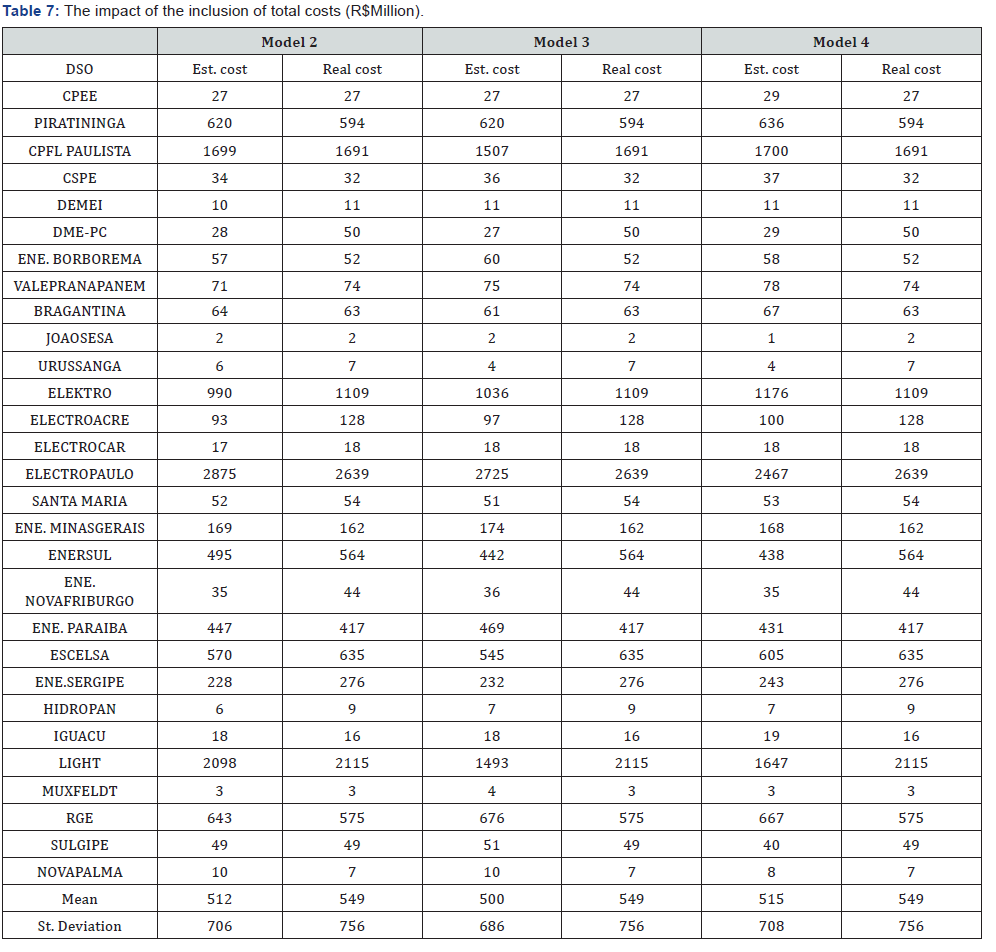
Comparing the total costs estimated by Model 2 and the real values, we find a necessary average reduction of R$37 million, which is approximately 7% of real total costs. A similar result was found by Yu, Jamasb, and Pollitt [29], who analyse the efficiency of twelve English DSOs from 1995 to 2003. Of the sixty companies evaluated, thirty-three exhibit total costs that are higher than those defined by DEA. According to Model 2, AME needs to reduce cost by R$166 million or, in percentage terms, 35% of its total costs. Another inefficient large company is Ampla, which spends R$331 million more relative to others. Other DSOs have lower real total costs; RGE is a member of this group, with a real total cost of R$575 million versus an expected cost of R$643 million.
Coelce also uses comparatively fewer inputs, about 12% fewer than expected. Some companies have real and expected values that are very close, requiring no decrease or increase. These companies include Coelba, CPFL Paulista, and Light.
Model 3 suggests an average reduction of R$49 million, or approximately 9% of real total costs. Giannakis et al. [1] make a similar diagnosis when evaluating UK utilities between 1991 and 1999. About half of companies need to reduce their costs. This model does not include the quality and non-technical losses variables, as in other studies [1,14,29-33,]. AME remains inefficient, needing to reduce costs by R$162 million, which is R$4 million less than in Model 2. Ampla needs to reduce costs by R$364 million. As in the previous model, some utilities prove to be efficient, such as, for example, RGE, which spent R$100 million less than expected. Coelce maintains its good performance in this model, and AES Sul has an appropriate level of total costs.
Model 4 presents the lowest required cost reduction, with a value of approximately R$34 million, or 6% of costs. This result is to be expected since SFA considers data error. This model does not include environmental variables since they were not significant. These results corroborate previous work, such as that by Yu et al. [29], who conclude that environmental factors do not have significant economic or statistical impacts on the overall performances of English DSOs. The model finds the sharpest reductions with respect to Boa Vista (58%) and João Cesa (51%). In the previous models, the latter is considered efficient, with opportunities to increase total costs by 3% and 8%, respectively, in Models 2 and 3. Another utility with a similar result is Eletropaulo, which can increase total costs by R$236 million in Model 2, can increase them by R$86 million in Model 3, and should reduce costs by R$172 million in Model 4. Elektro moved in the opposite direction, as it is evaluated positively by Model 4 but needs improvement in Models 2 and 3.
Finally, when analyzing the results of all models, we find that, in average percentage terms, the total costs estimated by the benchmarking methods are not considerably smaller than those defined by the Brazilian regulator.
Conclusion
Efficiency analysis is receiving considerable attention from regulators in the electricity sector, especially in the distribution segment. Due to the natural monopoly characteristics of the electricity distribution process, utilities are not subject to market forces.
This study simulated a virtual competitive scenario among Brazilian utilities. DEA and SFA were used for efficiency analysis. Both methods calculate an efficiency frontier based on the evaluated company’s inputs and outputs to evaluate the impact of total costs.
The novelty of this study is in the use of total costs as inputs in efficiency models, specifically in the Brazilian case. Although total costs have already been evaluated by other studies, mainly in European countries, they have not been applied in a country with a considerable distribution segment growth rate, such as Brazil.
Four different models were studied. Comparing Model 1 and Model 2 allowed us to evaluate the impact of total costs on efficiency, whereas the comparison between Model 3 and Model 4 was useful to understand the robustness of the results. In the first comparison, 88% of utilities had a higher efficiency score in Model 2, with a mean difference of 0.14. In the second comparison, the efficiencies of 39 companies increased with SFA, with a correlation between the results of 0.76.
When evaluating the impact of the use of incentive regulations in total costs, we find that DSOs need to reduce their costs by an average of R$ 40 million per year, which is around 7% of total costs. This efficiency gain will affect consumers, who will pay lower tariffs.
This study evaluated the efficiency of Brazilian DSOs using total costs as an input; future studies could focus on superefficient Brazilian companies.
References
- Giannakis D, Jamasb T, Pollitt M (2005) Bench marking and incentive regulation of quality of service: an application to the UK electricity distribution networks. Energy Policy 33(17): 2256-2271.
- Averch H, Johnson LL (1962) Behavior of the firm under regulatory constraint. American Economic Review 52(5): 1052-1069.
- Ergas H, Small J (2001) Price Caps and Rate of Return Regulation. Network Economics Consulting Group.
- Lowry MN, Getachew L (2009) Statistical benchmarking in utility regulation: Role, standards and methods. Energy Policy 37(4): 1323- 1330.
- Jamasb T, Pollitt M (2003) International benchmarking and regulation: An application to European electricity distribution utilities. Energy Policy 31(15): 1609-1622.
- Xavier SS, Lima JWM, Lima LM, Lopes ALM (2015) How efficient are the Brazilian Electricity Distribution companies? Journal of Control, Automation and Electrical System 26(3): 283–296.
- Costa MA, Lopes ALM, Matos GBBP (2015) Statistical evaluation of Data Envelopment Analysis versus COLS Cobb–Douglas benchmarking models for the 2011 Brazilian tariff revision. Socio-Economic Planning Sciences 49: 47-60.
- Corton ML, Zimmermann A, Phillips M (2016) The low cost of quality improvements in the electricity distribution sector of Brazil. Energy Policy 97: 485-493.
- Altoé AV, Júnior NC, Lopes ALM, VelosoTRM, Saurin V (2017) Technical efficiency and financial performance in the Brazilian distribution service operators. Socio-Economic Planning Sciences 59: 79-92.
- Gil DR, Costa MA, Lopes ALM, Mayrink VD (2017) Spatial statistical methods applied to the 2015 Brazilian energy distribution benchmarking model: Accounting for unobserved determinants of inefficiencies. Energy Economics 64: 373-383
- ANEEL (2015) Technical Note no 66/2015-SRM/SGT/ANEEL Brasília.
- Poudineh R, Jamasb T (2015) A New Perspective: Investment and Efficiency under Incentive Regulation. The Energy Journal 36(4): 241- 263.
- Jamasb T, Pollitt M (2001) Benchmarking and regulation: international electricity experience, Utilities Policy 9(3): 107-130.
- Growitsch C, Jamasb T, Muller C, Wissner M (2010) Social cost-efficient service quality - Integrating customer valuation in incentive regulation: Evidence from the case of Norway. Energy Policy 38(5): 2536–2544.
- Haney AB, Pollitt MG (2009) Efficiency Analysis of Energy Networks: An International Survey of Regulators, Energy Policy 37(12): 5814- 5830.
- Mesquita RB (2017) Regulação de Tarifas de Distribuição de Energia Elétrica: uma análise comparativa entre reguladores europeus e latinoamericanos. Thesis, Federal University of Minas Gerais.
- Pollitt M (2005) The role of efficiency estimates in regulatory price reviews: Ofgem’s approach to benchmarking electricity networks. Utilities Policy 13(4): 279-288.
- ANEEL (2014) Technical Note no 407/2014-SRE/ANEEL Brasília.
- Cullmann A, Nieswand M (2016) Regulation and investment incentives in electricity distribution: An empirical assessment. Energy Economics 57: 192-203.
- Poudineh R, Jamasb T (2016) Determinants of investment under incentive regulation: The case of the Norwegian electricity distribution networks. Energy Economics 53: 193-202
- Cambini C, Fumagalli E, Rondi L (2016) Incentives to quality and investment: evidence from electricity distribution in Italy. Journal of Regulatory Economics 49(1): 1-32.
- Charnes A, Cooper W, Rhodes E (1978) Measuring the efficiency of decision-making units, European Journal of Operational Research 2(6): 429-444.
- Banker RD, Charnes RF, Cooper W (1984) Some Models for Estimating Technical and Scale Inefficiencies in Data Envelopment Analysis. Management Science 30(9): 1031-1142
- Aigner D, Lovell CAK, Schimidt P (1977) Formulation and estimation of stochastic frontier production function. Journal of Econometrics 6(1): 21-37.
- Meeusen W, Broeck JVD (1977) Efficiency estimation from cobbdouglas production functions with composed error. International Economic Review 18(2): 435-444.
- Coelli T (2005) An introduction to efficiency and productivity Analysis. Springer.
- Kirschen R, Allan G Strbac (1997) Contributions to Individual Generators to Loads and Flows. IEEE Transactions on Power Systems 12(1): 52-60.
- Bogetoft P, Otto L (2011) Benchmarking with DEA, SFA, and R. Springer Science & Business Media.
- Semolini R (2014) Eficiência dos Custos Operacionais das Empresas de Distribuição de Energia Elétrica no Brasil. Thesis, State University of Campinas, Brazil.
- IBGE (2018) Avaliable at: www.ibge.gov.br. Accessed June 4.
- Yu W, Jamasb T, Pollitt M (2009) Does weather explain cost and quality performance? An analysis of UK electricity distribution companies. Energy Policy 37(11): 4177-4188.
- Coelli T, Crespo H, Paszukiewicz A, Perelman S, Plagnet M, et al. (2008) Incorporating Quality of Service in Benchmarking Model: An Application to French Electricity Distribution Generators. Disponível em.
- Growitsch C, Jamasb T, Pollitt M (2009) Quality of service, efficiency and scale in network industries: an analysis of European electricity distribution. Applied Economics 41(20): 2256-2570.
- Martirosyan AT, Kwoka J (2010) Incentive regulation, service quality, and standards in U.S. electricity distribution. Journal of Regulatory Economics 38(3): 258–273.
- Cambini C, Croce A, Fumagalli E (2014) Output-based incentive regulation in electricity distribution: Evidence from Italy. Energy Economics 45: 205-216.


