


Experimental Study on Draw-Ability of Filament Yarns Produced from Recycled and Bottle Grade PET
Abbasi M1*, Mojtahedi MRM2 and Kotek R3
1 Department of Textile Engineering, Faculty of Engineering, University of Guilan, Rasht, Iran
2 Textile Engineering Department, Amirkabir University of Technology, Tehran, Iran
3 College of Textile, North Carolina State University, Raleigh, NCSU, USA
Submission: December 16, 2019; Published: March 13, 2020
*Corresponding author: Abbasi M, Technical Department, University of Guilan, Rasht, Iran
How to cite this article: Abbasi M, Mojtahedi MRM, Kotek R. Experimental Study on Draw-Ability of Filament Yarns Produced from Recycled and Bottle Grade Pet. Curr Trends Fashion Technol Textile Eng. 2020; 6(3): 555691. DOI: 10.19080/CTFTTE.2020.06.555691
Abstract
In this study, draw-ability of continuous yarns (filament) from recycled bottle grade PET (R-PET) and new bottle grade PET (BG-PET) were compared. Virgin fiber grade PET (FG-PET) was used as the control. Spinning and draw machine were performed separately in this study. The draw ratios were 2.8, 3.0, 3.2, and 3.55. It was found that higher draw ratios result in higher density and crystallinity for all samples. This increase was larger in the case of FG samples, especially at higher draw ratios. This suggests that crystallization ability in the drawing process for the recycled polymer is weaker than the new polymer. Higher initial modulus of yarns produced at higher draw ratios is confirmed by the increase in their crystallinity values. Higher values of apparent crystal size of R-PET and BG-PET samples than those of FG-PET samples are in accordance to their initial modulus changes. In the draw ratio of 3.2, R-PET converted to Fully Drawn Yarn (FDY). In this draw ratio, tenacity of R-PET (3.18g/den) showed 11% higher value compared to that of FG-PET (2.83g/den). The drawn R-PET filament yarn presented desirable properties compared to the drawn FG-PET yarn. This might be attributed to the higher intrinsic viscosity and birefringence of the R-PET yarn. As a result of an increase in draw ratio, there is an advanced considerable increase in the tensile strengths and initial modulus of filaments in all samples.
Keywords: Filament; Recycling; PET; Draw ratio; FDY
Introduction
Currently a wide range of goods, such as mineral water, soft drinks, and other foods are kept in PET containers, and many more are being added to the list every day. This condition is set to continue unless a high-performance biodegradable polymer is found. However, increasing use of PET has resulted in post-consumer waste in rubbish and has caused serious ecological problems. Unlike other polymer waste, PET can be regenerated into superior and usable end products [1]. The chemical nature of polyethylene terephthalate allows easy recyclability in all known recycling ways. Recycling of polyester has become a significant process from an environmental point of view, and it has been given excellent commercial opportunity because of its widespread use and the availability of PET bottles, packages, fibers, etc. [2]. As the mechanical recycling is well established, chemical recycling is highly dependent on the method in which the de- polymerization is performed [3]. According to new market predictions, global consumption of PET bottles will increase to almost 19.1 million tons by 2017 [4]. They are sorted by type (PET, HDPE, LDPE, etc.) and color. The PET bottles are then separated from their labels and caps and washed several times to remove any adhesives and other possible contaminants. Next, the bottles are crushed and chopped into flakes. The small flakes are then fed into an extruder [5]. It should be pointed out that PET chips or flakes have to be dried before melt spinning; otherwise the molecular weight will be reduced from ½ to ⅓ of the initial molecular weight [6].
One of the most important processes performed on fibers is drawing. It can cause the perfection of the morphological structure of the fiber. It may create suitable conditions for orientation of amorphous and crystal with an increase in draw ratios and finally increasing the tensile properties of the filament. An increase in the draw ratio caused a decrease in the linear density, thread twist, and breaking extension. Moreover, the tenacity, elastic modulus, and tension at the yield point were increased during the drawing process. During the sewing process, it was found that tensile fatigue and heat loading cause changes in the threads’ mechanical properties, depending on the draw ratio. After the sewing process, the tenacity, elastic modulus, and tension at the yield point had decreased, while the breaking extension increased for those drawn at higher draw ratios and decreased for those threads drawn at lower draw ratios [7]. The filament fibers have been drawn in various ways, from single-stage to three-stage drawing. In single-stage drawn fibers, a high tensile strength is obtained, whereas a high initial modulus is obtained for fibers drawn in three-stage drawing. According to the results, an important finding is that the three-stage drawing process has the potential to take high-modulus fibers. The increased fraction of taut-tie molecules is detected in three-stage drawn fibers, which is one of the important factors causing the high modulus achieved in fibers drawn in hot multistage [8].
Our previous work has demonstrated the producing of filament yarns from used PET bottle and the production was successfully carried out. Poly ethylene terephthalate recycled (R-PET), Virgin fiber grade PET (FG-PET), and bottle grade PET (BG-PET) chips were spun on a high spinning speed machine)in 3000 and 3500m/ min (into filament yarns, and the influence of high speed spinning on the fiber properties was studied [9]. it should be mentioned that there are few studies on R-PET and BG-PET spinning properties and filament yarn production [10]. Recycled PET fibers are 20% compared cheaper to other fibers for the same physical characters. It is clear that cost advantage and being ecologically friendly of the fiber are strong motives for increasing recycled- PET fiber usage [11]. Given that the application of polyester used in bottles to produce fibers and in the production of filament yarn is a new and significant issue, it could be an interesting issue for environmental lovers. Therefore, many of the cases that are known for the new polyester filament yarn are unknown to the recycled filament yarn and require extensive research. The purpose of this work is to investigate of draw-ability of filament yarns and processing behavior of drawn yarn from recycled R-PET at the spinning and drawing machine and compare with FG-PET. The mechanism of fiber formation is analyzed using polarized and scanning Electron Microscopy (SEM), viscosity changes, X-ray diffraction, DSC, evaluation of tensile properties and shrinkage.
Experimental
Materials
Virgin PET chips with an IV of 0.6 and a density of 1.38g/ cm3, recycled PET material came from irregular beverage bottles having an IV of 0.75 and a density of 1.383g/cm3 and bottle grade PET chips having an IV of 0.82 and a density of 1.40g/cm3 were used as the starting materials in this study. The recycled PET was provided by Phoenix Technologies International, LLC corp., USA and bottle grade PET chips were obtained from Wellman corp., USA. The Kelline Extruder (USA) spinning machine with a 35-hole spinneret, a spinning temperature of 285˚C, and a winding speed of 1600m/min were used. As spun fiber was drawn in the twostage, the drawing process was performed with total draw ratios of 2.8, 3.0, 3.2, and 3.55, and a godet temperature of 80/100°C for the production of drawn filament yarns.
Characterization Methods
Intrinsic Viscosity (IV)
Intrinsic Viscosity (IV) of the PET was determined using 40/60 mixture of 1,1,2,2 tetra chloro ethan and phenol according to ASTM D-4603 [12]. Molecular weight of samples was calculated from the following two equations. η is intrinsic viscosity.
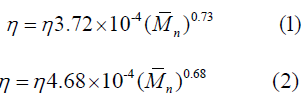
Where η is intrinsic viscosity
Density
The density was tested on small loops of the fiber sample with a density gradient column at 23°C; the column was filled according to the ASTM method D-1505 [13]. Crystallinity (Xd) was achieved from the following density-based equation:
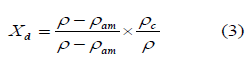
Where ρ is the measured fiber density from gradient column. ρam and ρc are the density of a completely amorphous and crystalline sample, respectively. For PET, ρc =1.455 g/cm3 and ρam=1.335 g/cm3.
Birefringence
An Interference Microscope (manufactured by Aus Jena in Germany) was used to measure the mean optical birefringence.
Scanning Electron Microscopy (SEM)
The morphology of the filament yarns coated with gold (SCD 005-Sputter coater) was studied under a scanning electron microscope. (SEM: type XL30, Phillips, Japan). Digimizer software was used to measure fiber diameters.
Wide Angle X-Ray Scattering (WAXS)
The WAXS analysis of the PET fiber samples were performed on a Siemens type F X-ray diffractometer equipped with a goniometer and a proportional count, Nickel-filtered Cu kα radiation with a wavelength of 1.542A° was used. The major peaks in the equatorial direction are:
(010) at 2θ=18°; (110) at 2θ = 23°; (100) at 2θ=26°
The angle σ that these planes make with the c axis was calculated from the Wilchinsky’s formula [14]. The crystallite orientation in terms of Herman’s orientation function ( c f ) can be formalized. Apparently crystal sizes were specified from the Scherrer equation. ( a f ) is Herman orientation function for the amorphous regions, which can be determined from the birefringence measurements by applying the superposition principle proposed by Stein and Norrise [15].
Differential Scanning Calorimetry (DSC)
The thermal analyses were performed on a Pyris Series- Diamond differential scanning calorimetry. In each run, 3 to 5mg of the fiber sample was used. DSC curves were obtained in the first heating, in the temperature range of 25°C-270°C and with a heating rate of 20°C/min. crystallinity of the sample were also obtained from the DSC method, which was calculated from the following equation:
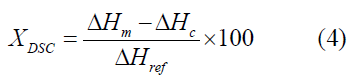
Where ΔHm notes to the measured melting enthalpy, ΔHc is the crystallization enthalpy induced during DSC test, and ΔHref mentioned to 100% crystalline polymer which, in the case of PET, equals to 140±20J/g [16].
Tensile test
The ultimate strength and elongation to rupture of individual filament samples were determined in an MTS Q-Test according to the ASTM method D-2256 [17]. The gauge length was 10 inches and the crosshead speed were 300mm/min. The tenacity, initially modulus and elongation to rupture are the average for 10 individual measurements.
Shrinkage
The value of Boil-off shrinkage of filament samples were obtained by measuring the length before ( 0 l )and after ( 0 l ) heating in boiling water. The percentage of shrinkage was obtained using the following equation:
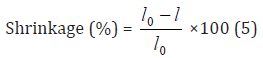
According to ASTM method D-2259 for testing yarn for shrinkage in boiling water, samples in a distilled or demineralized water bath, which is 40 times the mass of the wrapped skeins, bring to the bath to a continuously rolling boil and immerse the skeins for 30min [18].
Statistical evaluation
SPSS software was used in order to evaluate the statistical comparisons between the various groups. Differences were considered statistically significant at P-values below 5% (p<0.05).
Results and Discussion
Molecular Weight Characterization: There are four important variables when studying the molecular weight degradation of PET: melting temperature, environment of the melt, time in the melted state and drying conditions [19]. All the conditions are the same for spun yarns, so a sample was measured for each one. The IV study indicates that molecular weights decrease with the recovery process, and that molecular weights distribution became narrower as shown by values in Table 1. Various polyester compositions show wide conversion in their reaction to degradative agents depending on the nature of the units, and chemical and structural properties such as branching, size, shape, and crystallinity [3]. The molecular weight of the starting material and spun filament for the processing effects with intrinsic viscosity (IV) measurement were shown. The results are listed in Table1. The IV measurements confirmed that the molecular weights reduced with the recovery process [20] and that molecular weight distribution became narrower, as shown by values.

The results of the molecular weight for the filament yarns exhibited less thermally stable recycled material compared with fiber grade material. Degradation of R-PET molecular structure due to thermal, hydrolytic, and chemical agents is confirmed by the IV analysis. This could be attributed to the copolymer modification effect for blow-molding, as reported by Hergenrother [21]. Indeed, the presence of isophthalic acid in polymer (co polyester) may have caused an amorphous structure which led to the reduction of melting temperature and polymer crystallinity [22]. Besides, re-processed R-PET filament yarns have a lower molecular weight [20], a high amorphous content, and short molecular chains that are low orientation in molecular structure [23].
Density
Density and crystallinity calculated from the density of samples are shown in Table 2, and density and crystallinity calculated from the above density-based equation 3 are shown as a function of the draw ratio in Table 2. It was found that the higher draw ratio results in a higher density and crystallinity for all samples (P<0.05). This increase is larger in the case of FG samples, especially at higher draw ratios. This suggests that the ability to create crystallization in the drawing process for the recycled polymer is weaker than the new polymer. The presence of lateral branches in the recycled polymer chains may be due to the limited growth of the crystal in the stretching process. Higher degradation of the R-PET during the melt-spinning process can be seen in the density loss of the R-PET. This may create suitable conditions for a better order of the molecular structure resulting in higher crystallinity and density.

Birefringence
It was found that major changes in birefringence have a considerable effect on the molecular orientation. Optical birefringence of filament samples is shown in Figure 1. Increasing the draw-ratio improved optical birefringence of the FG-, R- and BG-PET yarns (P<0.05). It was found that at draw ratios above 3.2, the birefringence of R-PET samples almost remains unchanged. This may be due to the completion of the morphological structure.

Morphological properties
Figure 2 shows an SEM image of drawn R- and BG-PET filament yarn in different draw ratios. As can be seen, The SEM photography shows that R-PET filaments have a good uniformity. The fiber diameter of R-PET was decreased from 19.52±0.15 to 18.48±0.78μm by increasing the draw ratio, and the fiber diameter of BG-PET is 22.74± 6.84μm in a draw ratio of 3.0. The apparent crystal size perpendicular to the particular crystal plane can be derived from the half-width of the X-ray reflection. Table 3 shows the crystal size perpendicular to the plane (010) of the FG-, R- and BG-PET drawn samples. In all of the filaments the crystal size increases with an increase in the draw-ratio, except for at the draw ratio of 3.55 in FG-PET. The amorphous and crystal orientation increased with an increase in the draw ratio (P<0.05). Crystal orientation was calculated by the three equatorial reflections (010) and (100). Nanocrystalline orientation can be calculated from the crystalline orientation measured by X-ray diffraction and the birefringence, assuming a two-phase structural model [24].In figure 3, the equatorial X-ray diffraction traces are shown for the FG-, R- and BG-PET samples drawn with the applied draw ratios ranging from 2.8 to 3.55.
The traces quite evidently illustrate the influence of drawratio on the crystalline structure. Well resolved patterns were found for the yarns drawn at the higher draw-ratio. The yarns taken up at lower draw ratio, only give rise to broad unresolved traces. According to Scherrer’s formula, narrow peaks are related to crystals which are large in the direction perpendicular to the crystal plane involved. It can be concluded that the crystals lateral size in drawn yarns at high draw ratios are relatively well-developed. However, in the R-PET sample, the increase in draw ratio up to 3.2 improves the orientation of crystalline and non-crystalline regions, and after that it remains almost constant (Table 3). Such a trend was observed in the birefringence of FG and R-PET yarns. Frequent tears in recycled yarns in a draw ratio of 4 indicate that it is impossible to create more arrangement than that in the of draw ratio range of 3.2-3.5. The intensity of the profiles increases with the draw ratio and does not provide additional information. This phenomenon could be caused by an improved orientation and/or a decrease in the half-widths of peaks.


Differential scanning calorimetry (DSC)
DSC thermographs of raw materials and FG-, R- and BG-PET filament yarns as a functional of draw ratio are shown in Figure 4. This figure illustrates the effect of the draw-ratio on samples. Values shown in Table 4 illustrate that crystallinity of FG-; R- and BG-PET are nearly the same. Maximum crystallinity of FG-PET was found to be at the draw ratio of 3.55(P< 0.05). The higher level of crystallinity of R-PET was found to be at draw-ratio in 3.2. This may be due to a more complete FG-PET structure compared to R-PET. The copolymer modification in R- and BG-PET structure may display lower maximum draw ratio than FG-PET. However, values of crystallinity obtained from calorimetry are different from these values calculated from density, but both methods have the same trend. Increasing crystallinity using the DSC method, increasing the birefringence, and the results of X-ray diffraction (crystalline and non-crystalline orientation and apparent crystal size) all indicate that, up to a draw ratio of 3.2, these properties in the recycling case improve and then stop. A further increase in the draw ratio of up to 4 caused frequent tear of the filament yarn, while in the FG-PET sample this trend is not considered in the draw ratio of 3.2. The increase in the draw ratio is accompanied by continuity increase in tenacity, initial modulus, and structural properties.


Tensile properties
Table 5 illustrates the results of shrinkages and mechanical properties (tensile strength, elongation at break, and initial modulus) of the FG-, R- and BG-PET filament yarns at various draw ratios. There is an advanced increase in the tensile strengths and the initial modulus of filaments with an increase in the draw ratio in all samples (P< 0.05). The values of tenacity increase with increased draw ratios, since the tenacity is a function of (a) the degree of chain extension and (b) the degree of molecular orientation. The results of tenacity measurements confirmed the expectation, on the birefringence measurement [25] (see Figure 1). In addition, the tenacity of R- and BG-PET was shown to be slightly higher than the FG-PET sample. This may be attributed to the higher molecular weight of R- and BG-PET, which may facilitate better orientation during spinning, resulting in increased fiber strength. Moreover, high molecular weight PET shows higher tenacity than low molecular weight PET. The tensile test for postcyclic extension yarn samples have exhibited higher mechanical properties for 100% FG-PET yarn compared to blended yarn samples [23,26].

Initial modulus is usually highly relevant to the degree of crystallinity, crystal size crystallite orientation, and amorphous orientation, which have been presented by Samuels’ two-phase model [26-27]. Higher initial modulus of yarns produced at higher draw ratio is confirmed by the increase in their crystallinity values (P< 0.05) (see Table 2 & 4). Higher values of apparent crystal size of R-PET and BG-PET samples than of FG-PET samples are in accordance to their initial modulus (see Table 3). Moreover, as the draw ratio further increases, Std. [Dev] in R-PET falls. In addition, the R-PET sample shows the lowest Std. [Dev], and this suggests that R-PET can be more uniform by using higher draw ratios
Boil-off shrinkage properties
The boil-off shrinkage method is an evaluation of the stability of the fiber structure and the configuration. Figure 5 shows the results of boil-off shrinkage (%) of the FG-, R-, and BG-PET filament samples with various draw ratios during the spin-drawing process. For the FG- PET sample, crystallinity and the degree of orientation of the filament increase with draw-ratio. At higher draw-ratios, the improvement of crystallinity results in setting the filament and reducing the shrinkage. However, in the R- ,and BG-PET samples, during the drawing process, only stretching and orientation of the filament take place and the degree of orientation of the samples increases with increased draw
Conclusion
Spinning and draw machine were performed separately in this study. The drawing process was used with total draw ratios of 2.8, 3.0, 3.2, and 3.55 for the R-PET and BG-PET, while the FG-PET was used as control. Higher degradation of the R-PET during the meltspinning and drawing process can be seen in the density loss of the R-PET. For the FG- PET sample, crystallinity and the degree of orientation of the filament increase with the draw-ratios. At higher draw-ratios, the improvement of crystallinity results in setting the filament and reducing the shrinkage. Increasing crystallinity using the DSC method, increasing the birefringence, and the results of X-ray diffraction (crystalline and non-crystalline orientation and apparent crystal size) all indicate that, up to a draw ratio of 3.2, these properties in the recycling case improve and then stop. A further increase in the draw ratio of up to 4 caused frequent tear of the filament yarn, while in the FG-PET sample this trend is not considered in the draw ratio of 3.2. The increase in the draw ratio is accompanied by continuity increase in tenacity, initial modulus, and structural properties. Therefore, the range of effective draw ratio in the filament yarns produced by the recycled polymer is lower than the new polymer.
Acknowledgment
The authors would like to thank Phoenix Technologies International, LLC corp., USA, who provided the recycled PET materials used in this study.
References
- Gurodatt K, De P, Rakshit AK, Bardhan MK (2003) Spinning Fibers From Poly (ethylene Terephthalate) Bottle-grade Waste. J Appl Polym Sci 90(13): 3536-3545.
- Gallagher FG (2003) Controlled Degradation of polyesters. In: John Schiers, Timothy E Long Modern polyesters: chemistry and technology of polyesters and copolyester. J wiley, pp. 591-608.
- Venkatachalam S, Nayak SGJ, Labde V, Gharal PR, Rao K, et al. (2012) Degradation and Recyclability of Poly (Ethylene Terephthalate). InTech Publishers, pp. 75-98.
- (2017) Smithers Pira Market Intelligence. The Future of Global PET Packaging to 2017.
- Shah R (2013) Advanced Filtration Technology Enables the Production High-Quality Recycled PET Fibers for the Textile.
- Jabarin SA, Lofgren EA (1984) Thermal stability of Polyethylene Terephthalate. Poly Eng and Sci 24(13): 1056-1063.
- Rudolf A, Gersak J (2012) The effect of drawing on PET filament sewing thread performance properties. Textile Research Journal 82(2): 148-160.
- Haji A, Rahbar RS (2012) Structure Evolution and Mechanical Behavior of Poly (Ethylene Terephthalate) Fibers Drawn at Different Number of Drawing Stages. Chemical Industry & Chemical Engineering 18(2): 233-243.
- Abbasi M, Mojtahedi MRM, Kotek R (2012) ISPST. Amirkabir University of Technology, Iran.
- Zander NE, Gillan M, Daniel Sweetser (2017) Composite Fibers from Recycled Plastics Using Melt Centrifugal Spinning. Materials 10(9): E1044.
- Sarioglu E (2017) Ecological Approaches in Textile Sector: The Effect of r-PET Blend Ratio on Ring Spun Yarn Tenacity. PEN 5 (2): 176-180.
- ASTM D-4603, Standard Test Method for Determining Inherent Viscosity of Poly (Ethylene Terephthalate) (PET) by Glass Capillary Viscometer.
- ASTM D-1505, Standard Test Method for Density of Plastics by the Density- Gradient Technique.
- Wilchinsky ZW (1960) Measurement of orientation in polypropylene film. J Appl Polym Sci 31(11): 1969-1972.
- Stein RS, Norris FH (1956) The x-ray diffraction, birefringence, and infrared dichroism of stretched polyethylene. J Polym Sci 21(99): 381-396.
- Elias, HG (1977) Macromolecules. 1: 3-36.
- ASTM D-2256 (2015) Standard Test Method for Tensile Properties of Yarns by the Single- Strand Method.
- ASTM D-2259 (2016) Standard Test Method for Shrinkage of Yarns.
- Telli A, Ozdil N (2013) Properties of the yarns produced from r-PET fibers and their blends. Textile and Apparel 23: 3-10.
- Elamri A, Abid K, Harzallah O, Lallam A (2015) Characterization of Recycled/Virgin PET Polymers and their Composites. American Journal of Nano Research and Application 3(4-1): 11-16.
- Hergenrother WL (1974) Influence of Copolymeric Poly (diethylene Glycol) Terephthalate on the Thermal Stability of Poly (ethylene Terephthalate) J Polym Sci Pol Chem 12(4): 875-883.
- Ubach J, Antxon Martínez de Ilarduya, Quintana R, Alla A, Rudé E, et al. (2010) Poly(ethylene terephthalate-co-isophthalate) copolyesters obtained from ethylene terephthalate and isophthalate oligomers. J Appl Polym Sci 115(3): 1823-1830.
- Barman NK, Bhattacharya SS, Aadhar Mandot (2015) Mechanical Properties of Melt-Spun Monofilaments Produced from Virgin and Recycled Poly (ethylene Terephthalate) Blends. IJRSR 6(6): 4517-4525.
- Pal SK, Gandhi RS (1995) Influence of Texturing Parameters on Structural Properties of Microfiber Polyester Yarn. CFI 45: 418-420.
- Suh J, Spruiell JE, Schwartz SA (2003) Melt spinning and drawing of 2-methyl-1, 3-propanediol-substituted poly (ethylene terephthalate). J Appl Polym Sci 88(11): 2598-2606.
- Lim JL, Leim SY (1999) Properties of High-Speed Spun High Molecular weight Poly (ethylene terephthalate) Filaments. J Appl Polym Sci 71(8): 1283-1291.
- Samuels RJ (1974) Structured Polymer Properties. John Willy, New York.


