Kalman Filter Application in a Subsidence Back-Analysis along the Tunnels of Line 1 of Quito (Ecuador)
Rubén Moreno1*, Julio Rodríguez1, Cosimo Iasiello2 and Angel Silvestre3
1Department of Underground at Ayesa, Madrid, Spain
2Department of Underground at Systra-Sws, Trento, Italy
3Department of tunneling at Mott MacDonald, Madrid, Spain
Submission: December 22, 2021; Published: January 12, 2022
*Corresponding Author: Rubén Moreno, Department of Underground at Ayesa, Madrid, Spain
How to cite this article:Moreno M, Rodriguez J, Iasiello C, Silvestre A. Kalman Filter Application in a Subsidence Back-Analysis along the Tunnels of Line 1 of Quito (Ecuador).Civil Eng Res J. 2022; 12(5): 555846. DOI 10.19080/CERJ.2022.12.555846
Abstract
The aim of this paper is to present the application of the Kalman filter to estimate the parameters that play a fundamental role in a very common underground feature as the subsidence analysis. The results are compared with those coming from the monitoring data of line 1 of Quito underground. The methodology employed is based on the application of the Unscented Kalman Filter (UKF) applied to non-linear finite element analysis (NLFEA) carried out in Plaxis 2D. The comparison of the results shows a good agreement in terms of ground movements estimation and maximum settlements and makes this approach very attractive and relatively simple to adjust to other non-linear problems within tunnelling engineering.
Keywords: Back-analysis; Unscented kalman filter; EPB Tunnel settlements
Introduction
In geotechnical engineering, the uncertainty of the parameters and models used in the calculation of any design has generally been addressed based on the application of different safety factors, relying on the experience of the engineers in charge of the design or through the classic observational method [1]. However, the large and complex works to be undertaken nowadays and the great advances produced in computational analysis make this approach to the problem of uncertainty at least questionable. The studies based on back-analysis present great advantages over other types of approaches as the engineers can compare the real data with the results of their analysis; particularly for tunnelling, this approach is very useful to understand the behaviour of the ground based on a monitoring system, constituting a kind of real-scale tests. In recent times, the general tendency to manage uncertainty in geotechnics has focused on probabilistic analysis, which, together with computational advances, have led to the application of the so-called probabilistic estimators, filters or algorithms for estimating different geotechnical parameters (see for instance [2-7]. The aim of this paper is to employ the Kalman filter [8] to study which parameters play a fundamental role in the subsidence analysis based on monitoring data. To do that, the Kalman Filter is applied in the non-linear finite element analysis (NLFEA) of the ground movements around the tunnel excavation. The innovative approach of this paper is that the Kalman filer is not popular in geotechnical analysis as it is mostly employed for linear models. However, it is known that the behaviour of the ground is far from linear [9], thus this approach requires the use of some of the Kalman filter variants for highly non-linear systems. In this paper, the so-called Unscented Kalman Filter (UKF) [10] has been applied, which allows working with non-linear ground models through sigma-points, which are discrete values that are obtained from probability density functions using the Unscented transform [11]. All this estimating system has been coupled to the non-linear function model in PLAXIS [12,13] using Python language, in such a way that the successive iterations or filtering were executed automatically until convergence was reached.
Description of the Project
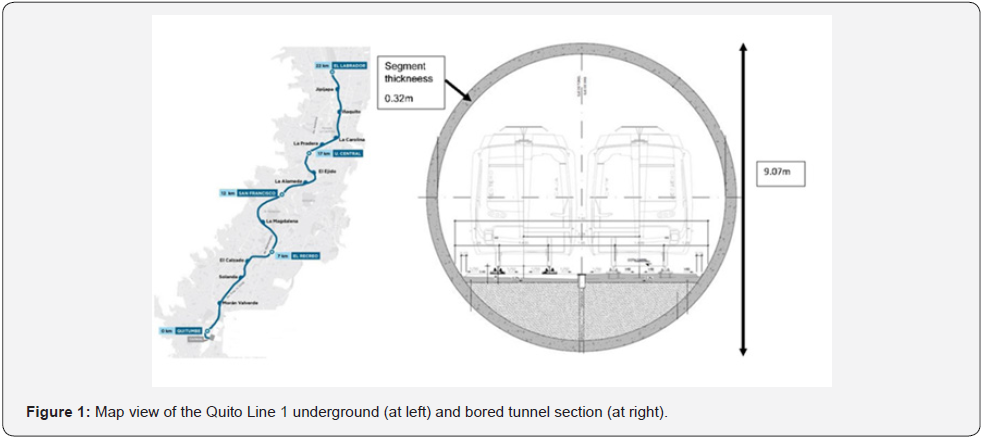
Line 1 of the Quito Metro runs from North to South of the city (Figure 1 left) and includes 15 underground stations, 13 shafts, and 18 km of tunnel (16 km with Ø9.45 EPB external diameter tunnel and 2 km of NATM tunnel). The excavation diameter of the EPB was 9.07 m (Figure 1 right) and the segment thickness was 0.32 m. The Quito Basin is located within the Interandian Valley and it is formed by volcanic deposits from the medium Pleistocene period. From bottom to top, the main formations are: (a) Machángara Formation, represented in the north sector of the city by the Quito Member, which includes the volcanic-sedimentary Guamaní Unit (Py), composed by blocks and ash flows, and the fluvial-lacustrine El Pintado Unit (CH, B, A, a), where some peat layers are interbedded (Tu) into a mixture of sands, green clays, breccias and sandstones; (b) overlaying Machángara Formation, the Cangahua Formation is composed by weathered yellow to brown tuffs with interbedded ashes, pumice beds, paleosols,mudflows and alluvial channel deposits, where two units have been differentiated, the silty sand Cangahua unit (Ca), and the sandy gravel Cangahua with Lahars Unit (Cag); (c) on top of the series the Carolina fluvial-lacustrine deposits (Fl-Ca) are found, which are composed by silts, clays and medium to coarse sands with interbedded ashes and pumice deposits; (d) finally, recent heterogeneous made ground deposits (R) are covering all the area of the project. The geotechnical parameters, deduced from an extensive laboratory investigation, employed during the detail design stage are collected in (Table 1) and are those employed in this paper as initial parameters.

Methodology
The Kalman Filter is a mathematical tool for finding the best estimate for the state of a system in a discrete time process that is assumed as a linear stochastic differential equation [8]. Following the approach of [4] we could consider the following discrete nonlinear time system:

where is the unknown state of the system and
  corresponds to the output data. In this paper
  are:
are:
c: cohesion of the soil
φ: friction angle of the soil
Eur: Young Modulus under load-reload
CL: contraction line usually adopted to simulate the volume loss
γ 0.7 : reference shear strain
Whereas  are the observed ground movements
In order to provide an adequate initial model, all previous
information on the input parameters  must be assessed. This
previous information will come with an associated error of
modelling
  that can be represented probabilistically by means
of a multivariable Gaussian probability density function with zero
mean and covariance matrix Qk. In this paper, the implicit error
in the input parameters (soil parameters) is represented by the
initial standard deviation of each parameter as per [6]. On the
contrary, the error related to monitoring measures (vk) is usually
given by the manufacturer of the measurement equipment, so it
also turns out to be an independent and Gaussian random variable,
with zero mean and covariance matrix Rk. The nonlinear functions
f and h represent the dynamic process and the measurement
model, respectively. The estimation of the state consists in
elaborating an outlook of
  employing
  for each time k. For this
reason, the interest of the user should be focused on obtaining
the probability distribution function (PDF) of
  conditioned to
 or, in other words, the probability of reproducing the observed
measurements with a particular set of input parameters. The
probability of a parameter set given the observations is:

The application of the Bayes Theorem to the observations leads to the updated equation of the parameters set, which is:

Where:
a)  x is the probability of a certain estimation for the
set of geotechnical parameters given the observed measures. This
term is also known as the a-posteriori PDF
b)  is the probability of computing the observed
measures through the NLFEA given a certain set of geotechnical
parameters.
c)  is the probability of a certain estimation for
the set of geotechnical parameters given the previous observed
measures. This term is also known as a-priori probability.
d)  in equation (5) is the normalized probability
or so-called scale factor so the
  could be between 0 and 1.
In this way expressions (4) and (5) represent the fundamental
estimation of the Bayesian system of the equations (2) and (3)
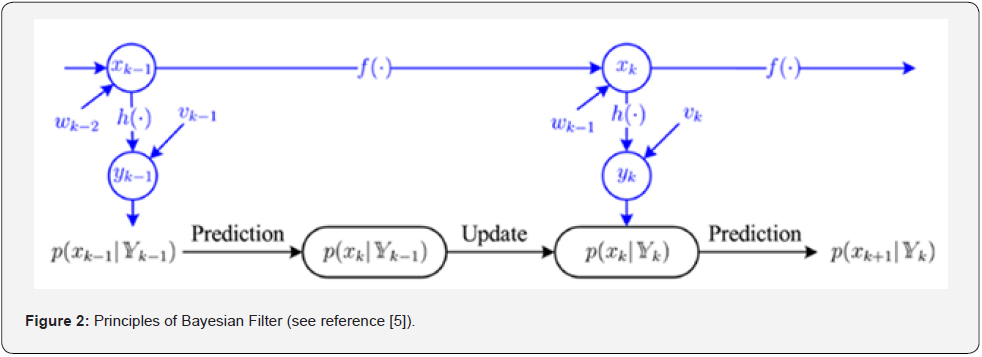
depending on time k. The approach is depicted schematically in
(Figure 2). However, equations (4) and (5) cannot be used in a
simple way to find the PDF of a random vector belonging to a very
nonlinear system, since a computationally-demanding random
sample simulation procedure must be adopted. This issue can be
addressed by using the first two statistical moments (mean and
covariance) of a Gaussian probability density function assumed
for the parameter vector  . This procedure then aims for
finding the PDF of the parameter’s estimation. Considering that
the geotechnical parameters could be efficiently approximated
to Gaussian distribution, as stated by [7], the search problem
turns easier to solve by implementing the approach previously
mentioned, with the unknown parameter standing for
  at time
k. The new equations (4) and (5) can be expressed in terms of the
Kalman filter as the predictions:

and the updated formulation can be expressed as:
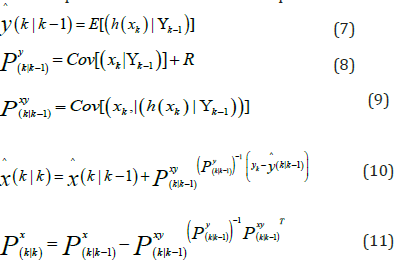
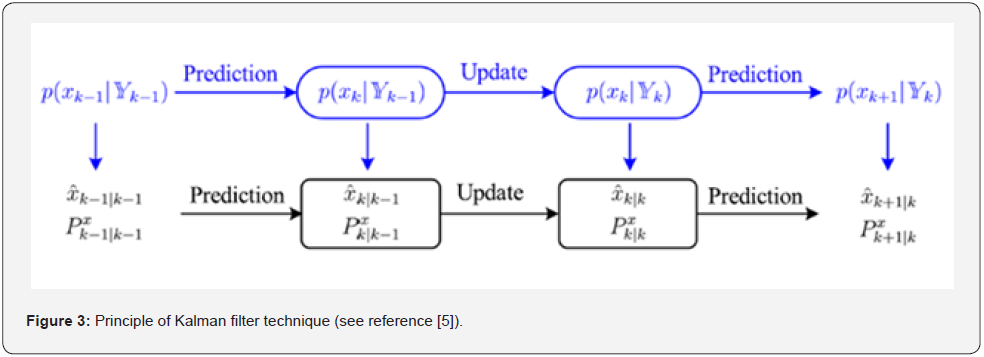
As shown in (Figure 3), the Kalman filter a repetitive
prediction-update procedure to obtain the mean and covariance
of  from measurements. Equations (8), (9), (10), (11) and (12)
show how this implementation depends on the determination of
the mean and covariance of the random state vector through the
nonlinear functions f (·) and h (·). In geotechnical engineering,
the fundamental equation of an observation model in can be
expressed, (see reference [14]), as:

where:
d is the output of the model, normally, function of h which corresponds to a NLFEA or another nonlinear equation
x is the actual state of the model
m contains the model parameters (for example, Young modulus, friction angle, cohesion, etc.)
f represents the external loads and the boundary conditions
However, in the case of nonlinear systems, as those commonly encountered in Geotechnical Engineering, the problem is more complicated, and has attracted a lot of research in recent years. Thus, different families of Kalman Filters have been developed for non-linear systems, with three clear outstanding algorithms: EKF (Extended Kalman Filter), UKF (Unscented Kalman Filter) and EnKF (Ensemble Kalman Filter). In this work, the so-called Unscented Kalman Filter (UKF) or, for a better understanding, the Kalman Filter with the application of the Uhlmann transform, has been used. This technique is based on the so-called Unscented transform (UT), which uses deterministic points to trace the mean and covariance of a random variable transformed to a nonlinear system (see for instance ref [15]). The basic idea of the method is to represent the probability distribution of each random variable by means of a set of points (sigma points) deterministically chosen in such a way that the mean and covariance are represented. Then, it is possible to propagate these sigma points through the nonlinear function, obtaining a new set of points that are then used to obtain the mean and covariance of the transformed variable utilizing a weighting procedure.
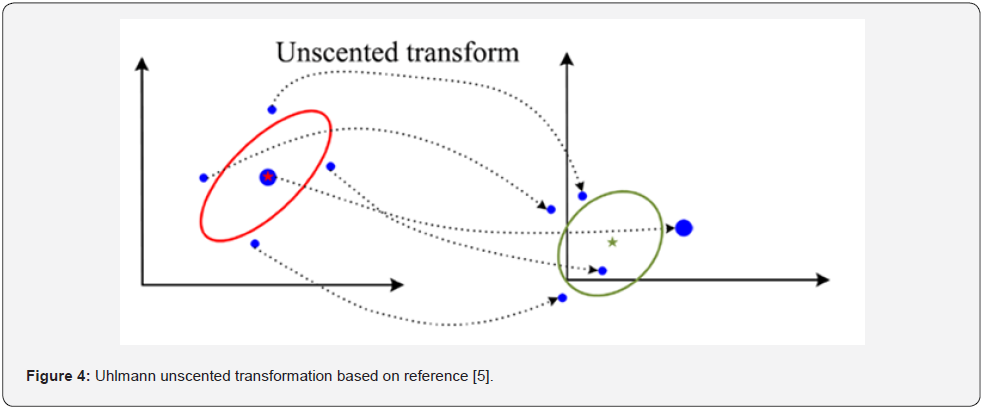
The procedure is to generate a first set of points considering
the initial mean and covariance (red ellipse in (Figure 4)) and,
subsequently this system is projected through a nonlinear function
to generate a new set of sigma points which are used to calculate
the new mean (the “star” point at the right of Figure 4) and its
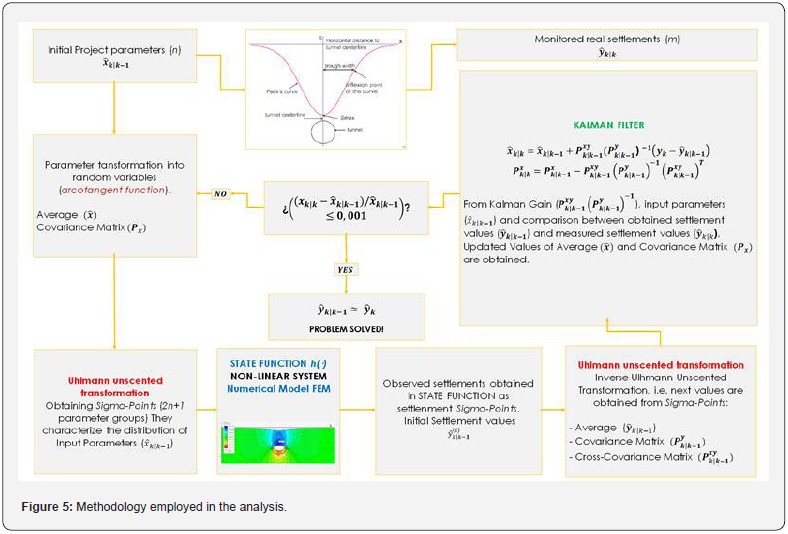
covariance (ellipse in Figure 4). In order to develop the UKF, it is necessary to apply the Uhlmann transform, both in the prediction
and update processes, which involves state transformations of
the nonlinear functions f and h, respectively. (Figure 5) shows the
methodology employed in this paper to estimate the  from the
  depending on time k.
Ground Movements: Empirical vs Monitored Data
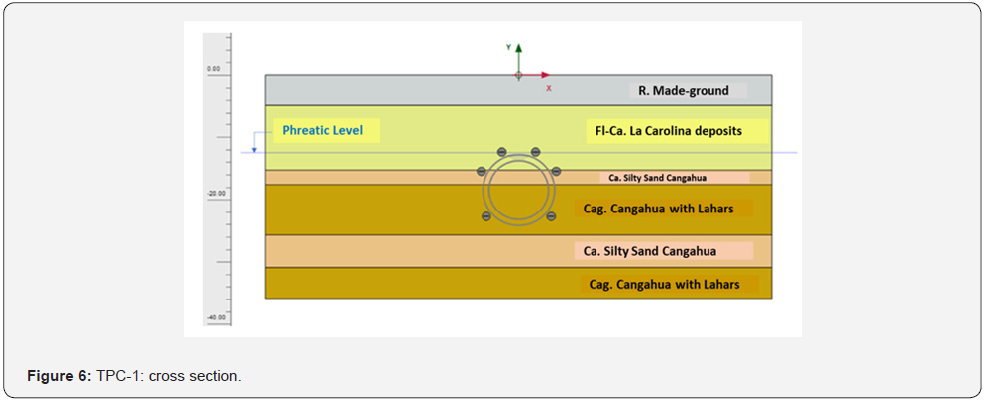
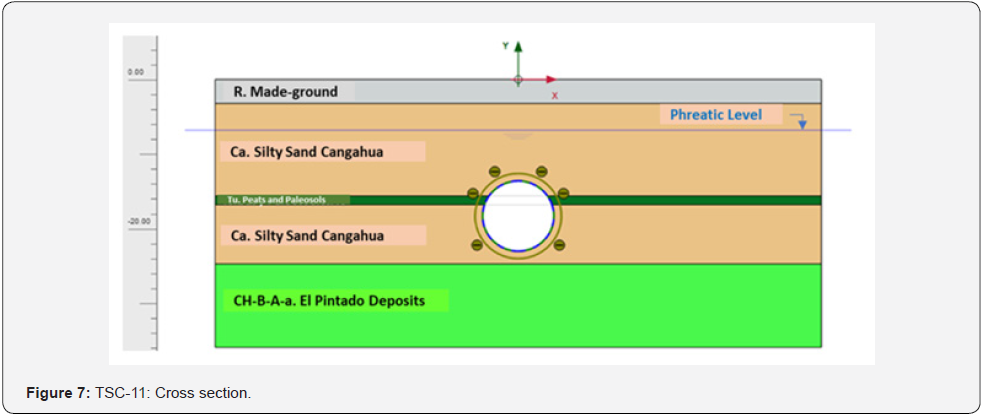
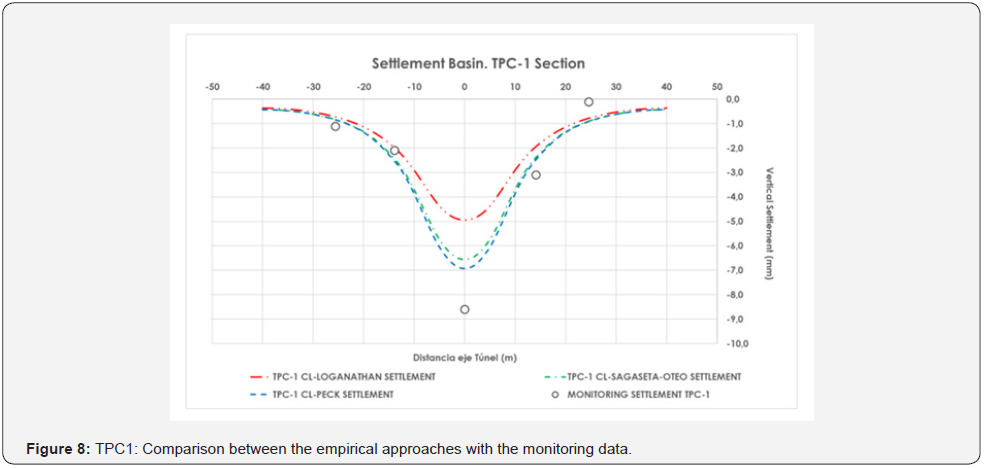
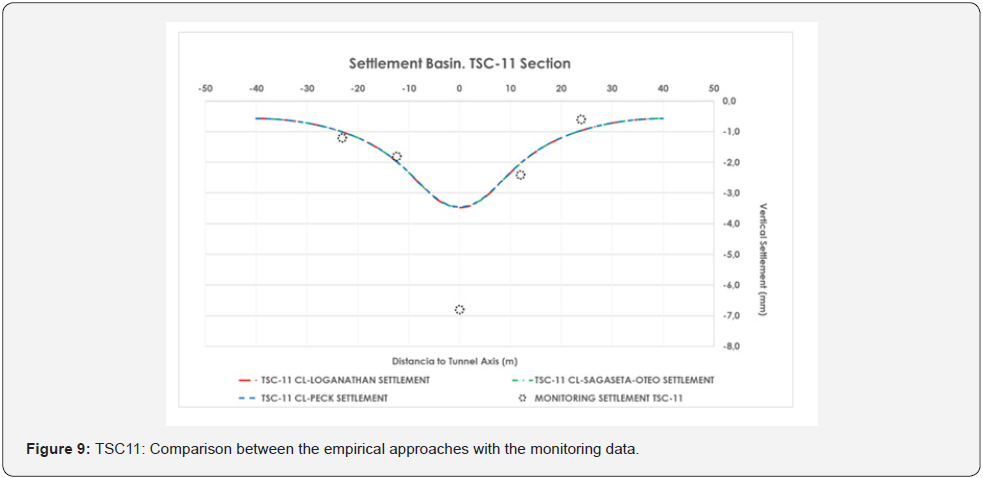
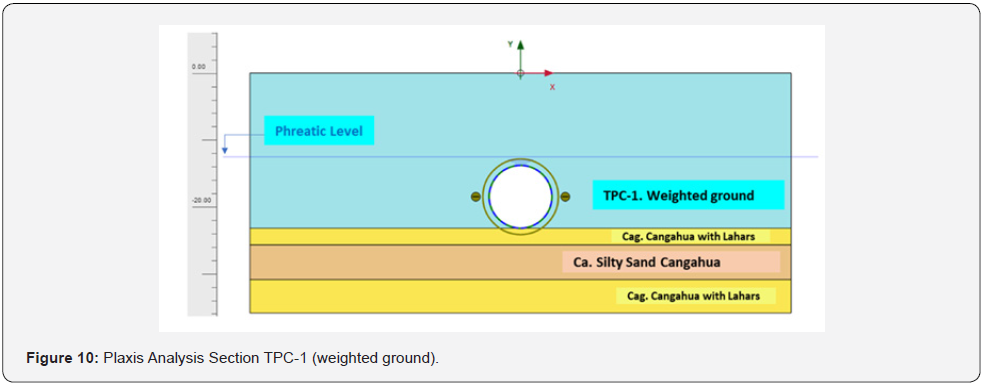
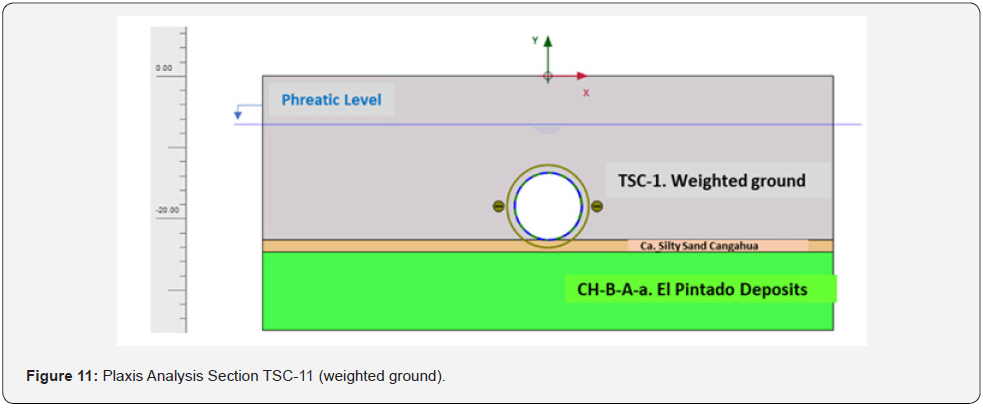
As already mentioned above, Line 1 of Quito runs under different typologies of buildings in a very irregular volcanic deposit. For this reason, the estimation of ground movements was carried out carefully considering not only the classical approach (as per [15-17]), but also considering the influence of the average face pressure (see for instance [18-20]) or finally using the weighted soil parameters approach (see [21,22]) employed in Madrid Underground Projects. In this paper, two main sections have been employed as they are considered the most representative regarding ground movements. Section TPC-1 was identified as partially bored in soft clays and the water level was expected at tunnel crown. The cover from crown is approximately 18 m and the expected Smax (defined as the maximum vertical displacement) was 30mm (Figure 6). Section TSC-11 was expected to be excavated in silty sand formation with a shallow water table. In this case the cover was approximately 13m and the expected Smax was 6.5mm. (Figure 7) Cross section (Table 2) collects the parameters of tunnel depth (H0), earth pressure (P), maximum settlement (Smax), inflexion point (i), specific volume (VS), volume loss (VL) and section loss (V0) for the aforementioned sections obtained from NFDM (nonlinear finite difference model) using FLAC3D performed during the construction project of the tunnel. In order to compare different empirical approaches to the analysis results, (Figure 8) and (Figure 9) collect the comparison between these empirical approaches and the monitored data where it is possible to see the agreement, for both sections, in terms of average displacements. Monitored data showed values of maximum displacements quite higher than the theoretical ones. Monitored data for ground movements were carried out during three weeks before the passage of the EPB until the distance between the EPB and the surveyed chainage was about 240 m. The data were measured with remoted controlled precision levelling for vertical displacements as already used in Madrid Underground ([21]
NLFEA Analysis
As already stated in the section 3, the NLFEA was carried out
employing Plaxis 2D (see [12,13]) where the intrinsic geotechnical
parameters of the ground (c, φ, Eur, γ0,7, Gur, etc.) were
differentiated from the parameters related with the construction
process as the contraction line (CL), section loss (V0) or volume
loss (VL). If we refer to (Table 1), and to Figure 6 and Figure 7, for
ground movements it is possible to use the weighted parameters
as per [21,22]. The cross sections collected in Figure 6 and Figure
7 are modified as per (Figures (10 and 11)). This technique
speeded up the simulation process described in Figure 5. (Table
3) shows the weighted geotechnical parameters employed in
the NLFEA. The estimation of these parameters constitutes the
fundamental objective of the back-analysis carried out and,
therefore, of this paper. Within the probabilistic filtering process,
it is necessary to include in the system some initial parameters
that constitute the first probabilistic distribution from which to
extract the sigma-points to introduce in the nonlinear calculation
function represented by the numerical model of PLAXIS 2D
elements. These probabilistic distributions for parameters are
transformed to sigma points through the unscented transform,
then the results of their propagation through the numerical
model are used to estimate the set of parameters that results
in a better approximation of the observations. This procedure
is undertaken in an iterative manner, in which the updated
probability distributions of the parameters are used again as input
for a more refined estimation. The successive iterations allow the convergence of the observable data in a fast and effective way and,
therefore, the estimation of the parameters that will maximize
the probability of achieving the observations in the numerical
model [23-32]. The parameters initially entered into the system
to carry out the first unscented transform are entered as mean
values and their corresponding covariance matrix. However, it
is necessary to establish maximum and minimum values to limit
the number of calculations or iterations and avoid, whenever
possible, the generation of anomalous or local minimum results.
Choi et al [22] used a strategy called the Extended and Restricted
Kalman Filter (CEKF). Through this technique, the Kalman filter
is used to estimate an auxiliary variable that is linked, through
a transformation, to the geotechnical variable to be estimated.
This transformation contains implicit limits that are imposed
on the variable to be estimated. The authors used a logarithmic
transformation to avoid that the values of the estimated
properties were negative. In this paper, a new transformation has
been used to limit the possible values of the estimated variables.
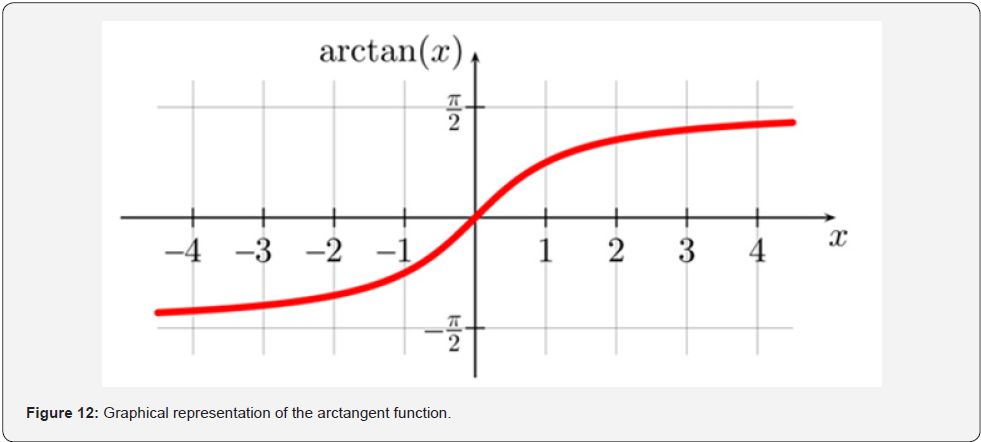
This transformation is based on the arc-tangent function as
shown in (Figure 12). The arc-tangent function is continuous and
differentiable throughout the real line, and its values are delimited
in a range of width π centred at zero. The estimated variable is the filter “α ” defined as: 


Thus, it is assumed that the values of the geotechnical
parameters are comprised between a lower limit and an upper
limit, called  , respectively, which are estimated
based on field data, on the available technical literature or on the
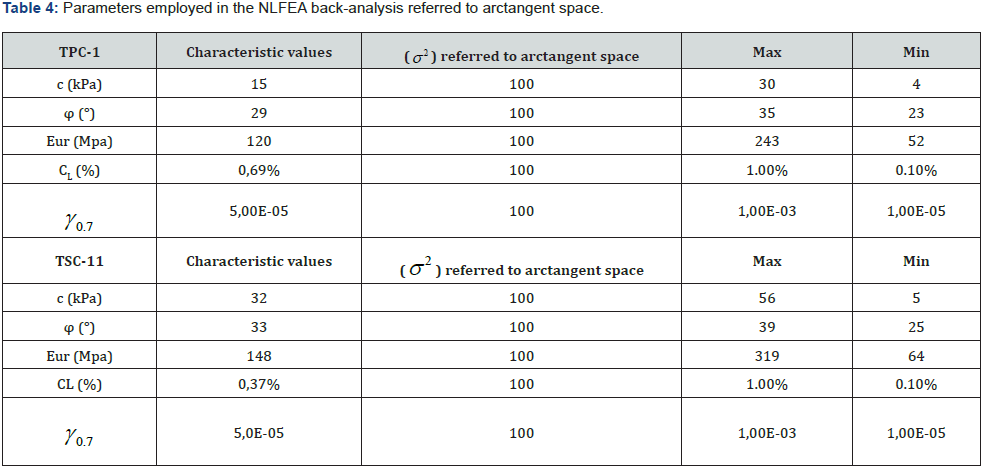
experience on previous works. These data are shown in (Table 4).
(Table 4) Parameters employed in the NLFEA back-analysis referred to arctangent space.
Results
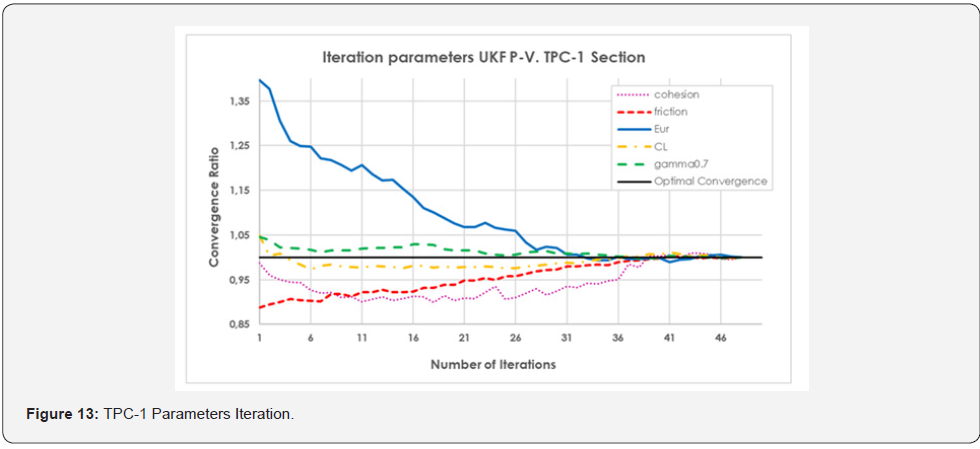
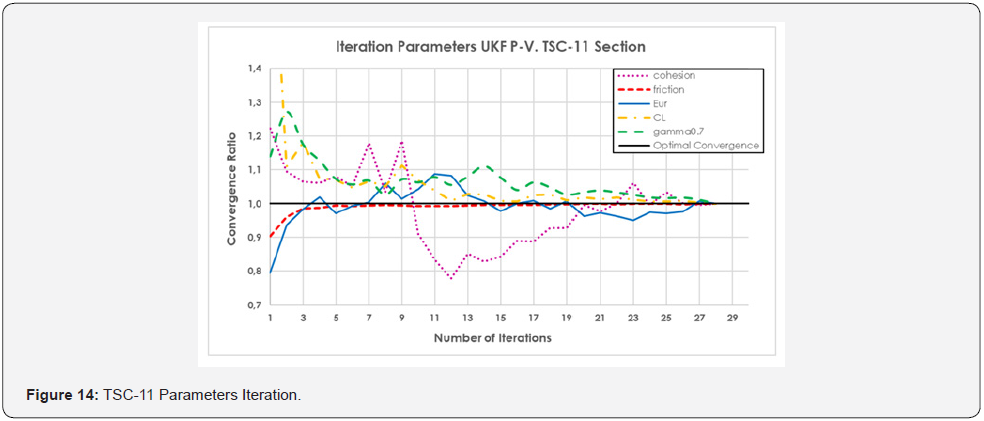
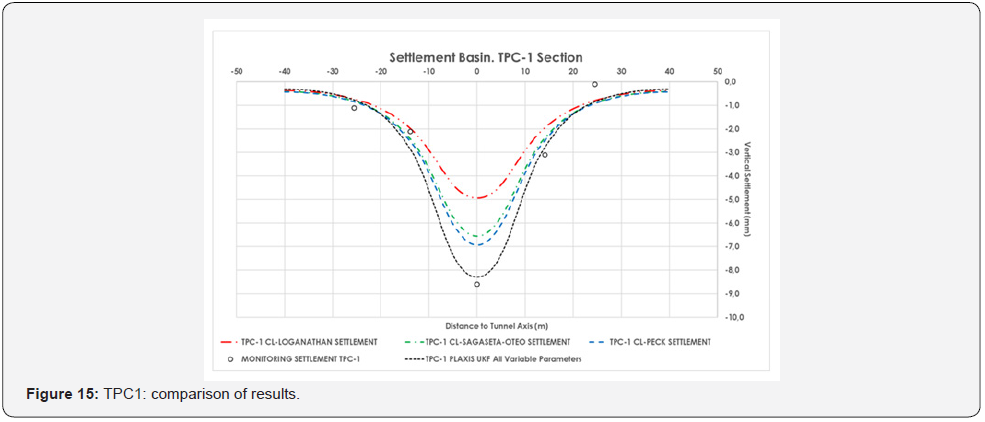
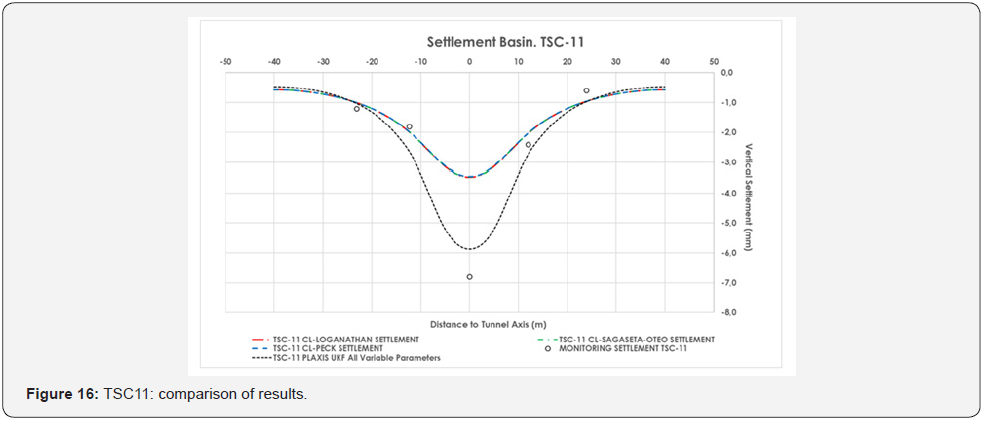
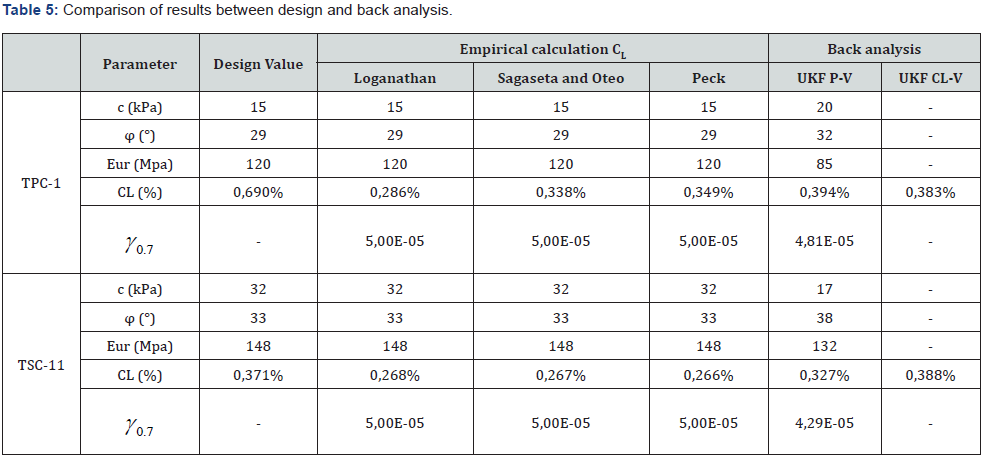
The results of the analysis based on the methodology of (Figure 5) are collected in (Table 5). It is important to underline how important is the value of contraction line in the back analysis (0.3- 0.4%) to best fit the observed data with the designed ones (0.7%). The geotechnical parameter that plays a more fundamental role seems to be the Young modulus. The number of iterations to reach the convergence of the parameters has been forty-eight. The following table shows the convergence of the parameters to the more probable value. Comparatively, the input parameters considered before the initial filtering are included, as well as the calculation parameters considered in the project (Figures (13 and 14)). For its part, the ground movements calculated in PLAXIS from the weighted properties obtained in the filtering are shown (Figures (15 and 16)), where a comparison with field data also is shown. As it can be observed, the adjustment reached in the estimation is quite optimal, considering the asymmetry of the values of ground movements measured and the impossibility that the numerical model generates an asymmetric settlement curve since the model is symmetric. As a complementary result, (Table 6) shows different values of Volume Loss (VL) and Section Loss (V0) (equal to Contraction Line, CL) obtained from empirical calculation methods and from UKF back analysis. It is possible to see that Volume Loss derived from UKF is higher than the empirical formulations and this could be explained considering the assumptions of the empirical formulations. (Table 6). Values of Volume Loss (VL) and Section Loss V0 obtained from empirical calculation methods and from UKF back analysis.

Conclusion
From the above considerations, the following conclusions can be drawn:
a. From the PLAXIS 2D calculations carried out for the two sections, the volume loss values obtained from empirical approaches are relatively in agreement with the measured data although the maximum values are quite far from each other. For this reason, it is important to underline that these formulations are very useful during the design and constitute an important aspect to take into account the possible damage to buildings, but the empirical approach, although generally accepted by tunnel engineers, must be supported by a statistical approach based on the variability of the parameters and/or by numerical analysis.
b. From the back-analysis carried out through the application of probabilistic estimators (Unscented Kalman Filter, UKF) it is concluded that this technique constitutes a powerful and versatile calculation tool that, quickly and accurately, allows to obtain very satisfactory adjustments. During the iteration process of the UKF, it has been possible to observe the special relevance of the maximum and minimum limits of each parameter to be estimated and entered in the filter. Adjusting these limits allows the filter not only to reach a convergence more quickly, but also to avoid falling into unrealistic parameter values. The approach based on the arctangent resulted also very attractive to estimate the filter as it gives a finite value of variability of the parameters leading to a more stable analysis.
c. From the analysis of the results, it can be concluded that, within the analysis using PLAXIS 2D, the contraction line (CL) parameter plays a fundamental role in the geometrical extent of the subsidence curve measured at surface. This particular parameter is not so easy to calculate because it depends on the typology of the TBM, the annular gap material and filling procedure and other variables. A correct implementation of this parameter in the analysis is key to reach the observed values on site.
From the analysis performed, it can be concluded that the Young modulus plays an important role in defining the width of the Gaussian curve. The results of the analysis show that this value was overestimated during design. The other geotechnical parameters have little influence on the definition of the ground displacement curve.
References
- Akutagawa S (1991) The back-analysis program system for geomechanics applications. PhD Thesis, Univ. of Queensland.
- Arai K, Ohta H, Miyata M (1991) Comparison of static and statistical methods for back-analysis of elastic consolidation problems. Computer Methods and Advances in Geomechanics/ Cairns Beer G, Booker JR, Carter JP (eds.) pp: 949-954.
- Cheng Xiang Yang, Yong Hong Wu, Tung Hon, Xia-Ting Feng (2011) Application of extended Kalman filter to back analysis of the natural stress state accounting for measuring uncertainties. Int J Numer Anal Met. Geomech 35:694-712.
- Diez Rubio, F (2010) New Modelo Madrid for estimating Asientos Producidos in Tineles with Tuneladoras EPB de Gran Diameter. Tesis Doctoral. ETSI Caminos, Canales and Puertos. Universidad Politicnica de Madrid, Spain.
- Fang HZ, Tian N, Wang Y, Zhou M, y Haile MA (2018) Nonlinear Bayesian Estimation: From Kalman Filtering to a Broader Horizon. Journal of Automatica Sinica 5(2): 401-417.
- Gens A, Ledesma A, Alonso EE (1988) Back analysis using prior information-Application to the staged excavation of a cavern in rock. Proc 6th Conf. on Numerical Methods in Geomechanics, Innsbruck, pp.2009-2016.
- Gioda G (1985) Some remarks on back analysis and characterization problems. Proceedings, 5th International Conference on Numerical Methods in Geomechanics. Nagoya Japan pp: 47-61.
- Hommels A, Molenkamp F (2006) Inverse analysis of an embankment using the Ensemble Kalman filter including heterogeneity of the soft soil. Proc of Sixth Eur Conference on Numerical Methods in Geotechnical Engineering, Graz (Austria).
- Alpan I (1970) The geotechnical properties of soils. Earth-Science Reviews 6(1): 5-49.
- Ceravolo R, De Stefano A, Matta E, Quattrone A, Zanotti Fragonara L, et al. (2013) Unscented Kalman Filter for the identification of passive control devices. Research and Applications in Structural Engineerig, Mechanics and Computation, Taylor & Francis Group, London, UK.
- Loganathan N, Poulos HG (1998) Analytical prediction for tunneling-induced ground movements in clays. Journal of Geotechnical & Geoenvironmental Engineering 124(9): 846.
- Brinkgreve RBK et al. (2007) PLAXIS, 2D Manual. Delft: Delft University of Technology, Netherlands.
- Brinkgreve RBK et al. (2016) PLAXIS, Material Models Manual”. Delft: Delft University of Technology, Netherlands.
- Menegaz HMT, JY Ishihara, GA Borges, AN Vargas (2015) A systematization of the unscented Kalman filter theory. IEEE Transactions on automatic control 60(10): 2583-2598.
- Julier SJ, Uhlmann JK (2004) Unscented filtering and non-linear estimation. In Proceedings of the IEEE, 92(3).
- Loganathan N (2011) An Innovative Method for Assessing Tunnelling-Induced Risks to Adjacent Structures. Parsons Brinckerhoff Inc.
- Obrzud RF (2010) On the use of the Hardening Soil Small Strain model in geotechnical practice. Numerics in Geotechnics and Structures. Zimmermann Th, Truty A, Podles K (Eds.). Elmepress International.
- Peck RB (1969) Deep excavation and tunneling in soft ground. Proceedings, 7th International Conference on Soil Mechanics and Foundation Engineering, Mexico City.
- Sagaseta, Cy, Oteo C (1974a) Analyze the subsidiary origin of the excavation tools. 1 National Symposium of Tineles. Madrid, Spain.
- Sagaseta Cy, Oteo C (1974b) Influence of the plasticization of the ground around a tunnel on the surface settlements. 1st National Tunnel Symposium. Madrid, Spain.
- Del Amo A (2012) Ground Movements due to Tunneling-Volume Loss Estimation. Memorandum. Crenshaw/Lax Transit Corridor Project. Intecsa-Inarsa.
- Choi JW, Rongzong W, Juan Pestana M, John H, et al. (2010) New Layer-Moduli Back-Calculation Method Based on the Constrained Extended Kalman Filter. Journal of Transportation Engineering.
- Brinkgreve RBK et al. (2007) Hysteretic damping in a small-strain stiffness model. Proc. NUMOG X, 737-742.
- Kalman RE (1960) A new approach to linear filtering and prediction problems. Trans. ASME Ser DJ Basic Eng 82(1): 35-45.
- Julier SJ, Uhlmann JK (2002) Reduced sigma point filters for the propagation of means and covariances through nonlinear transformations. In Proc. Amer. Control Conf pp: 887-892.
- Masaru Hoshiya, Atsushi Suto (1993) Kalman filter-finite element method in identification. Journal of Engineering Mechanics 119(2): 197-210. 4.
- Nguyen LT, y Nestorovic T (2015) Nonlinear Kalman Filters for Model Calibration of Soil Parameters for Geomechanical Modeling in Mechanized Tunneling. Journal of Computing in Civil engineering.
- Sagaseta C, Moya JF, y Oteo C (1981) Estimation of ground subsidence over urban tunnels. Proceeding 2nd Conference on ground movements and structures. Cardiff. Session IV.
- Santos JA, Correia AG (2001) Reference threshold shear strain of soil, its application to obtain a unique strain- dependent shear modulus curve for soil. Istanbul: In Proceedings 15th International Conference of Soil Mechanics and Geotechnical Engineering.
- Schanz T et al. (1999) The hardening-soil model: Formulation and verification. Rotterdam: In Brinkgreve RBJ, Beyond 2000 in Computacional Geotechnics.
- Uhlmann JK (1995) A real time algorithm for simultaneous map building and localization.
- Van Der Merwe Rudolph, Eric A Wan (2001) The square-root unscented Kalman filter for state and parameter-estimation. IEEE international conference on acoustics, speech, and signal processing. Proceedings (Cat. No. 01CH37221).


