A Study on Comparison of Probability Distributions for Frequency Analysis of Low-flow
Vivekanandan N1* and Poornima RK2
1sup> Scientist-B, Central Water and Power Research Station, Pune, Maharashtra, India
2M.Tech. student, Department of Civil Engineering, University Visvesvaraya College of Engineering, Bangalore, India
Submission: April 16,2021; Published: May 10, 2021
*Corresponding Author: Vivekanandan N, Scientist-B, Central Water and Power Research Station, Pune, Maharashtra, India
How to cite this article: Vivekanandan N, Poornima RK. A Study on Comparison of Probability Distributions for Frequency Analysis of Low-flow. Civil Eng Res J. 2021; 11(4): 555819. DOI: 10.19080/CERJ.2021.11.555819
Abstract
Assessment of low-flow is important for hydrological and water resource management, water quality regulation, reservoir storage design, hydro-electric power generation in arid periods and habitat protection. This can be achieved through Low-flow Frequency Analysis (LFA) by fitting probability distribution to the annual minimum d-day average flow series for different duration of ‘d’ viz., 7-, 10-, 14- and 30-days that is derived from the daily stream flow data series. This paper presents a study on comparison of four probability distributions such as Pearson Type-3, Log Pearson Type-3, 2-parameter Log Normal (LN2) and 2-parameter Weibull for frequency analysis of low-flow for river Cauveri at Kollegal gauging site. Standard parameter estimation procedures viz., method of moments, maximumlikelihood method and L-Moments (LMO) are used for determination of the parameters of the distributions wherever applicable. The adequacy of fitting four distributions adopted in LFA is evaluated by quantitative assessment using Goodness-of-Fit (viz., Chi-Square and Kolmogorov-Smirnov) and diagnostic (viz., correlation coefficient and root mean squared error) tests, and qualitative assessment using the fitted curves of the estimated low-flow. On the basis of the results of quantitative and qualitative assessments, the study indicates the LN2 (LMO) distribution is better suited for estimation of low-flow at Kollegal site of Cauvery river.
Keywords:Chi-square; Correlation coefficient; Kolmogorov-Smirnov; L-Moments; Log Normal; Low flow; Root mean squared error
Introduction
Assessment of low-flow is important for hydrological and water resource management, as it is a critical factor for basin restoration, water quality regulation, reservoir storage design, hydro electric power generation in arid periods and habitat protection [1]. Numbers of indices such as mean annual runoff, mean daily flow, median flow, Annual Minimum d-day Average Flow (AMdAF), absolute minimum flow are widely used to characterize the low-flow. Among these, AMdAF is generally adopted procedure for characterizing low-flow in a stream, which is computed by averaging the flow using moving average method for ‘d’ consecutive days viz., 7-, 10-, 14- and 30-days. An associated, annual event based, low-flow statistic q(d,T) gives a low-flow estimate, which is defined as the AMdAF that is expected to be occurred once in T-year return period [2].
Out of number of available probability distributions, the Pearson Type-3 (PR3), Log Pearson Type-3 (LP3), 2-parameter Log Normal (LN2) and 2-parameter Weibull (WB2) are most commonly used in LFA [3-6]. Ahn et al. [7] applied Power and SMEMAX (Small, MEdium and MAXimum) transformation, LN2, LP3 and WB2 distributions to estimate the 7-day and 30- day low-flows for different return periods at four gauged points of the Ansung stream in Korea. Bowers et al. [8] analyzed the seasonal river flow data and found both power law and LN2 distributions are relevant to dry seasons. They also found that the river flow data in wet seasons are typically better fitted using LN2 than power law. Farmer et al. [9] recommended the use of inverse moments or negative moment orders for low flow series because the positive moment orders do not effectively capture the probabilistic lower tail behaviour of flows above a certain exceedance probability. Randall & Freehafer [10] applied regression method to study on low-flow statistics at ungauged sites in the Lower Hudson River Basin, New York. They found that the logarithmic transformation yielded less accurate equations inconsistent with some conceptualized relationships. In light of the above, in the present study, the PR3, LP3, LN2 and WB2 distributions are adopted in LFA for estimation of low flow.
Generally, Method of Moments (MoM) is applied for determination of parameters of the probability distributions [11]. But, the studies carried out by various researchers indicated that the estimated parameters of distributions fitted by the MoM are often less accurate than those obtained by other parameter estimation procedures viz., Maximum Likelihood Method (MLM) and L-Moments (LMO) [12-14]. Therefore, for the present study, the MoM, MLM and LMO are applied for determination of the parameters of the distributions that are adopted in LFA. The adequacy of fitting four probability distributions adopted in LFA is evaluated by quantitative assessment using non-parametric Goodness-of-Fit (viz., Chi-Square (χ 2 ) and Kolmogorov-Smirnov (KS)) and diagnostic (i.e., Correlation Coefficient (CC) and Root Mean Squared Error (RMSE)) tests, and qualitative assessment using the fitted curves of the estimated low-flow. This paper presents the procedures applied in determining the parameters of PR3, LP3, LN2 and WB2 distributions using MoM, MLM and LMO for estimation of low flow at Kollegal gauging site of river Cauvery and the results obtained thereof.
Methodology
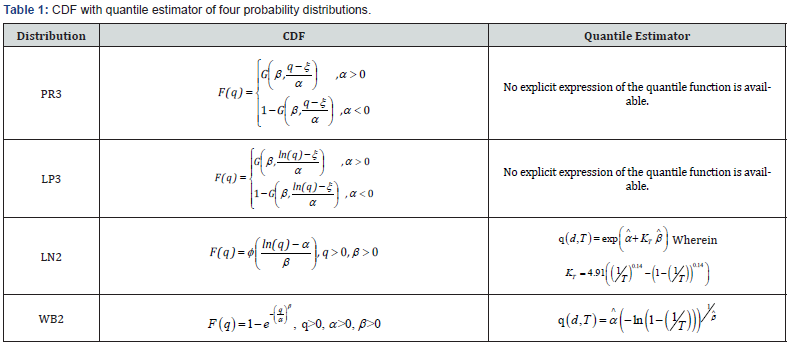
In this paper, the AMdAF series for different duration of ‘d’ viz., 7-, 10-, 14-, and 30-days are extracted from the daily stream flow data series and also used in LFA. The Cumulative Distribution Function (CDF) with quantile estimator (q(d,T)) of four distributions [15,16] adopted in LFA are presented in Table 1. In Table 1, q is the variable (i.e., low-flow), ξ is the location parameter, α is the scale parameter, β is the shape parameter, F(q) is the CDF of q, is G(…) is the incomplete Gamma integral and φ(…) is the CDF of the standard normal distribution. The estimators of the parameters (viz., location, scale and shape) are determined by MoM, MLM and LMO; and are used to estimate the q(d,T) for a duration (d) and return period (T). The procedures involved in determining the parameters of the distributions using MoM, MLM and MLM are briefly described in the text book titled ‘Flood Frequency Analysis’ by [17].
Goodness-of-fit tests
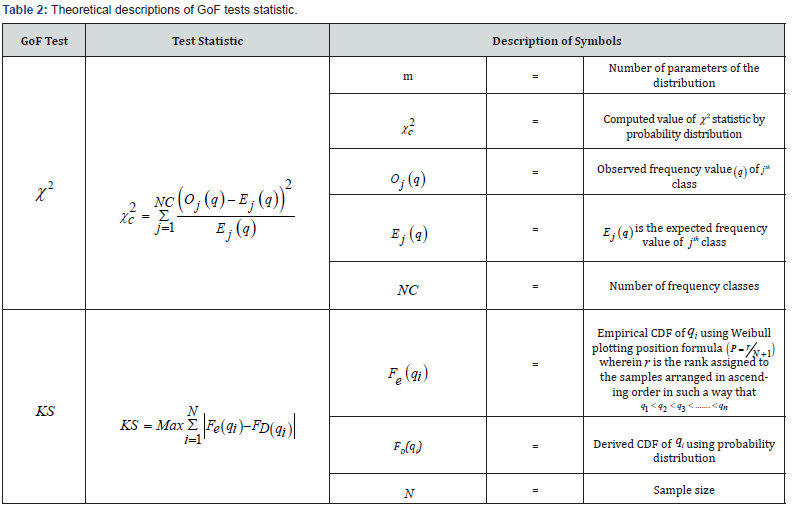
A non-parametric GoF tests viz., Chi-square (χ2) and Kolmogorov- Smirnov (KS) are applied for checking the adequacy of fitting PR3, LP3, LN2 and WB2 distributions adopted in LFA. The theoretical descriptions of GoF tests statistic are presented in Table 2. The rejection region of χ2 test statistic at the desired significance level (η) is given by 1 , NC-m-1 2 2 χc ≥ χ −η . The theoretical values of GoF tests statistic for different significance level (η) are available in the technical note on ‘Goodness-of-Fit Tests for Statistical Distributions’ [18].
Test criteria: If the computed values of GoF tests statistic given by the distribution are less than that of its theoretical value at the desired significance level then the selected distribution is considered to be adequate for LFA.
Diagnostic test
The selection of most suitable probability distribution with parameter estimation method for estimation of low-flow is made through diagnostic test using CC and RMSE. The theoretical expressions of CC and RMSE [19] are given as below:
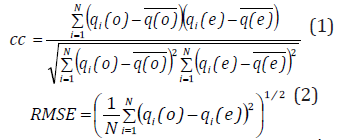
where, qi(o) is the observed low-flow (q) of ith sample and qe(o) is the estimated low-flow (q) of ith sample, q(o) is the average of the observed low-flows and q(e ) is the average of the estimated low-flows. The probability distribution with high CC (say, CC>0.9) and minimum RMSE is identified as a better-suited for estimation of low-flow.
Application
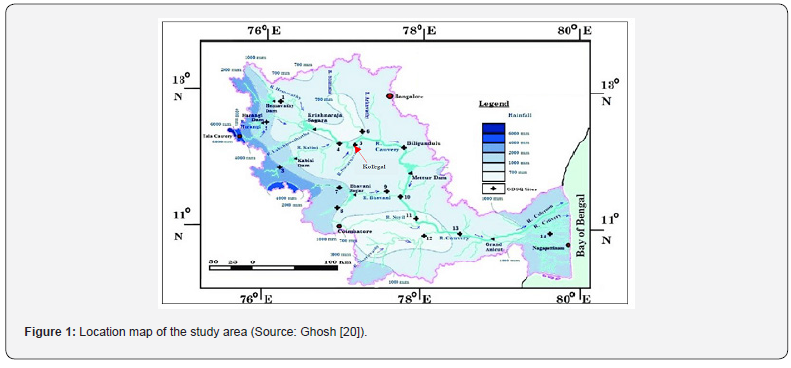
In this paper, a study on comparison of four probability distributions viz., PR3, LP3, LN2 and WB2 using MoM, MLM and MLM for estimation of low-flow at Kollegal gauging site of river Cauvery is carried out. The Cauvery river rises at an elevation of 1341 m at Talakaveri on the Brahmagiri range near Cherangala village of Kodagu district of Karnataka [20]. The river basin lies between 75° 27’ to 79° 54’ east longitudes and 10° 9’ to 13° 30’ north latitudes. The total length of the river from origin to outfall is 800 km and drains into the Bay of Bengal. The river basin extends over states of Tamil Nadu, Karnataka, Kerala and Union Territory of- Puducherry draining an area of 81155 km2, which is nearly 2.7% of the total geographical area of the country. The Kollegal gauging site is located between 77° 06’ 00’’ east longitude and 12° 11’ 21’’ north latitude in Chamarajanagar district of Karnataka state, which is one of the tributary of Cauvery river. The catchment area of the Kollegal site is 21082 km2. Figure 1 shows the location map of the study area. In the present study, the daily stream flow data observed at Kollegal gauging site for the period 1990 to 2018 is used.
Results and Discussions
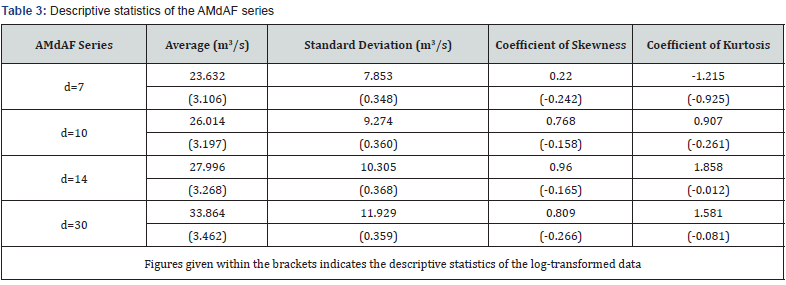
In the present study, the AMdAF series for different duration of ‘d’ viz., 7-, 10-, 14-, and 30- days was extracted from the daily stream flow data series and are used for LFA. The descriptive statistics of the AMdAF series for different duration of ‘d’ viz., 7-, 10-, 14- and 30- days are presented in Table 3.
Estimation of q(d,T) using probability distributions
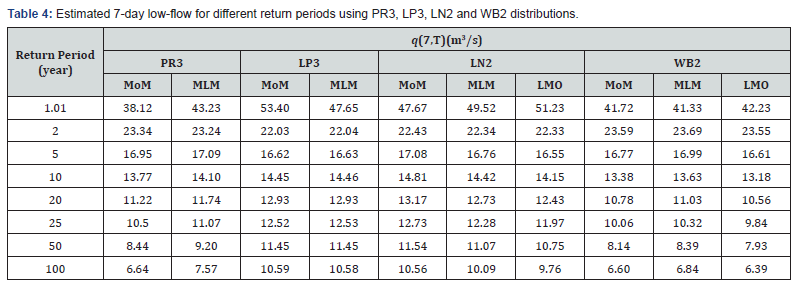
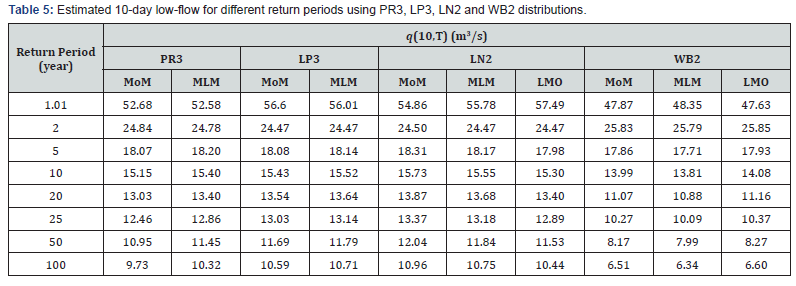
In the present study, the parameters of PR3, LP3, LN2 and WB2 distributions were determined by MoM, MLM and LMO for the AMdAF series for different duration of ‘d’ viz., 7-, 10-, 14- and 30-days. These parameters were used to estimate q(d,T) for different duration (d) and for different return period (T); and the results are presented in Tables 4 to 7. From LFA results, it is noted that the q(d,T) estimates for different duration of ‘d’ viz., 10-, 14- and 30-days obtained from WB2 (MLM) distribution are low er than those values of other probability distributions adopted in LFA for the return periods from 10-year to 100-year. From the data analysis, it is found that the determination of parameters of PR3 and LP3 distributions using LMO is not feasible and hence the LFA results of PR3 (LMO) and LP3 (LMO) are not presented in Tables 4 to 7. Also, the GoF and diagnostic tests results of PR3 (LMO) and LP3 (LMO) are not presented in Tables 8 and 9.


Low-flow frequency curves (LFCs)
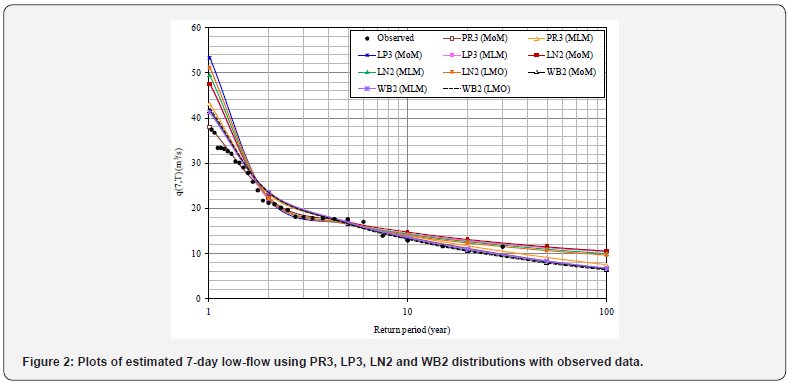
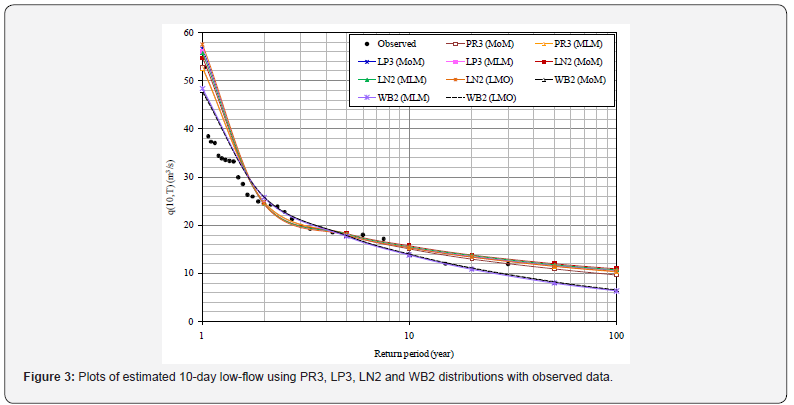
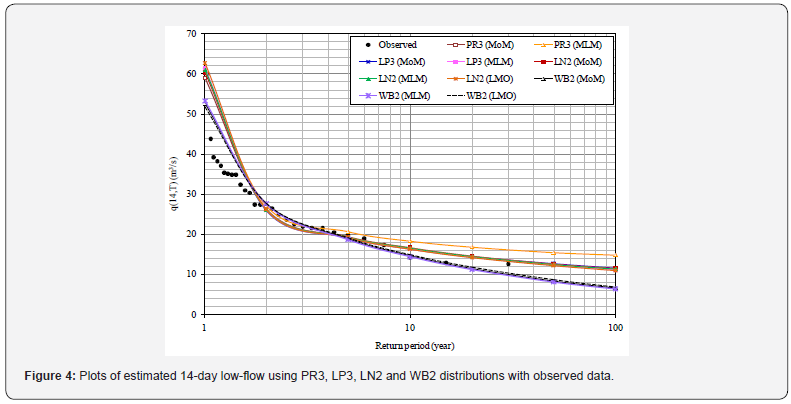
The estimated values of q(d,T) for different duration of ‘d’ viz., 7-, 10-, 14-, and 30-days and for the return periods from 1.01- year to 100-year were used to develop LFCs and are presented in Figures 2 to 5. From LFCs, it can be seen that there is a line of agreement between the observed and estimated low-flows using LN2 when compared with PR3, LP3 and WB2. Also, from LFCs, it is noted that the observed low-flows are nearer to the estimated low-flows by LN2 (LMO).
Analysis of results based on GoF tests
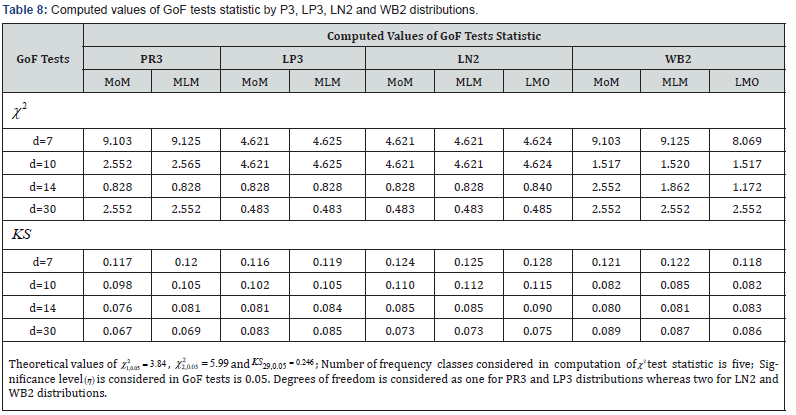
GoF tests statistic values for the AMdAF series for different duration of ‘d’ viz., 7-, 10-, 14-, and 30-days were computed and are presented in Table 8. From GoF tests results, it is noted that:
GoF tests statistic values for the AMdAF series for different duration of ‘d’ viz., 7-, 10-, 14-, and 30-days were computed and are presented in Table 8. From GoF tests results, it is noted that:
b) χ 2 test results didn’t support the use of LP3 for modelling the AM10AF data.
c) χ 2 test results confirmed the applicability of PR3, LP3, LN2 and WB2 for LFA using the AM14AF and AM30AF data series.
d) KS test results supported the use of PR3, LP3, LN2 and WB2 distributions for LFA using the AMdAF data series for different duration of ‘d’ viz., 7-, 10-, 14- and 30- days.
Analysis of results based on diagnostic test
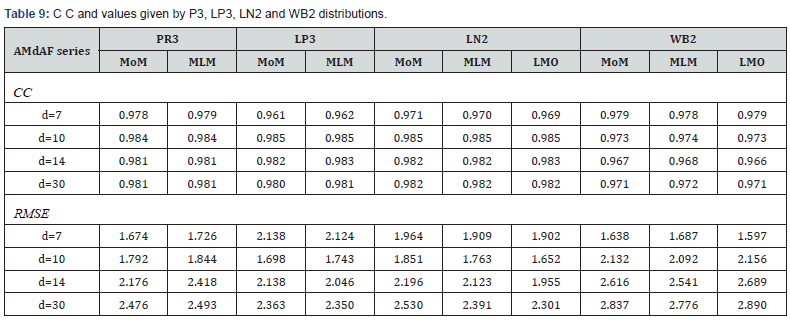
In addition to GoF tests, the performance of PR3, LP3, LN2 and WB2 distributions adopted in LFA using the AMdAF data series for different duration of ‘d’ viz., 7-, 10-, 14-, and 30-days was evaluated by CC and RMSE. The CC and RMSE values for the AMdAF data series for different durations of ‘d’ were computed by the aforesaid probability distributions and are presented in Table 9. From Table 9, it is noticed that the RMSE given by WB2 (LMO) is minimum for AM7AF data while LN2 (LMO) for AM10AF, AM14AF and AM30AF data when compared with those values of other probability distributions adopted in LFA while MoM, MLM and LMO are applied for determining the parameters of the distributions. But, for AM7AF series, it is noted that the fitted line by using the estimated low-flow of LN2 (LMO) is closer to the observed data though the RMSE of WB2 (LMO) is lower than those value of LN2 (LMO). From the CC values, it is noted that there is a very good correlation between the observed and estimated low-flows using PR3, LP3, LN2 and WB2 distributions, and these values vary between 0.961 and 0.985. Based on the results of the quantitative and qualitative assessments, it is identified that the LN2 (LMO) is better suited distribution for estimation of low-flow at Kollegal site.

Conclusion
The paper presented a study on comparison of four probability distributions viz., PR3, LP3, LN2 and WB2 adopted in frequency analysis of low-flow for river Cauvery at Kollegal gauging site. The parameters of the distributions were determined by MoM, MLM and LMO, and are used for estimation of q(d,T) for different duration of ‘d’ viz., 7-, 10-, 14- and 30-days and for different return period vary from 1.01-year to 100-year. From the LFA results, the following conclusions were drawn from the study.
a) χ2 test results supported the use of LN2 distribution for modelling the AM7AF and AM10AF while PR3 and WB2 for AM10AF.
b) χ2 test results confirmed the applicability of PR3, LP3, LN2 and WB2 distributions for modelling the AM14AF and AM30AF.
c) KS test results confirmed the applicability of PR3, LP3, LN2 and WB2 distributions for modelling the AM7AF, AM10AF, AM14AF and AM30AF data series.
d) The q(d,T) estimates for different duration of ‘d’ viz., 10-, 14- and 30-days obtained from WB2 (MLM) distribution are lower than those values of other probability distributions adopted in LFA for the return periods from 10-year to 100-year.
e) CC values given by PR3, LP3, LN2 and WB2 distributions indicated that there is a good correlation between the observed and estimated low-flows and these values vary between 0.961 and 0.985.
f) Qualitative assessment (plots of the LFA results) of the outcomes was weighed with RMSE and accordingly LN2 (LMO) distribution is found to be better suited for estimation of lowflow.
g) The LFCs indicated that the estimated low-flows using LN2 (LMO) are nearer to the observed low-flows.
The study suggested that the estimated low-flows by LN2 (LMO) distribution could be adopted for various applications such as water resource management, water quality regulation, reservoir storage design, hydro electric power generation in arid periods and habitat protection.
Acknowledgment
The authors are grateful to the Director, Central Water and Power Research Station, Pune, for providing the research facilities to carry out the study.
References
- Tosunoglu F, Salvadori G, Yilmaz M (2020) Multivariate Assessment of Low-Flow Hazards via Copulas: The Case Study of the Çoruh Basin (Turkey). Water 12: 1-18.
- Kernell GR (2012) Estimation of low-flow duration discharges in Massachusetts, United States Geological Survey, Water-Supply Paper No. 2418.
- Kroll CN, Vogel RM (2002) Probability distribution of low stream flow series in the United States. Journal of Hydrologic Engineering 7(2): 137-146.
- Peng S, Xi C, Si-min Q, Zhi-cai Z, Jian-liang M (2010) Regional frequency analysis of low flow based on L moments: Case study in Karst Area, Southwest China. Journal of Hydrologic Engineering 15(5): 370-377.
- Blum AG, Archfield SA, Vogel RM (2017) On the probability distribution of daily streamflow in the United States. Hydrology and Earth System Sciences 21(6): 3093-3103.
- Lee KS, Kim SU (2008) Identification of uncertainty in low-flow frequency analysis using Bayesian MCMC method. Journal of Hydrological Processes 22(12): 1949-1964.
- Ahn TJ, Lyu HJ, Yo WS, Park JE (1998) Frequency analysis of low flows at gauged points of the Ansung stream. KSCE Journal of Civil Engineering 2(1): 23-33.
- Bowers MC, Tung WW, Gao JB (2012) On the distributions of seasonal river flows: Lognormal or power law? Water Resources Research 48: 1-12.
- Farmer WH, Over TM, Vogel RM (2015) Multiple regression and inverse moments improve the characterization of the spatial scaling behaviour of daily stream flows in the Southeast United States. Water Resources Research 51(3): 1775-1796.
- Randall AD, Freehafer DA (2017) Estimation of low-flow statistics at ungaged sites on streams in the Lower Hudson River Basin. US Geological Survey Scientific Investigations Report-5019, p. 1-42.
- Durrans SR (1996) Low-flow analysis with a conditional Weibull tail model. Water Resources Research 32(6): 1749-1760.
- Jain SK, Agarwal PK, Singh VP (2007) Hydrology and Water Resources in India. Water Science & Technology Library, Springer Link Publications, Netherlands.
- Johnson NL, Kotz S, Balakrishnan N (1994) Maximum likelihood estimation for Weibull Distribution. John Wiley and Sons Publications, New York, USA.
- Bilkova D (2012) Lognormal distribution and using L-moment method for estimating its parameters. Journal of Mathematical Models and Methods in Applied Sciences 1(6): 30-44.
- Vogel RM, Kroll CN (1990) Generalised low-flow frequency relationships for ungauged sites in Massachusetts. Water Resources Bulletin 26(2): 241-253.
- Heo JH, Salas JD, Kim KD (2001) Estimation of confidence intervals of the quantiles for the Weibull distribution. Stochastic Environmental Research and Risk Assessment 15(4): 284-309.
- Rao AR, Hamed KH (2000) Flood frequency analysis. CRC Publications, New York, USA.
- Charles Annis PE (2009) Goodness-of-Fit tests for statistical distributions.
- Vivekanandan NA (2020) Comparative study on Gumbel and LP3 probability distributions for estimation of extreme rainfall. International Journal of Water Resources Engineering 6(1): 21-33.
- Ghosh N, Bandyopadhyay J, Thakur J (2018) Conflict over Cauvery Waters: Imperatives for Innovative Policy Options. Observer Research Foundation, New Delhi, India.


