The Effectiveness of Transverse Rumble Strip to Reduce Speed
Muhammad Marizwan*, Abdul Manan, Norfaizah, Mohamad Khaidir, Syed Tajul Malik, Syed Tajul Arif, Noraini and Mohd Din
Malaysian Institute of Road Safety Research (MIROS), Malaysia
Submission: March 27, 2019;Published: April 08, 2019
*Corresponding Author: Muhammad Marizwan Abdul Manan, Malaysian Institute of Road Safety Research (MIROS), Malaysia
How to cite this article: Muhammad M, Abdul M, Norfaizah, Mohamad K, Syed TM, et al. The Effectiveness of Transverse Rumble Strip to Reduce Speed. Civil Eng Res J. 2019; 8(1): 555727. DOI: 10.19080/CERJ.2019.08.555727
Abstract
Transverse Rumble Strip (TRS) are placed across the travel lanes of the roadway and perpendicular to flow of vehicles. The strips typically placed crossing the roadway surface to provide a tactile and audible warning to alert drivers on unusual traffic conditions. The main aim of this study is to evaluate the effectiveness of the TRS to reduce operating speed of traffic along selected road sections. Types of analysis conducted were speed distribution, average speed reduction and rate of braking by road users before and after the installation of TRS. Two locations were selected for this study i.e. Jalan Sultan and Jalan Barat. The key findings obtained in this study is operating speed was reduced at both locations after the installation of TRS. The speed compliancy rate was also increased with the presence of TRS at both locations. The compliancy was maintained even after 1-week of TRS installation. In evaluating the rate of braking, the higher rate was obtained after 1-day of TRS installation than any other period on both sites. Due to its potential as a countermeasure in reducing or controlling operating speed, it is recommended that TRS is installed at high risk location such as at curve or approaching intersection. However, TRS usage at downhill slope should be further studied or improvised due to the non-significant speed reduction obtained in this study. Precautions should be taken in ensuring that the specifications and materials used for TRS is following the standard and comply with the surface skid resistance value.
Keywords: Transverse Rumble Strip; Traffic Calming; Speed Management
Introduction
The City Council of Petaling Jaya (MBPJ) has decided to install Transverse Rumble Strip (TRS) at two (2) identified locations in Petaling Jaya. The locations were picked due to the high operating speed observed and the presence of curve alignment at the area. The installation of TRS is hoped to be able to reduce the speed of road users. Due to unavailability of reliable findings pertaining the effectiveness of TRS in reducing speed as well as the use of TRS in the urban roads such as in the city of Petaling Jaya, this evaluation study is necesary to be conducted. The focus of this study is to look into the effectiveness of TRS along curve road sections. This is because higher accident rates have been found in sharp curves on road sections than any other road sections [1-4]. Measures in horizontal curves are designed to reduce the accident rate in curves by giving good prior warning of these curves, indicating the path of the curve as clearly as possible and possibly reducing the speed in the curve [3]. Speed-reducing devices are intended to force vehicles to keep to low speeds, so that the risk of crashes is reduced, and the feelings of safety is increased [3]. Speed-reducing devices include speed humps, raised pedestrian crossings, raised junctions (plateau junctions), rumble strips, narrowing road width and speed zones [5,6].
Rumble strips as one of the speed control measures are changes in the road surface that lead to knocks, vibration and or noise within the car and these strips can be constructed using coarse road surfaces or strips of plastic, which are placed across the road on top of the road surface [3]. This can be achieved by introducing grooves on the roadway or rows of raised pavement markers placed on the roadway in such a manner that, they produce sound (noise) and vibration as the tires of a vehicle contact them [3,7]. The noise and vibration produced by rumble strips can also be intended to alert inattentive drivers that they have departed from their lane, or to give advance notice of a change in the roadway ahead [7]. The use of TRS on Malaysia’s roads can be seen at interchange ramps, climbing and downhill road sections and approaching to intersections with the aim to reduce approaching vehicle speed [6].
Generally, there are three (3) types of rumble strips i.e.
1. Shoulder rumble strips
2. Centreline rumble strips and
3. TRS as shown in Figure 1 below [8].

Shoulder rumble strips are placed on roadway shoulders, outside of the travel lane. The purpose of shoulder rumble strips is mitigating single vehicle run-of-road type crashes. Meanwhile, centerline rumble strips are installed on or near centerline of roadway and the purpose is to mitigate head-on crashes and opposite direction sideswipe crashes. And lastly, TRS are placed across the travel lanes of the roadway and perpendicular to flow of vehicles. TRS is also known as transverse bar, yellow bar and speed breaker.
According to Elvik et al. [3], rumble strips reduce the number of injury accidents at junctions by around 33% and the number of property-damage-only accidents by around 25%. The effect is assumed to last for 3 years [9]. The rumble strips must then be renewed for it to be effective [3,10]. The rumble strips are assumed to have an effect for the last 100m ahead of the junction [3]. The speed on this stretch is assumed to reduce from 35 to 25km/h, which corresponds to a delay of around 4s per vehicle [3].
Methodology
The study framework has six phases (See Figure 2): Desk study, pre implementation, construction, 1st post implementation (a day after installation of the TRS), 2nd post implementation (1 week after installation) and reporting.


The secondary data was obtained from MBPJ which comprise the information available on the TRS such as the location to be installed, the type and specification of the TRS and any other relevant data necessary for the study. Two locations were selected for the TRS installations (Figure 3&4) by MBPJ. The selected sites are located at a curve section of Jalan Sultan heading to Jalan Barat (Site 1) and at a curve section on Jalan Timur heading to Jalan Sultan (Site 2), Petaling Jaya. These roads form the current one-way loop in the central for Petaling Jaya City Center.
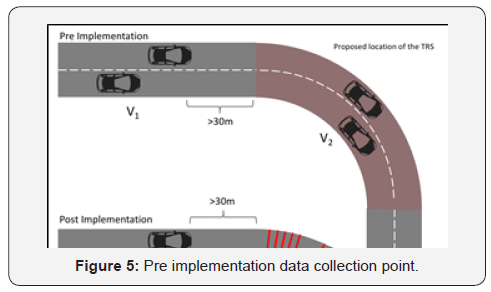
First round of data collection was conducted before installation of the TRS. During this stage, 100 vehicle spot speed readings during morning off-peak hour (9am –11am), before the vehicle reached the proposed location of the TRS (V1), and after the vehicle entered or encroached the proposed location of the TRS (V2) as shown in Figure 5. This is to obtain the speed distribution data and also to see the rate of speed reduction occurred at the location and to observe if the current location has any speed-reduction effect. At the same time, same vehicles were also tracked (via the number plate) as they go pass the curve section and measured its speed before and after the location. Lastly, observation via video recording was also taken just before the curve section in order to observe the brake lights of each vehicle passing at the proposed location of the TRS within one (1) hour period. This is to observe the braking rate of road users from the total of road users passing the proposed location of TRS.
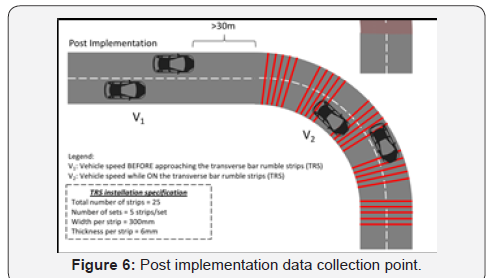
The construction stage was by the MBPJ’s contractor right after the Pre-implementation data collection stage. There will be fifteen (15) strips with 300mm width per strip installed at a curve section along Jalan Sultan dan Jalan Barat. Data collection for post implementation was conducted at two (2) stages. During first stage, 100 vehicle speed readings was obtained similar to the pre implementation stage, right after the TRS being installed (one (1) day after installation) (see Figure 6). This is to see the immediate effect of the TRS onto road users after the implementation. The second stage is to collect another set of 100 vehicle speed after one (1) week the TRS is being installed. This is to observe the long-term effect of the TRS onto road user after long implementation.
Results and Discussion
Jalan Sultan
The curve radius of Jalan Sultan is 70m with the curve length of 95m. The gradient at this point is 0% and climbing towards Jalan Barat. Based on Table 1, the existing mean speed at Jalan Sultan before entering the curve (V1) was 49.78km/h. Even before the TRS being installed, the mean traffic speed was reduced by -4.18km/h (p<0.01) to 45.60km/h when entering the curve (V2). In terms of the compliance rate to the posted 50km/h speed limit, 50% (at V1) to 80% (at V2) of the road users complied before the TRS were being installed.
After one (1) day of TRS installation, the mean speed was reduced by -7.79km/h (p<0.01) to 40.71km/h (at V2) from 48.50km/h (at V1) (see Table 1). While, the speed limit compliance rate was higher at about 60% (at V1) and 90% (at V2). After one (1) week of the TRS installation, the mean speed was reduced much lower by -9.40km/h (p<0.01) (see Table 1) to 41.04km/h (at V1) from 50.44km/h (at V1) when entering the curve. During this time, the speed limit compliance rate was lower at 50% when approaching the curve (V1) but increase significantly to 90% when on the curve section (V2). This shows a great reduction of mean speed even after one (1) week of installation, and also show that the TRS manage to increase the speed limit compliance rate especially at the curve road section where the TRS was installed.
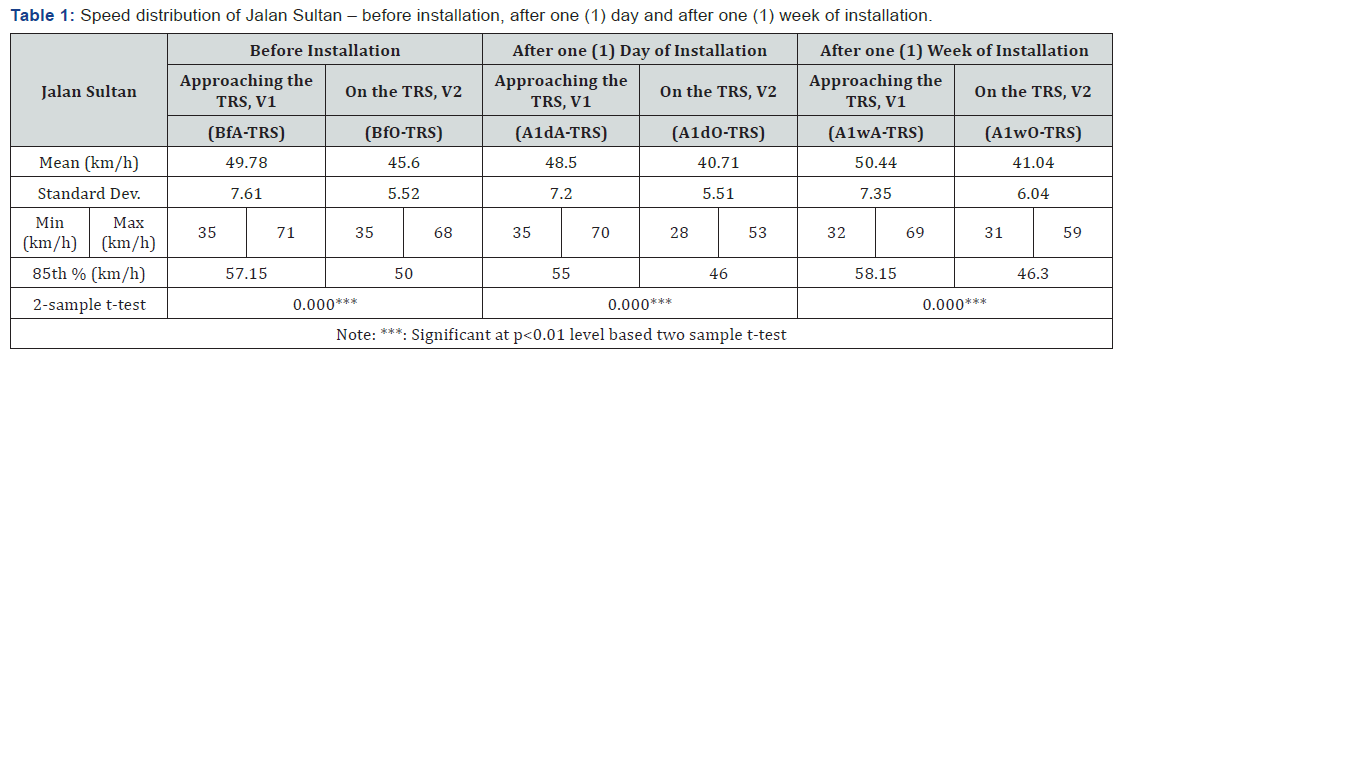
When comparing the road users passing the curve (V2) for before and after installation period, the reduction was about -4.89km/h (after 1 day) and -4.56 (after 1 week) (p<0.01). On the other hand, comparing after one (1) day and one (1) week of installation, the mean speed reduction at the curve section was statically not significant (p>0.05) or in other words, the mean speed during one (1) week remains similar as the mean speed during one (1) day installation but lower than when there is no TRS installed along the curve section.
Jalan barat
The curve radius of Jalan Barat is 30m with the curve length of 55m. The gradient at this point is approximately -3% to -4% and downwards towards Jalan Utara. Based on Table 2, the existing mean speed at Jalan Barat before entering the curve (V1) was 47.45km/h. Even before the TRS being installed, the mean traffic speed was reduced by -5.13km/h (p<0.01) to 42.32km/h when entering the curve (V2) (see Table 2). In terms of the speed limit compliance rate, 76% (at V1) and 95% (at V2) of the road users complied with the speed limit before the TRS were being installed. After one (1) day of TRS installation at Jalan Barat, the mean speed was reduced by -5.52km/h (p<0.01) to 41.40km/h from 46.92km/h (V1) (see Table 2). During the period of installation, the speed limit compliance rate was similar to before installation at about 76% (at V1) and 95% (at V2). After one (1) week of the TRS installation, the mean speed was reduced by 4.00km/h (p<0.01) (see Table 2) to 42.91km/h (V2) from 46.96km/h (V1) when entering the curve. During the 1-week period of after installation, the speed limit compliance rate increases slightly to about 78% (at V1) and 97% (at V2). This shows that there is a reduction in mean speed even after one (1) week of installation and the TRS manage to increase the speed limit compliance rate especially at the curve road section where the TRS was installed.

Comparing the road users passing the curve (V2) at Jalan Barat during before and after installation period, the mean speed reduction was minimal (0.92km/h reduction) and minor increase (0.59km/h) (p>0.05). Moreover, comparing after one (1) day and one (1) week of installation, the mean speed increased by +1.51km/h at the curve section (p<0.05) or in other words, TRS installed along the curve section at Jalan Barat may have no effect overtime.
Speed reduction by vehicle tracking at Jalan Sultan and Jalan Barat
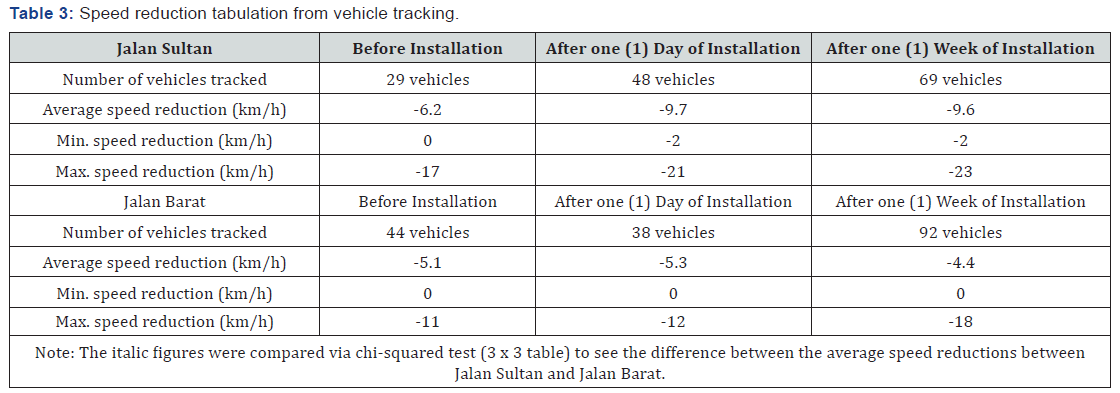
In order to compliment the previous mean speed analysis, the same vehicles were also tracked (via the number plate) as they pass by the curve section and measured its speed before and after the location. Similarly, from the previous analysis, Table 3 shows that the average speed reduction after one (1) day and one (1) week of installation (-9.7km/h and -9.6km/h) for Jalan Sultan were much higher than the average speed reduction before the installation of TRS (-6.2km/h). However, Jalan Barat show a different scenario compared to Jalan Sultan, as the average speed reduction were much lower during before (-5.1km/h) and after installation (-5.3km/h and -4.4km/h).
Braking behaviour at jalan sultan and jalan barat
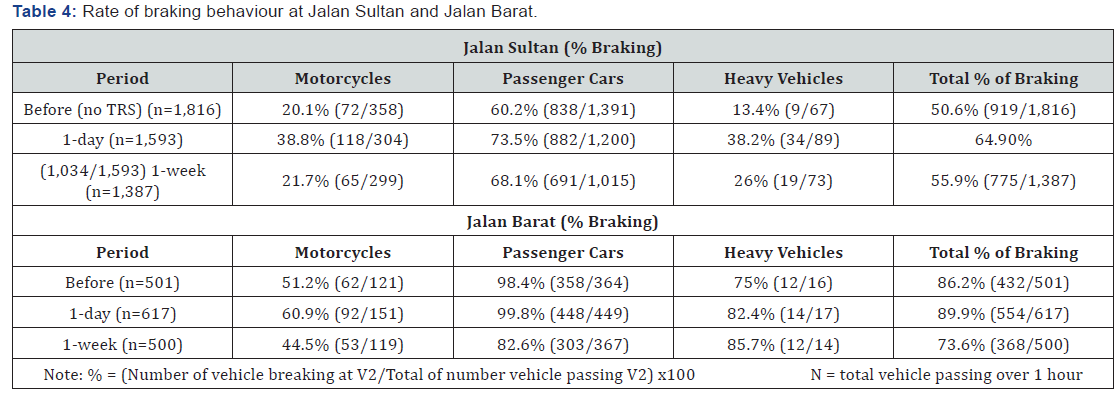
Braking behaviour data was also analysed. This was carried out in order to observe the rate of braking of road users from the total of road users passing the proposed location of TRS. The higher the rate of braking shows the success of the TRS slowing down the road users during a period of time. Analysis shows that the total rate of braking was much higher during the one (1) day after the TRS installation (64.9% - 89.9%) than any other period on both roads (see Table 4). Passenger cars shows a much higher rate of braking than any other vehicle type while motorcycles show a much lower rate of braking especially on Jalan Sultan. Comparing the rate of braking between the two roads, Jalan Barat shows a higher rate of braking from the road users compared to Jalan Sultan.
Conclusion
This study was conducted in collaboration with the MBPJ City Council and MIROS. Two (2) locations was selected as study site i.e. a curve section of Jalan Sultan headings to Jalan Barat (Site 1 or named as ‘Jalan Barat’) and a curve section on Jalan Timur heading to Jalan Sultan (Site 2 or named as ‘Jalan Sultan’). The aim of this study is to evaluate the effectiveness of Transverse Rumble Strip (TRS) in reducing the operating speed along the curve section. Three (3) analyses were conducted in order to achieve the study aim i.e. speed distribution analysis, speed reduction analysis and braking rate analysis. The key findings obtained in this study are:
A. Speed distribution and reduction analysis conducted indicates that operating speed was reduced at both locations before the installation of TRS and after one (1) day of TRS installation. However, the speed reduction is higher with presence of TRS. In addition, the speed reduction is more obvious at Jalan Sultan compare to Jalan Barat.
B. In terms of speed compliance, the speed compliancy rate was also increased with the presence of TRS at both locations. The compliancy was also maintained even after one (1) week of installation of TRS.
C. In evaluating the rate of braking, the higher rate was obtained after one (1) day of TRS installation than any other period on both sites and Jalan Barat shows higher braking rate as compare to Jalan Sultan.
Due to its potential as a countermeasure in reducing or controlling operating speed, we are recommending that TRS is installed at high risk locations such as approaching curves or intersections. The TRS usage at down slope sections should be further studied or improvised due to the non-significant speed reduction, i.e. no difference in speed reduction, obtained in this study. In addition, precaution should be taken in ensuring that the specifications and material used for TRS is following the standard and comply with the established surface skid resistance value.
Acknowledgement
The authors would like to express their sincerest appreciation to the Director-General of the Malaysian Institute of Road Safety Research (MIROS), Siti Zaharah Ishak, Ph.D., for providing her full support in completing this study. Deepest gratitude goes to research assistant’s team; Azzemi Aziz and Zulfadhli Sharifudin for their help and contribution towards the completion of this project. Finally, the authors would also like to express special thanks to Tuan Haji Sazulazmi Rakip, Assistant Engineer from Traffic Section, Engineering Department, City Council of Petaling Jaya (MBPJ) for his contribution in this project.
References
- Abdul Manan MM, Várhelyi A, Çelik AK, Hashim HH (2107) Road characteristics and environment factors associated with motorcycle fatal crashes in Malaysia. IATSS Research, 42(4): 207-220.
- Perez-Fuster P, Rodrigo MF, Ballestar ML Sanmartin J (2013) Modeling offenses among motorcyclists involved in crashes in Spain, Accident Analysis & Prevention 6 (2013): 95-102.
- Elvik R, Høye A, Vaa T, Sørensen M (2009) The Handbook of Road Safety Measures. (2nd Edn), Bingley, United Kingdom: Emerald Group Publishing Limited, UK.
- Garber NJ, Haas PR, Gosse C (2010) Development of Safety Performance Functions for Two-Lane Roads Maintained by the Virginia Department of Transportation, Virginia Transportation Research Council, FHWA/VTRC 10-R25.
- Abdul Manan MM, Alvin Poi WH, Ahmad Farhan MS (2010) Evaluation of Traffic Calming Scheme Around the Schools in Malaysia. In 8th Malaysian Road Conference (MRC8), Kuala Lumpur, Malaysia.
- Tam AKW (2006) Traffic Calming - To Hump, Bump or Dump?
- Gärling T, Ettema D, Friman M (2013) Handbook of Sustainable Travel. London, UK: Springer, UK.
- (2019) MUTCD, "Manual on Uniform Traffic Control Devices," U. S. D. o. T. F. H. Administration.
- Elvik R, Vaa T (2004) Handbook Road Safety Measures.
- Uzzell D, Muckle R (2005) Simulating traffic engineering solutions to predict changes in driving behavior. Transportation Research Part F: Traffic Psychology and Behaviour8(4-5): 311-329.


