A Method of J-M Distance Based "salt-and -pepper" Noise Removing
Jian Wu*
Department of Computer Engineering, Beijing Information Technology College, China
Submission: July 26, 2017; Published: August 22, 2017
*Corresponding author: Jian Wu, Department of Computer Engineering, Beijing Information Technology College, Beijing 100044, China, Email: wuj@bitc.edu.cn
How to cite this article: Jian W u. A Method of J-M Distance Based "salt-and-pepper" Noise Removing. Civil Eng Res J. 2017; 1(3): 555564.DOI: 10.19080/CERJ.2017.01.555564
Abstract
This paper deals with the salt-and-pepper noise existed in the classified satellite images based on the spectral similarity which is identified by the Jeffries-Matusit (J-M) distance. An increased order of J-M distances for the collected samples of the land use/cover (LUC) types are established, the LUC type with the least J-M distance pair separation is chosen and whose patches area less than the minimum mapping unit (MMU) are combined to the other LUC type of the pair. The same processing procedures are performed for all the LUC types. The remaining patches in the last LUC type are merged into the neighboring polygons with the largest shared border based on the nearest theory in the field of map generalization. The optimal image sizes and the correspondingly minimum patch areas for different land cover types are determined based on the results of accuracy assessment. By comparing this post-processing method with the results from ENVI majority model, this proposed method is not only proved to eliminate the salt-and-pepper noise, but improve the classification accuracy to some degree.
Keywords: salt-and-pepper noise; J-M distance; minimum mapping unit.
Introduction
The reliable and accurate information on the land cover (LC) maps can help to provide basic geographical information for further decision making in natural resources management activities. Satellite images with the advantages of almost real time and large areas of coverage are mostly employed to produce the LC maps [1,2]. However, the automatic image classification procedures whatever supervised or unsupervised, pixel based or object based algorithms offer a big challenge in obtaining accurate LC maps, especially in dealing with the salt-and-pepper noise which are highly fragmented features and commonly existed in the classified images [3]. This limit the possible applications of the LU maps derived from satellite imagery. The RS software ENVI provides some useful tools such as majority, clump and sieve to eliminate the effect of salt-and-pepper noise, the post-processing results are influenced largely by the window size and filter or cluster models. Many researchers have also make great efforts in improving the accuracy of the classified images in which the most common approach is to incorporate the ancillary data such as elevation, slope, aspect, geology, soil, hydrology and vegetation maps before, during, or after the image classification [4,5].
Considering the spectral similarity between two different LC types, this paper merges the fragmented features of one LC type into the other LC type with the least J-M distance pair separation. The salt-and-pepper noise is removed and the classification accuracy is improved in this post-processing approach.
J-M Distance
Jeffries-Matusita (J-M) distance is a separability index for classification. The J-M distance JMij is defined for two groups of trained samples i, j as the follow:

where, ¡¡J are two comparable LC types; CiCj and μi,μj are the covariance matrix and the mean vector of class i and j respectively. A big J-M distance means that a big probability of separation between two classes, while a small J-M distance indicates these two classes are easily confused because of the spectral similarity.
Method for Removing Salt-and-Pepper Noise

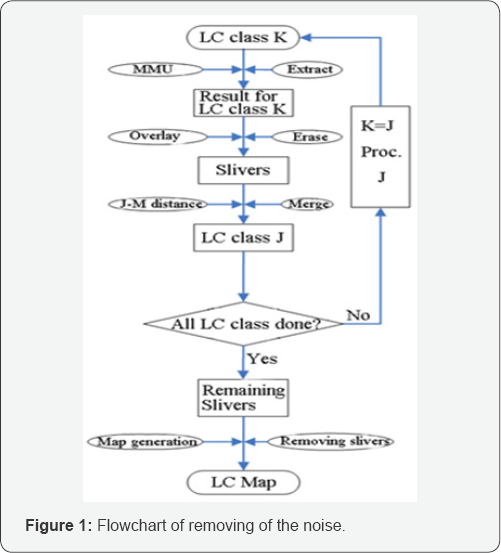
Based on the J-M distances between two LC classes, an increased order of the J-M distance pair separation is formed. Beginning from one of the LC classes with the least J-M distance pair separation, the fragmented features whose areas less than the minimum mapping unit (MMU) are combined to the other LC classes which are performed the same iterative processing procedure until all of the LC classes are processed. All of the remaining slivers are merged into the neighboring polygons with the largest shared border based on the nearest theory in the field of map generalization. The detailed flowchart for removing the salt-and-pepper noise is presented in Figure 1.
Experiment and Result
The Operational Land Imager (OLI) image with path/row of 123/032 onboard the satellite of landsat 8 was downloaded and performed image classification [6]. For eliminating the highly fragmented features, several moving windows as 5x5, 7x7, 9x9, ..., 17x17 are tested and compared with the result obtained by majority model with 3x3 windows. The accuracy is presented in Table 1.
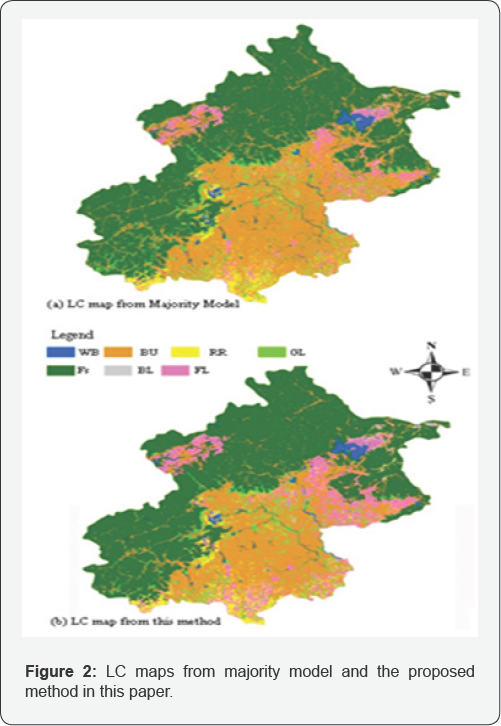
Among all of these parameters of accuracy assessment, Kappa coefficient is a synthetic index indicating the accuracy of LC maps. We can see from Table 1 the LC map accuracy derived from moving windows from 5x5 to 15x15 are higher than the results derived from majority model with 3x3 window size, while it decrease from window size 17x17. Considering the line shaped LC classes of water bodies, the moving window with 7x7 is employed to produce the LC map which is showed in Figure 2(a) and compared with the LC map processed by Majority with 3x3 window size in Figure 2(b).

Note: PA-producer accuracy; UA-user accuracy; OA-overall accuracy; K-Kappa coefficient; WB-water bodies; BU-urban build up; RR-rural residential areas; GL-green lands; BL-bare lands; FL-farm land; Fs-Forests.

Conclusion
The post-processing method proposed in this paper can remove the highly fragmented features commonly existed in the classified satellite images, especially with medium spatial resolution imagery. Such that the method can be employed to improve the accuracy of LC map so as to broaden the applications of the satellite derived LC maps.
References
- Khademi F, Jamal SM, Deshpande N, Londhe S (2016) Predicting strength of recycled aggregate concrete using artificial neural network, adaptive neuro-fuzzy inference system and multiple linear regression. Intl J Sustble Built Envt 5(2): 355-369.
- Khademi F, Akbari M, Nikoo M (2017) Displacement Determination of Concrete Reinforcement Building using Data-Driven models. International Journal of Sustainable Built Environment, DOI: 10.1016/j.ijsbe.2017.07.002.
- Nazari A, Milani AA, Khalaj G (2012) Modeling ductile to brittle transition temperature of functionally graded steels by ANFIS. Applied Mathematical Modelling 36(8): 3903-3915.
- Prasad K, Gorai AK, Goyal P (2016) Development of ANFIS models for air quality forecasting and input optimization for reducing the computational cost and time. Atmospheric environment 128 (2016): 246-262.
- Khademi F, Akbari M, Jamal SM, Nikoo M (2017) Multiple linear regression, artificial neural network, and fuzzy logic prediction of 28 days compressive strength of concrete. Frontiers of Structural and Civil Engineering 11(1): 90-99.
- Motamedi S, Shamshirband S, Petkovic D, Hashim R (2015) Application of adaptive neuro-fuzzy technique to predict the unconfined compressive strength of PFA-sand-cement mixture. Powder Technology 278: 278-285.


