On Monotonic Relationships
Hamit Mirtagioglu1 and Mehmet Mendeş2*
1Bitlis Eren University, Faculty of Arts and Sciences, Department of Statistics Bitlis, Turkey
2Canakkale Onsekiz Mart University, Agriculture Faculty, Biometry and Genetics Unit Canakkale, Turkey
Submission: February 08, 2022; Published: May 13, 2022
*Corresponding author: Mendeş M, Canakkale Onsekiz Mart University, Agriculture Faculty, Biometry and Genetics Unit, Canakkale, Turkey
How to cite this article: Hamit M, Mehmet M. On Monotonic Relationships. Biostat Biom Open Access J. 2022; 10(4): 555795. DOI: 10.19080/BBOAJ.2022.10.555795
Abstract
Detection of the relationship between the variables is a great interest for all scientists. Different correlation coefficients or dependence measures have been developed and proposed for this purpose. In this study, a comprehensive simulation study has been conducted to compare the Spearman Rank, Kendall Tau, Distance, Percentage-Bend, and Hoeffding’s D measures alongside Pearson’s correlation under different types of relationships. Results of this study showed that the Spearman’s rho, Pearson’s r, and Percentage-Bend have found as the strongest correlations for measuring the monotonic relationships. On the other hand, if the relationship between the variables is curvilinear but non-monotonic, the [1,2] and Percentage-Bend correlations have been found to be close to zero. However, when the relation is curvilinear, but monotonic, the Spearman’s rho has found a stronger relationship (rho has a higher absolute value) than the others. For, non-monotonic nonlinear relations the Distance and [1] have found as the suit better.t
Keywords: Linear Relation; Monotonic Relations; Correlation; Simulation
Introduction
Since the aim of many studies is to evaluate the relationships between/among variables, correlation analysis has become one of the basic statistical analyses for the researchers and scientists [3-6]. Correlation coefficient to be used for investigating the relation between the variables varies depending on the type of relationship between the variables. Although the linear relationships are very common, nonlinear, and monotonic relationships can also exist between the variables. It is also possible that there is no relationship between the variables for some cases. Therefore, it is extremely important to determine how the variables are related or what kinds of relations exist between the variables before computing correlation between two variables [7,8]. Because knowing the shape of the relationship between the variables enables us to determine the most appropriate correlation coefficient to be used to calculate the degree of the relationship between the variables reliably. Therefore, before starting to determine the degree of the relationship between two variables, first, it will be useful to determine how the variables are related. Scatter plot can be used for this purpose easily [7,9,10]. The main purpose of this study is to make detailed evaluations about monotonic relationships and determine the most appropriate correlation coefficient(s) for monotonic or non-monotonic. For this objective, a comprehensive Monte Carlo Simulation Study has been carried out to compare six different correlation coefficients under ten different relation types or scenarios.
Material and Methods
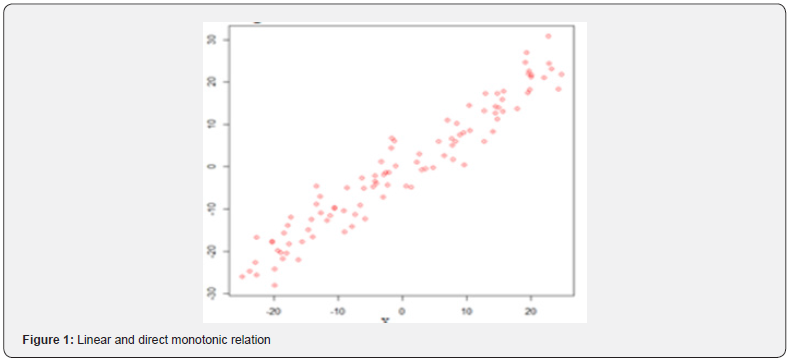
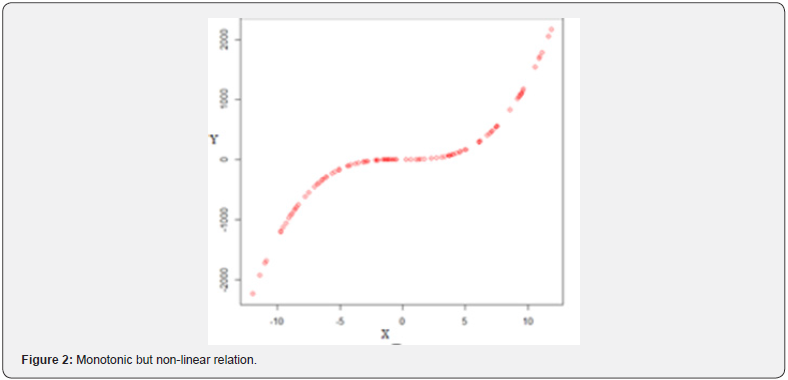
Random numbers generated for bivariate normal variables X(0,1) and Y(0.,1)for sample size of 100 and true population correlations or effect sizes of ρ 0.0, 0.20, 0.60, 0.80, 0.90andρ=via Monte Carlo Simulation Technique consisted of the material of this study. After random numbers generated form the normal distribution, different definition or transformations have been applied to the generated data to construct different type of relationships (linear, non-linear, monotonic and non-monotonic). Created types of relationships have been presented in (Figures 1-10). Then, the [1,2], Percentage Bend, Distance, and [1] correlation coefficients have been computed for 10 different types of relationships. This process has been repeated 10000 times and average value for each correlation coefficient has been computed. All computations were performed by using [11,12].

Fi function in this model represents either linear or nonlinear types of the relationships depending on our purpose. For example, Fi function has been designed as Y=F(x)=X for generating linear relationship. Likewise, in generating other types of relations the Fi function defined as below:


Correlation Coefficients
Pearson’s Moment Correlation Coefficient
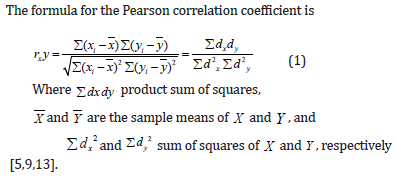
Pearson’s correlation is a measure of linear relationship for two interval scaled variables. The Pearson correlation coefficient is the most used coefficient in practice and if the correlation coefficient is zero or close to zero, it indicates that there is no linear relationship between the two variables [5,6,9,13].
Spearman’s Rho Correlation Coefficient
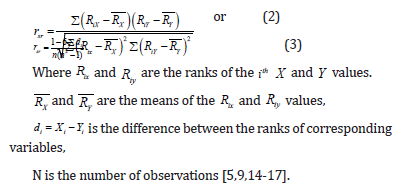
Since this correlation does not require assumptions of linearity and interval measurement levels of the variables, it is considered as nonparametric alternatives of the Pearson’s correlation. Basically, it is a measure of monotonic relationship between two variables. It can also be used for ordinal variables and less sensitive to outliers The assumptions of this coefficient are that as the data must be at least ordinal and the scores on one variable must be monotonically related to the other variable. The Spearman rank correlation can be computed by using following formulas:
Kendall’s Tau Correlation Coefficient
The Kendall Tau or simply Kendall’s correlation is also a nonparametric alternative of the Pearson’s correlation. Since it also identifies monotonic relationships between the variables, it is commonly considered as an alternative correlation coefficient to the Spearman’s correlations [6,7,9,18] reported that any two pairs of rank
Let C be the number of concordant pairs, D be the number of discordant pairs, and n be the sample size, in this case, based on n subjects to be ranked, there will be


Distance Correlation Coefficientt
It is well known that the relations between the variables are not always linear. In some cases, relations between the variables are nonlinear. Therefore, a correlation coefficient that also provides to detect nonlinear relationships between variables is needed. For this purpose, distance correlation coefficient has been [22,6,7,23-25].
Hoeffding’s D Correlation Coefficient
This correlation coefficient can be used as a measure of linear, monotonic, and non-monotonic relationships. Although the values of this correlation vary between –0.5 1to, the sign of this coefficient is not interpreted. It is because; the [1] also identifies non-monotonic relationships between the variables [7,26].
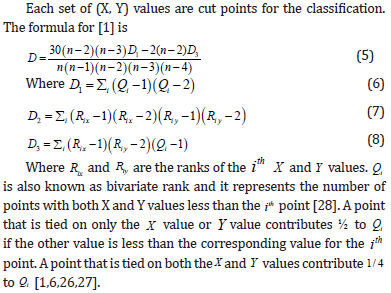
Percentage Bend Correlation Coefficient
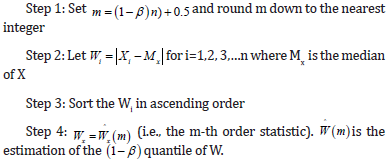
The percentage bend correlation (ρpb) is a robust alternative to Pearson’s correlation [28]. Estimator of this correlation is both resistant and robust of efficiency. Although when the underlying data are bivariate normal, ρpb gives essentially the same values as Pearson’s correlation, but it is more robust in slightly changes in data that Pearson’s correlation. The ρpb belongs to class of correlation measures which protect against marginal distribution (X and Y) outliers. Therefore, this correlation is like [1,2] biweight midcovariance correlation. The percentage bend correlation between variables X and Y is computed as following computational steps given below:
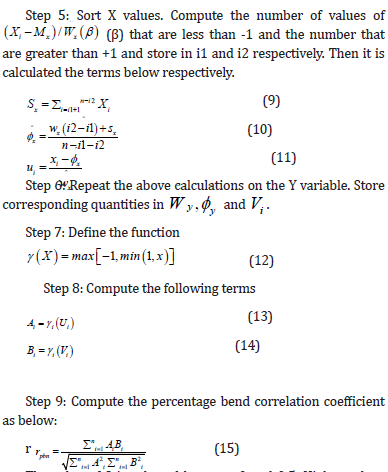
The value of β is selected between 0 and 0.5. Higher values of β result in a higher breakdown point at the expense of lower efficiency [6,29-31].
Types of Relations
Basically, three different types of relations namely linear, non-linear, and monotonic can be existing between the variables. In some cases, it is also possible to meet the situations where there is no relationship between the variables. Although almost all scientists and researchers in all branches of sciences (except for statisticians) are aware of linear and nonlinear relationships in general, minority of them have enough knowledge about the similarities / dissimilarities among the monotonic, linear, and nonlinear relations. Therefore, in this study, it has basically been focused on monotonic relations alongside linear and non-linear relations.
Linear Relations
Linear relationship term is used for describing a straight-line relationship between two variables. When both variables increase or decrease concurrently and at a constant rate, a positive linear relationship exists while one variable increases the other one decreases, a negative linear relationship exists [32,33].
Non-Linear Relations
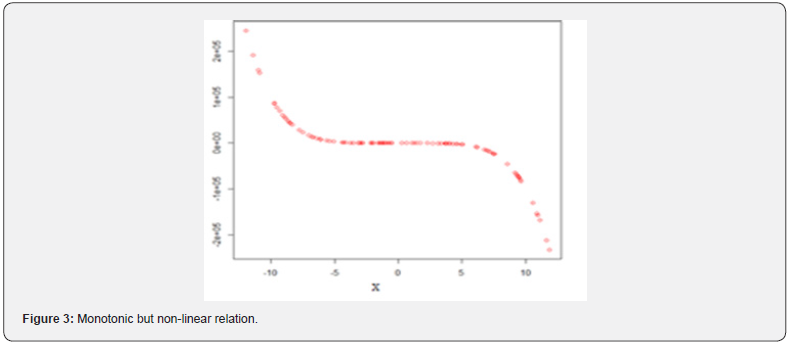
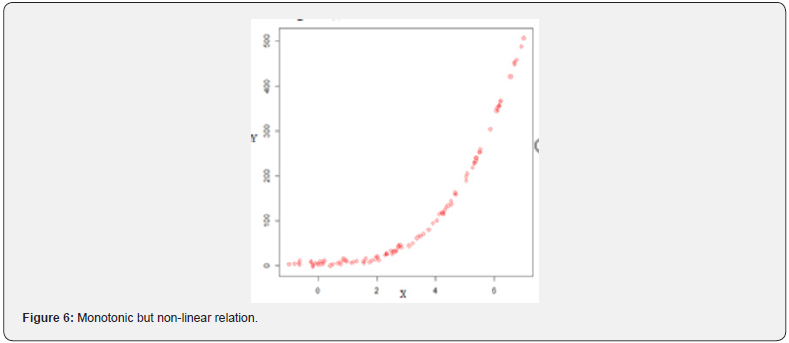
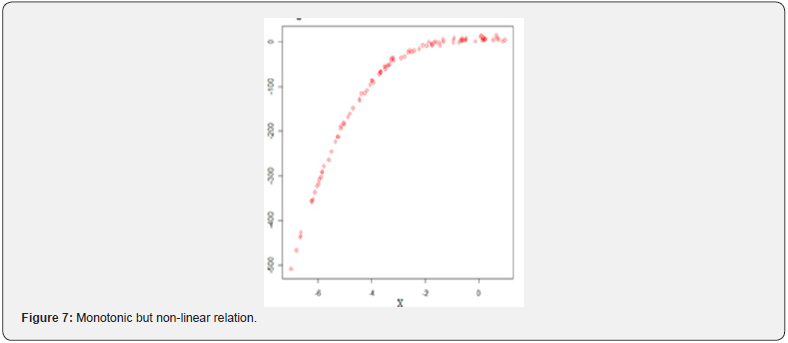
If the relationship between two variables is not linear, in this case, the rate of increase or decrease can vary as one variable changes [33]. And this situation causes a curved pattern in the data set (Figures 2,3,6-9). In such cases, since the relation is not linear, this curved pattern might be better modeled by a nonlinear function.
Monotonic Relations
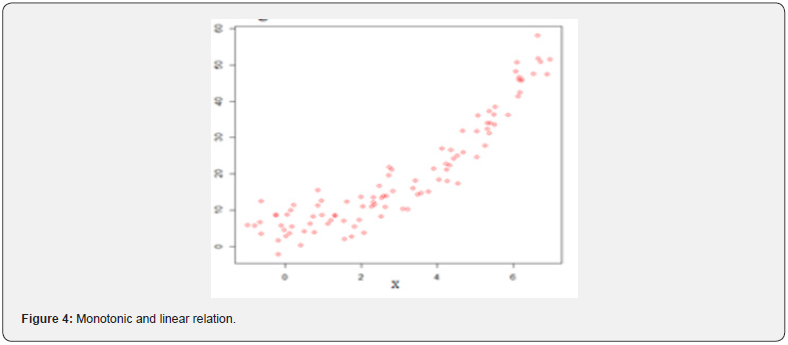
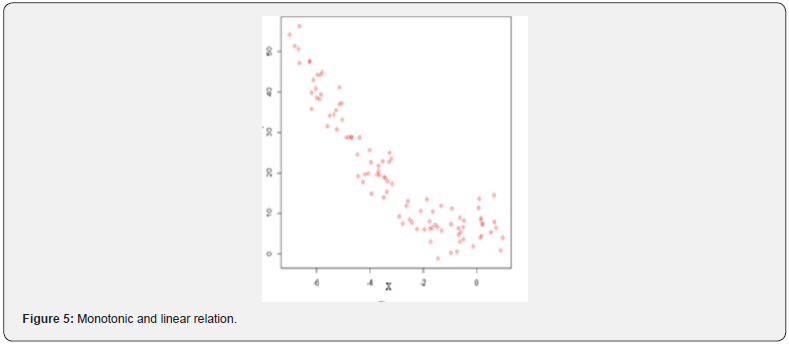
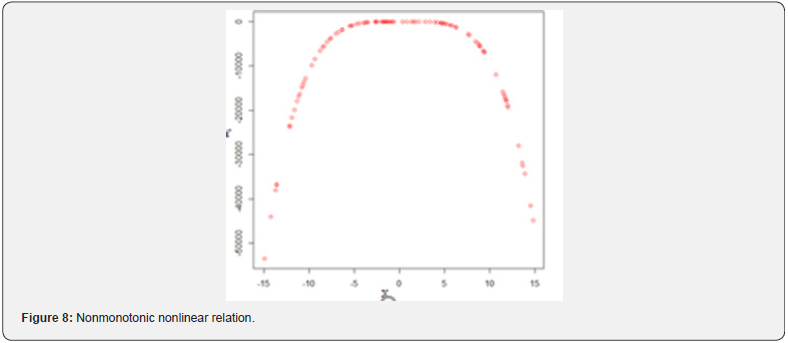
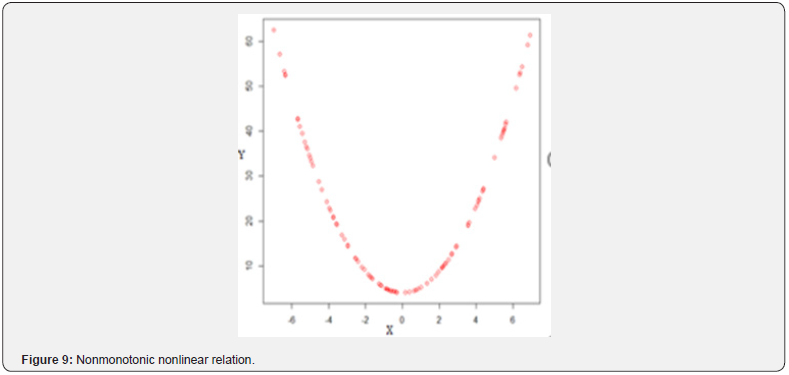
A monotonic relationship indicates that as one variable increases the other one also increases or as one variable increases the other one decrease [34]. However, this increase or decrease does not necessary to be at the same rate. Therefore, a monotonic relationship can be linear such that the rate of increase or decreases of both variables is the same. For instance, types of the relations in the (Figures 4,5) are good examples for monotonic and linear relations. Basic difference between monotonic and linear relationships is that in a monotonic relationship, the variables tend to move in the same relative direction, but not necessarily at a constant rate. In a linear relationship, the variables move in the same direction at a constant rate. A monotonic relationship can also be non-linear with an increase or decrease occurring at different rates between the two variables [35]. For example, types of the relations in the (Figures 2,3,6,7) show both variables increasing / decreasing concurrently, but not at the same rate. Therefore, this relationship is monotonic, but not linear. An example can be given to explain this situation better. For instance, a drug may not be effective for a few days at the beginning of the treatment, but it may start to show its effect after a certain point. This is an example for nonlinear monotonic relationship. However, nonlinear relationships can also be non-monotonic. For example, a drug may become progressively more helpful for first two or three weeks, but then it may become harmful to the patients. Therefore, as shown in the (Figures 1,4,5) linear relations are monotonic, but as shown in the (Figures 2,3,6,7) not all monotone relationships are linear. There are two types of monotonic relations as positive (Figure 4) and negative (Figure 5) monotonic. When the value of one variable increases, the value of the other variable tends to increase as well, in this case a positive monotonic relation exists (Figure 4). There will be a negative monotonic relation if the value of one variable increases, the value of the other variable tends to decrease (Figure 5). If two variables don’t generally vary in the same direction, in this case there will be a non-monotonic relationship (Figures 8 & 9). Therefore, in non-monotonic relations, as X increases, Y sometimes increases and sometimes decreases.
Why apply monotonicity in the model?
Since, in real life, many scenarios show a monotonic relationship, it is an important issue to understand and aware of similarities and dissimilarities between monotonic, linear, and nonlinear relations. If such relationships are ignored, it is possible to make very strange decision. Because any process in nature or in our lifespan is a composition of monotonic functions. For example, changes in our weight, height, money etc to time show monotonic pattern. Therefore, these kinds of characteristics are monotonic functions of time.

How to check and quantify linearity, non-linearity, and monocity
Different correlation coefficients such as Pearson’s moment, Spearman’s rho, Kendall’s tau, Distance, Percentage-Bend, Hoeffding’s D, Maximal Correlation, Maximal Information Coefficient, and Mutual Information can be used in evaluating the relationships between two variables based on the types of relationships between the variables [8]. As it is well known that the Pearson’s correlation is a measure of linear relationship between two interval scaled variables. However, the relationship between variables is not always linear. In many cases, the relationship is nonlinear or monotonic. Monotonic relationships can be both linear and non-linear. Therefore, it is needed a correlation coefficient which enables us to evaluate both linear and nonlinear relations. In this simulation study, it has mainly been focused on monotonic relations and it has been emphasized which correlation coefficient can be used in revealing monotonic relationships reliably.
Discussion and Conclusions
IIn this study, random numbers were generated for 10 different types of relationships and six different correlation coefficients were applied to these data sets. The results have been presented in Table 1. When table 1 is examined, it has easily seen that except for the Distance and [1] none of the correlation coefficient recognized non-monotonic relations (Sc8 and Sc9) (Figures 8 & 9). Interestingly, all correlation coefficients have recognized non-linear monotonic relations (Sc2, Sc3, sc6, and Sc7) (Figures 2,3,6,7) with strongly in general. However, the Spearman’s rho seems to be the best one for these conditions. As is expected the Pearson’s r is the strongest correlation in recognizing linear relations and it is followed by Percentage-Bend and Distance correlations. The Spearman’s rho and Kendall’s tau recognized linear relations sufficiently as well. In terms of recognizing linear monotonic relationships (Sc4 and Sc5) (Figures 4 & 5) the spearman’s rho is the strongest correlation and followed by the Percentage-Bend and Pearson’s r correlations. It is possible to conclude that the results for the Distance and Kendall’s tau correlations are acceptable as well. The Hoeffding’s D measure, on the other hand, has not recognized the linear monotonic relation as satisfactory. In cases where there is no relationship between the variables, all correlations have given very satisfactory results. This means that no matter which correlation coefficient is used in these conditions, it can truly recognize that there is no relationship between two variables (Table 1).

Discussio
Investigating the association between two or more variables is often of interest in practice by many researchers. For this purpose, different association measures or correlation coefficients have been developed. However, type of the relation between the variables affects the correlation coefficient which will be used to investigate the degree of the relationship. At this point, knowing what kind of relationship exists between the variables is very important when evaluating relationship between two variables. It is because, although linear relationships are very common, the relationship between the variables can also be non-linear and monotonic. Therefore, before computing correlation between the variables, it is necessary to determine what kind of relationship(s) exists between the variables. For this purpose, creating a scatter plot to visualize the relationship between the variables is always a good idea. Because performing all raw data as scatter plot helps to give visual information about the type and direction of relationship exists between the variables.
The results of this study which was carried out by considering these issues suggested that if a positive or a negative monotonic relation existed between the variables the Spearman’s rho, Pearson’s r, and Percentage-Bend correlations can be effectively used in determining degree of the relationship. However, if a nonlinear or curvilinear, but monotonic relationship exists between the variables, in this case, the Spearman’s rho indicated a stronger relationship than the [2], Percentage-Bend, Distance, and [1]. Therefore, these results can be accepted as an indicator that the Spearman’s rho correlation might be very useful especially when there is a nonlinear monotonic relationship between the variables. On the other hand, if there is a curvilinear, but non-monotonic relationship between the variables, the values of all correlation coefficients except for the Distance and [1] have found to be zero. Based on these findings, it is possible to conclude that the use of the Distance and the Hoeffding’s D is more appropriate than the other coefficients in cases where there are non-monotonic relationships. Therefore, if there is a curvilinear but non-monotonic relationship between the variables, the Distance and [1] correlations should be preferred in investigating the degree of relationship between the variables. In other words, for such cases, the usage of the Spearman’s, Pearson’s, Kendall’s tau, and Percentage-Bend correlations will not be good choice in investigating the degree of the relationship between two variables. If a general evaluation is made in fact the Spearman’s rho correlation was designed for the purpose of measuring how monotonic the relationship is. That is why, it is widely performed in order to determine how strong of a monotonic relationship exists between the variables and in what direction this relationship is. Although the Spearman’s rho is one the most used alternatives to the Pearson’s r correlation, it basically determines the strength and direction of the monotonic relationship between two variables rather than the strength and direction of the linear relationship between the variables. That is, if the scatter plot shows the relationship between the variables looks monotonic, in this case, performing the the Spearman’s rho correlation will be good choice because this will measure the strength and direction of the monotonic relationship. However, if the scatter plot shows the linear relationship between the variables, in this case, performing the Pearson’s r correlation will be good choice because this will measure the strength and direction of the linear relationship.
On the other hand, the Percentage-Bend and Distance correlations can also be performed efficiently for such cases.
However, since it is not always possible to be able to visually check whether there is a monotonic relationship between the variables; the Spearman’s rho correlation might be performed anyway for such cases. Very low values (close to 0) of Spearman’s Rho, Kendall’s tau, Pearson’s r, and Percentage-Bend correlations and very high values (close to 1) of [1] and Distance correlations will be one of the indicators that the relationship between the variable is non-monotonic. The fact that all correlation coefficients have very low values will indicate that there is a random relationship between the variables. In this case, it is understood that there is no linear, monotonic or non-monotonic relationship between the variables. [10] in his simulation study he compared performances of several different measures of dependence, including Pearson’s and Spearman’s correlation coefficients, and the distance correlation and he reported that both Pearson’s and Spearman’s correlation coefficients can be used to recognize non-monotonic dependence also when it is non-linear, but they do not find non-monotonic dependence if it is symmetric. He also reported that for monotonic types of dependence, Pearson’s correlation coefficient is the most powerful measure of dependence, regardless of the number of observations. In case of non-monotonic relationship and n<50, the distance correlation will be a good choice for measuring the dependence. Although the findings of our study are generally consistent with the findings of Rizzio’s study, it was also noticed that there were some differences between the two studies due to the differences in the experimental conditions.
Conclusion
It is possible to reach following conclusions based on results of this simulation study. Although Pearson’s r was developed for measuring linear relation between two variables, the usage of it might also be possible for all kinds of monotonic relations. Spearman’s rho is one of the well-known nonparametric alternatives to the Pearson’s correlation coefficient. But this coefficient suits better especially when the variables are not normally distributed or the relationship is non-linear, but monotonic. That is why; this correlation coefficient is one of the commonly used coefficients for measuring the monotonic relations. On the other hand, it has been observed that neither Pearson’s nor Spearman’s correlation coefficient is appropriate for non-monotonic relations. If the relationship between two variables is monotonic, but non-linear (nonlinear monotonic relationship), Spearman’s rho is the strongest one. However, especially the Percentage-Bend, Pearson’s r, and Distance correlations might also be used for measuring the degree of the relation. Kendall’s tau and [1] correlations might also be used after those correlations. If our data sets have non-monotonic or nonlinear relationships (i.e., if we have U or ∩-shape distribution in the scatter plots), in this case, since the Pearson’s r, Spearman’s rho, Percentage-Bend, and Kendall’s tau cannot recognize these kinds of relations. However, the Distance and the Hoeffding’s D measure can recognize these types of relations. Since the [1] measure is a little better than the Distance correlation, using the [1] measure will be the best choice for such cases. All findings show that a strong dependence measure or correlation coefficient is needed that might be able to use to measure degree of the relation between two variables regardless of the type of relationship. It is obvious that theoretical and comprehensive simulation studies are needed for this.
References
<- Fujita A, Sato JR, Demasi MAA, Sogayar MC, Ferreira CE, et al. (2009) Measure for gene expression association analysis. J Bioinformatics Computational Bio 7(4): 663-684.
- Knight WE (1966) A Computer Method for Calculating Kendall’s Tau with Ungrouped Data. J Ame Statistical Asso 61: 436-439.
- Carrol JB (1961) The natüre of the data or how to choose a correlation coefficient. Psycho 26: 347-372.
- Chen PY, Popovich PM (2002) Correlation: Parametric and Nonparametric Measures. Series: Quantitative Applications in the Social Sciences Sage Publications Inc California USA.
- Tuğran E, Kocak M, Mirtagioğlu H, Yiğit S, Mendes M (2015) A simulation-based comparison of correlation coefficients with regard to type I error rate and power. J Data Analysis Info Processing 3(03): 87-101.
- Temizhan E, Mirtagioğlu H, Mendeş M (2022) Which Correlation Coefficient Should Be Used for Investigating Relations between Quantitative Variables? Ame Academic Scienti Res J EngTechno Sci 85(1): 265-277.
- Santos de Siqueira S, Takahashi DY, Nakata A, Fujita A (2014) A comparative study of statistical methods used to identify dependencies between gene expression signals. Brief in Bioinfor 15(6): 906-918.
- Reshef DN, Reshef YA, Sabeti PC (2018) An empirical study of the maximal and total information coefficients and leading measures of dependence. Ann Applied Statistics 12(1): 123-155.
- Mendeş M (2019) Statistical Methods and Experimental Design. First Edition Kriter Pub İstanbul Tü (in Turkish).
- Rainio O (2021) Different coefficients for studying dependence. arXiv:2110.07928 [stat.ME]. [2110.07928] Different coefficients for studying dependence.
- R Studio (1.2.5033) RStudio Version 1.2.5033 - © 2009-2020 RStudio Inc.
- R (4.0.2). R version 4.0.2 (2020-06-22) “Taking Off Again" Copyright (C). The R Foundation for Statistical Computing Platform: x86_64-w64-mingw32/x64 (64-bit).2020.
- Zar J H (1999) Biostatistical Analysis. Fourth Edition. Simon & Schuster A Viacom Co New Jersey USA.
- Fieller EC, Hartley HO, Pearson ES (1957) Tests for rank correlation coefficients. Biometrika 44(3/4): 470-481.
- Bishara AJ, Hittner JB (2012) Testing the Significance of a Correlation with Nonnormal Data: Comparison of Pearson, Spearman, Transformation, and Resampling Approaches. Psycholo Methods 17(3): 399-417.
- Zar JH (2014) Spearman Rank Correlation: Overview. Wiley StatsRef: Statistics Reference Online.
- Bishara AJ, Hittner JB (2017) Confidence intervals for correlations when data are not normal. Behav Res Methods 49(1): 294-309.
- Kendall M, Gibbons JD (1990) Rank Correlation Methods. 5th Edition, Edward Arnold, London.
- Liebetrau AM (1976) Measures of Association. Sage Publications, Beverly Hills and London, UK.
- Gibbons JD (1993) Nonparametric Measures of Association. Sage Publications Newbury, CA, USA.
- Sheskin D (2011) Handbook of Parametric and Nonparametric Statistical Procedure. (5th ed.) Boca Raton, FL, USA.
- Székely GJ, Rizzo ML, Bakirov NK (2007) Measuring and testing dependence by correlation of distances. Ann Statistics 35(6): 2769-2794.
- Sejdinovic D, Sriperumbudur B, Gretton A, Fukumizu K (2013) Equivalence of distance based and RKHS statistics in hypothesis testing. Ann Statistics 41(5): 2263-2291.
- Dueck J. Edelmann D, Gneiting T, Richards D (2014) The affinely invariant distance correlation. Bernoulli 20(4): 2305-2330.
- Bhattacharjee A (2014) Distance Correlation Coefficient: An Application with Bayesian Approach in Clinical Data Analysis. J Modern Applied Statistical Methods 13(1): 354-366.
- Hoeffding W (1948) A Non-Parametric Test of Independence. Annals of Mathematical Statistics. 19(4): 546-557.
- Hollander M, Wolfe D (1973) Nonparametric Statistical Methods. John Wiley & Sons, New York, USA.
- Wilcox RR (1994) The percentage bend correlation coefficient. Psychometrika 59: 601-616.
- Mosteller F, Tukey J (1977) Data Analysis and Regression: A Second Course in Statistics. Addison-Wesley.
- Shoemaker LH, Hettmansperger TP (1982) Robust Estimates of and Tests for the One- and Two-Sample Scale Models. Biometrika 69(1): 47-54.
- Wilcox RR (1997) Introduction to Robust Estimation and Hypothesis Testing. Academic Press.
- Statkat (2021) Monotonic Relationships.
- Minitab Express Support. Linear, nonlinear, and monotonic relationships.
- Community Blog. What is a Monotonic Relationship?2020.
- Yitzhaki S, Schectman E (2012) Identifying monotonic and non-monotonic relationships. Economics Letters 116(1): 23-25.


