


A Systematic Comparison of Methods Designed for Association Analysis with Multi-Omics Data
Xiaqiong Wang* and Yalu Wen*
Department of Statistics, University of Auckland, New Zealand
Submission: June 21, 2020; Published: August 25, 2020
*Corresponding author: Xiaqiong Wang and Yalu Wen, Department of Statistics, University of Auckland, Auckland 1010, New Zealand
How to cite this article: Xiaqiong W, Yalu W. A Systematic Comparison of Methods Designed for Association Analysis with Multi-Omics Data. Biostat Biom Open Access J. 2020; 10(2): 555783.DOI:10.19080/BBOAJ.2020.10.555783
Abstract
With high-throughput biotechnologies, emerging multi-omics data have provided unprecedented opportunities for detecting new disease-associated biomarkers. A commonly used strategy for such an analysis is to form various sub-hypotheses based on each omics data and their combinations, and then integrate them. Existing methods designed for combining correlated results can be adapted for these association tests. However, there lack systematic comparisons of their performance when applied to multi-omics data. In this study, we conducted extensive simulation studies to evaluate the impacts of 1) inter-correlation among multi-omics data; 2) interaction effects within and between different layers of omics data; and 3) the underlying disease model on the performance of five selected methods, including the Kost and McDermott method, the Omnibus-Fisher method, the truncated product method (TPM), the harmonic mean P-value (HMP) method and the minimum P-value method.
We found that the minimum P-value and the HMP methods perform better than the other three methods, especially when interaction effects are of interest. The Fisher-types of statistics are most sensitive to the number of sub-hypotheses and the correlations among omics data. They can achieve the best performance when all the omics data are associated with the outcome but perform the worst when only a small fraction of the sub-hypotheses are significant. The TPM achieves sub-optimal performance when the truncation point is fixed. For practical applications, we recommend using the HMP and the minimum P-value methods for association analyses with multi-omics data, especially when interaction effects are of interest.
Keywords: Mathematic educational; Fundamental revolution
Introduction
Recent advances in multi-omics data (e.g., genomics, transcriptomics and epigenomics) generation and collection present us with unprecedented opportunities for identifying new disease-associated biomarkers. Each type of omics data investigates disease etiology from a different perspective, and thus provides both confirmatory and complementary information. Traditionally, multi-omics data were analyzed separately, and only partial information from each data type was used. This can lead to several issues, such as missing heritability [1] and poor reproducibility [2]. Integrative analysis of multi-omics data has the potential to make full use of their information and provides a more holistic perspective of disease etiology. While multi-omics data can be used to address various research questions (e.g., discovering molecular mechanisms, classifying samples [3] and predicting disease outcomes [4]) and a comprehensive review of their analytical methods can be found in [4-6], here we mainly focus on those methods that are designed for association studies, where research interest lies in detecting new disease-associated biomarkers.
Existing integrative methods for association analyses can be broadly categorized into two groups. The former is to first combine multi-omics data and then test their joint effects on the disease outcome based on the integrated data [7-9]. For example, the widely-used kernel machine regression models build a composite kernel matrix using all layers of omics data, based on which association test is further performed [7]. These methods intend to boost the power of association test by capturing the complex inter/intra-relationships among multi-omics data through various integration techniques. However, their degree of successes highly depends on the adopted data-integration procedure, which by itself is a very challenging problem mainly due to the unknown disease mechanisms and complex relationships among omics data. Furthermore, they have sub-optimal performance if the signal is sparse (e.g., only one omic is associated with the outcome). A recent emerging approach is to treat the association test as a multiple hypothesis testing problem, where results from the analysis of each layer of omics data and their combinations are integrated [10,11]. For example, Yan et al. [10] developed the Omnibus-Fisher method, where hypothesis tests were performed for each layer of omics data and individual P-values were combined into an overall P-value based on a Fisher-type of statistic. Zhao et al. [7] extended the minimum P-value method, where the test statistics was defined as the minimum of P-values that were calculated from different combinations of omics data. While these methods are less affected by the data integration step, their power can be influenced by how dense the signals are. Indeed, these methods can all be viewed as extensions of those that are designed for optimally combining correlated P-values. It has been shown that if the number of omics data and/or their interactions that are related to the outcome is in a very small proportions (i.e., at the level of L(−α) with α∈(3/4,1)and being the number of tests), then the minimal P-value method is optimal. However, if the signals are denser (e.g., α∈(1/2,3/4)), then the Fisher-type of statistics should be used instead [12,13].
Meta-analysis methods that combine multiple P-values into a single unified P-value are commonly employed to improve the precision of hypothesis testing [14-16]. They have been used for association test with multi-omics data) [10,11,17], where a natural and common question is whether the combined evidence from all layers of omics data supports a particular hypothesis. These methods have shown improved power and are promising for multi-omics data analysis. However, their test statistics are usually monotonic in P-values and thus optimal under certain conditions. It is not clear whether they can achieve optimal performance for association analysis with multi-omics data, making it hard to determine their suitability for a multi-omics application at hand. The goal of this paper, therefore, is to make comparisons of the existing meta-analysis methods and to provide practical recommendations regarding their use for association analysis with multi-omics data. In the following sections, we first give a brief overview of the existing methods designed for combining correlated results, and then conduct extensive simulation studies to evaluate their performances for multi-omics data analysis. Finally, we provide a practical recommendation and future directions for association analysis with multi-omics data.
Statistical Methods for Combining Multiple Correlated P-values
The research interest for association analysis with multi-layer omics data lies in whether any layers and their combinations are associated with the disease outcome. A commonly used ’meta-analysis’ approach is to first form a total of L sub-hypotheses (i.e.,H={H1,H2,...,HL}) with each representing the association between the outcome and a specific layer of omics data (or their specific combinations). The P-values for each sub-hypothesis are derived (i.e.,p={p1,p2,...,pL}), and then the overall significance is assessed using methods designed for combining correlated P-values. For example, for multi-omics data that contains genotypes and methylation levels, Zhao et al. [7] proposed to first calculated P-values for three sub-hypotheses (i.e., whether disease is related to a) genotypes, b) methylation, and c) both of them), and then used the minimum P-value method to assess the overall significance. It is apparent that methods used to assess each sub-hypothesis can have a major impact on the overall power. Therefore, for a fair comparison of the existing methods that are designed for combining correlated P-values, we adopted the widely-used kernel machine regression models for each sub-hypothesis testing [18,19]. Interested readers can find other methods for single-layer omics data association analysis in [20,21].
Many existing methods for combining correlated P-values were motivated by the seminal work done by Fisher [22], where the test statistic 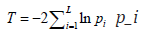 follows a
  distribution under the null hypothesis and p_i is independent of each other. To allow dependencies among P-values, they extended the Fisher’s method by re-scaling
  and mostly followed the Satterthwaite’s procedure that equates the first two moments of the unknown distribution to that of a 2x distribution. It is straightforward to show that
 and
and  for these re-scaling methods, where
  and
and 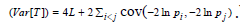 .While using the same re-scaling procedure, the existing Fisher-based methods mainly differ in the way of estimating the covariance between nilp and lnjp. For example, the Brown’s method [23] assumes that P-values were obtained from test statistics that follow a multivariate normal distribution with a known covariance matrix. Gaussian quadrature is used to evaluate and tabulate the covariances between lnjpand lnjp which are further approximated by the following function:
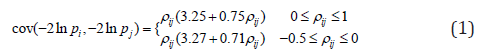
where  and φis the cumulative distribution function of the standard normal.
Kost and McDermott (Kost and McDermott 2002) [24] extended the Brown’s method, where they derived the analytical solution when test statistics are assumed to follow a multivariate normal distribution with both known and unknown covariance matrix. Similar to the Brown’s method, the computation of cov(-2lnpi,-2lnpj) also requires numeric integration that is computationally intensive. Therefore, Kost and McDermott developed a third-order polynomial function to approximate the covariance between 2lnip− and 2lnjp−and their method performed better than equation (1) developed by Brown (Alves and Yu 2014) [25]. For example, under the same assumption used in the Brown’s method, Kost and McDermott calculated the covariance as 3cov(-2lnpi,-2lnpj)≈3.263pij+0.710pij where the difference between the approximation and the exact value is no more than 0.0002 [25].
While parametric approximations for cov(-2lnpi,-2lnpj) work reasonably well on low-noise normal data, their performance can be affected if there is high level of noise in the data. Recently, efforts are made to estimate the covariance directly from the data. For example, the empirical Brown’s method first transforms the raw data based on their empirical cumulative distribution function and then calculates the covariance based on its definition [17]. Yan et al. developed the Omnibus-Fisher method where cov(-2lnpi,-2lnpj) is estimated empirically via perturbations [10].
In the formulation of the Fisher’s statistic, it is assumed that all tests to be combined are equally important [22]. However, there are many situations where evidence should be weighted differently [26,27]. For example, Whitlock [26] has demonstrated that the weighted Z-method can perform better than their unweighted counterpart when the sample sizes or the accuracies of each study differ. Similarly, Hou showed that the weighted Fisher’s statistics  have better performance when weights reflect the underlying contributions of each study [26]. Intuitively, it is logical to weight the contributions from each omics data differently, as evidence for association from different layers of omics data can differ substantially and some layers of omics data are subject to more noise as compared to the others. However, it is not straightforward to apply these generic methods for omics data analyses. For example, Hou’s method [26] is useful for cases where weights can be easily determined from the study design, but its application is limited for multi-omics data analysis as prior evidence is often lack to accurately pre-specify the weights. In addition, it is usually the case where only a small subset of those L hypotheses are false for multi-omics data. To account for these issues, Zaykin et al. [16] developed the truncated product method (TPM), which restricts the analysis to the tail of the P-value distribution. Instead of testing whether the tests contain any evidence against the null, they only focused on the tests with small P-values and asked whether any of them are indeed significant. The test statistic is formed as
  where τ is a pre-specified value used to determine whether the P-value for the ith sub-hypothesis should be considered small. Indeed, TPM only focuses on the isp that do not exceed the truncation point τ. Using the idea in Wilkinson’s truncation method [27], Zaykin et al. [16] showed the tail probability of the test statistics when all P-values are independent:

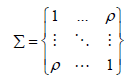
To account for dependencies among P-values, similar to the Brown’s method, they assume the test statistics from sub-hypotheses jointly follow a multivariate normal distribution. They transform the correlated P into an un-correlated P* by using 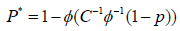 , where Σ=CC′and Σ is a non-degenerate correlation matrix for P. The tail probability of the test statistic is evaluated based on P* using equation (2). The selection of truncation point can be quiet arbitrary. Sheng and Yang [29] proposed an adaptive TPM to facilitate its selection. They evaluated the test statistics in the TPM over a range of truncation points
  and defined their test statistics as the one that gives the smallest P-value
  . Permutation-based method is used to assess the tail probability of T.
TPM can be sensitive to the sample size and the number of sub-hypotheses, and thus Dudbridge and Koeleman proposed a ranked TPM in which the sample size has little impact on the choice of truncation points [30]. Rather than selecting τ Dudbridge and Koeleman proposed a complementary strategy and formed their test statistics based on the most significant P-values  , where K is chosen to reflect a hypothesized disease model and is independent of sample size. The test statistics has the exact distribution as

To facilitate the selection of K, Dudbridge & Koeleman [31] proposed an adaptive rank TPM, which follows similar steps as those used in the adaptive TPM [28].
Compared to the Fisher-type of statistics and their weighted counterparts, these TPM-based methods focus on a set of significant sub-hypotheses, and thus have the potential to increase the overall power of the test if the signal is sparse. However, for association studies with multi-omics data, the signals can be extremely sparse, especially when associations between the disease outcome and the interactions within and among layers of omics data are also treated as sub-hypotheses. Considering the interactions within and between layers of omics data, on one hand, could increase the chance of detecting disease-associated biomakers. On the other hand, it may decrease the power of the overall test if only additive effects are present. As most of the disease mechanisms are unknown in advance, and the minimum P-value method that explicitly considers various combinations of data to form sub-hypotheses has been often used for multi-omics data analysis. Rather than considering a set of significant sub-hypotheses, the minimum P-value method only focuses on the most significant result. It defines its test statistic as  and evaluates the tail probability through the perturbation. As shown by Tippett [32], the minimal P-value method is optimal when the proportion of significant sub-hypotheses is at the level of L−α with α∈(3/4,1). For association analysis with multi-omics data, the minimum P-value method could be most powerful, especially when the number of sub-hypotheses considered is large.
While most of the existing methods can be viewed as a generalization of the Fisher’s method, where the first two moments of the uncharacterized distributions are matched to that of a X2 distribution, other ideas are also explored in the field [33-35]. For example, using a similar idea in Stouffer’s method [33], Lipták [34] developed the inverse normal method and Hedges and Olkin [35] further proposed a generalized inverse normal method to consider the case of dependent P-values. The analytical form of the tail probability is derived, which is further approximated by the standard normal distribution. Recently, Wilson [11]
viewed the problem of combining evidence from the perspective of Bayesian model averaging and developed the harmonic mean P-values (HMP) method. The maximum likelihood ratio for the ith sub-hypothesis defined in equation (3) is a classical analogue of the Bayes factor, and it measures the evidence for the alternative hypothesis Hi1 the null Hi0 the corresponding data (denoted by X_i).
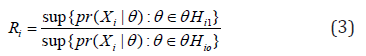
Under the null hypothesis, iRcan be approximated by a LogGamma distribution (1,1)αβ== to the Wilks’ theorem [36], and thus the P-value for the th sub-hypothesis can be calculated as  . Using this rationale, Wilson [11] defined his test statistic based on the average of maximum likelihood ratios,
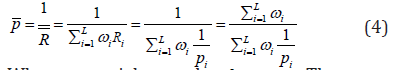
Where iωweights and  . The generalized central limit theorem is used to approximate the distribution of R under the assumptions that all weights are equal
  and Ri are independent and identically distributed. Wilson [11] further showed that these assumptions can be relaxed, and his proposed HMP method can also be used to combine dependent P-values.
Simulation Studies
While most of the existing methods designed for combining correlated P-values have the potential to be adapted for association analysis of multi-omics data, we focused on five widely-used methods, including the Kost & McDermott method [24], the Omnibus-Fisher method [10], the TPM [16], the HMP method [11] and the minimum P-value method [32]. The chosen methods cover a range of existing test statistics. For example, Kost, Omnibus-Fisher and TPM methods can all be viewed as an extension of the Fisher-type of statistics, whereas the test statistics for HMP and minimum P-value methods are based on Bayes factor and order statistics, respectively. The selected methods also allow for a systematic comparison when the signals in multi-omics data vary. For example, Kost, Omnibus-Fisher and HMP methods make use of all sub-hypotheses, whereas TPM and the minimum P-value methods only focus on a set of the most significant sub-hypotheses. While TPM uses a pre-specified truncation point to determine the subset, the minimum P-value method only focuses on one sub-hypothesis that is the most significant. Our selected methods also enable the investigation of the impact of dependencies among sub-hypotheses. While it is well accepted that there are complex inter/intra relationship among multi-omics data and their effects on disease outcomes are not independent of each other, there lack thorough explorations for the impact of correlation estimation on the overall power of the test. These selected methods allow for the investigation of a series of situations, including 1) the explicit estimation of correlations among P-values using parametric form (i.e., the Kost) as well as empirically (i.e., the Omnibus-Fisher method) and 2) the derivation of an overall test statistics without estimating cov(-2lnpi,-2lnpj) (i.e., the HMP and minimum P-value methods).
We conducted extensive simulations to investigate the performance of these selected methods under various scenarios. We started by evaluating the impact of inter-correlation among multi-omics data, followed by assessing the impact of interactions, and finally gauged the impact of disease model on the performance of each method. We conducted 10,000 Monte Carlo simulations under each setting to calculate the type I error and 2,000 Monte Carlo simulations to calculate empirical power for each method.
Scenario I: The Impact of Inter-correlation among Multi-omics Data
For simplicity and without loss of generality, we only considered two-layer omics data that include genotypes and methylation levels. Following a similar idea used in [7], 50 variants were generated from a multivariate normal distribution with mean and variance,
We randomly selected variables to represent genetic data, which were further categorized into 0, 1, and 2 by comparing the values to their 36th and 84th percentiles. The remaining variables were treated as the methylation data. The parameter ρrepresents correlation between genetic and methylation data and was gradually increased from 0 to 0.5. We simulated the outcome as,

where Xi~N(0,1) demographic variables (e.g., age) and ∈ i~N(0,1). Gij and Mil respectively denote the genotype of the jth variant and the methylation level of lth CpG site for individual i. JG and JM sets of causal variables for genetic and methylation data, respectively. Here, we randomly selected 3 genetic variants and 2 CpG markers and set them to be causal. To evaluate the type I error, we set βs=βm=0, and thus disease outcomes are only affected by the demographic variable. To evaluate the empirical power, we considered three scenarios, including 1) only one layer of omics data has effect (i.e., genotype only effect βm=0,βs=0.08 methylation only effect: βs=0,βm=0.08, 2) both methylation and genotype data have effects that are in the same direction (i.e., βs=0,βm=0.05). 3) both layers have effect but on different directions (i.e.,βm=-βs=0.05) We analyzed the simulated data using the five selected methods and reported the type I errors and empirical power under each setting. We further reported the type I errors and power from single-layer association analyses (denoted as Genotype and Methylation), where the significance level was set at 5% and no adjustments have been made to account for multiple comparisons (Table 1).

The type I errors are summarized in Table 1. Regardless of the levels of correlations between genetic and methylation data, all the methods control their type I error reasonably well at the 5% level, although TPM tends to be slightly conservative. When the effects of methylation and genetic data are on different directions (i.e.,βs= -βm=0.05) the power for all methods decreases first and then slightly increases (Figure 1A and Appendix Figure S1A). With regards to the power, TPM has the lowest power under all the correlations considered. The other methods have similar performance, although the minimum P-value and the HMP methods tend to be slightly better, especially under weak correlations. While results from single-layer and joint analyses are not directly comparable as multiple comparisons have not been adjusted, the power from joint analyses tend to be in between of those from single-layer analyses when the genotypes and methylation levels are not independent.

When the effects are on the same direction, all methods become more powerful as the correlation increases (Figure 1B and Appendix Figure S1B). When both layers of omics data have effects (..,0.05)smieββ== and they are correlated, the Fisher-types of statistics (i.e., Kost and the Omnibus-Fisher methods) perform the best, followed by the HMP and the minimum P-value methods. The TPM has the lowest power. As correlation increases, the differences among all methods except the TPM become negligible. When multi-omics data are independent, TPM has the lowest power while the others achieve a similar level of performance. Compared to the single-layer association analysis, all methods except TPM have better performance, which suggests that the joint analyses should be used when both layers are associated with the outcome.
When only one layer of omics data (i.e., genotypes or methylation levels) is associated with the outcome (Figure 1C-1D and Appendix Figure S1C-1D), the minimum P-value and the HMP methods perform the best under the settings of weak (..,0.1)ieρ= or no (..,0)ieρ= correlations, and the Fisher-types of statistics and TPM have similar levels of performance. While TPM is the least powerful method, the power of all other methods become similar as correlations increase (..,0.30.5)ieρ≤≤. For single-layer association analysis, it achieves the highest power when the outcome-related layer of omics data is used, but its power can be the lowest if the unassociated layer is analyzed instead. This is especially true when the correlation between omics data is weak. In practice, the disease model is unknown in advance, and thus joint analysis that can achieve close-to-the-best performance is preferred for detecting disease-associated markers.
In summary, regardless of the correlations among multi-omics data, the joint analysis on all layers of omics data achieves robust and close-to-the-best performance as compared to the single-layer analysis. The Kost and Omnibus-Fisher methods have the best performance when both layers of omics data have positively correlated effects. When only one layer of omics data has an effect or the effects are on different directions, the minimum P-value and HMP methods tend to have the highest power. Regardless of the disease model and the correlations, TPM performs the worst. As shown in both Figure 1 and Appendix Figure S1, the differences among these methods are more apparent when there is weak or no correlations between omics data. As correlation increases, all methods except TPM have similar levels of power.
Scenario II: The Impact of Interaction Effects
Epistasis and interactions among different layers of omics data widely exist. For example, proteomics that measures all proteins and peptides can provide complementary information for the association analysis with genetic data [37]. On one hand, considering the interaction effects among multi-omics data in the association studies can facilitate the detection of disease-associated biomarkers when interactions present. On the other hand, they can also substantially increase the number of tests, and thus can reduce the power in the absence of interactions as family-wise type I errors need to be controlled. Therefore, we conducted this set of simulations to evaluate the impact of interactions and the corresponding analytical strategies (e.g., consider the main and/or interaction effects within and among omics data) on the performance of these five methods. We used the same strategy as scenario I to generate methylation and genetic data, and simulated the outcome based on the following model,
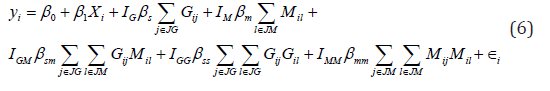
where  is an indicator function representing whether the corresponding effects are present. In total, six disease models including those that have interactions within and between layers of omics data were considered (Appendix Table S1). For completeness, we considered two types of correlations between methylation and genotype data, including independent (i.e.,ρ=0) and weakly correlated effects (i.e.,ρ=0.1). We considered three commonly used analytical strategies, where we modeled A1) only the main effects A2) the main effects and pairwise interactions between genetic and methylation data; and A3) main effects, pairwise interactions within each layer of omics data, and pairwise interactions between genetic and methylation data (details are in Appendix Table S2). The details of effect sizes are summarized in Appendix Table S3.
Figure 2 summarizes the power for each method when omics data are weakly correlated (i.e.,ρ=0.1), and the rest (i.e.,ρ=0) are shown in Appendix Figure S2. Under the main effect only model (i.e., model G+M) the A1) strategy that only considers the main effects is most powerful for all methods, followed by the A2) strategy that considers the main effects and interactions between omics layers. The A3 strategy that considers the main effects and interactions within and between omics layers performs the worst. As expected, modeling interaction effects when they are absent reduces the power of the overall test. However, its impact differs across these five methods. The minimum P-value method that only focuses on the smallest P-value is relatively robust, whereas those (i.e., Kost and Omnibus-Fisher) that equally average information from all sub-hypotheses suffer the most power loss. The methods (i.e., TPM and HMP) that tend to weight evidence from different sub-hypotheses have a middle level of power loss. Regardless of the analytical strategies, the minimum P-value method has the best or close-to-the-best performance in the absence of interactions, followed by the HMP method.
Under the interaction effects only models (i.e models GG+MM, GM and GM+GG+MM), both A2 and A3 strategies are more powerful compared to A1. Indeed, the power of A1 strategy for all five methods is close to the expected type I error rate. For all methods, the analytical strategy that best mimics the underlying disease model has the best performance (Figure 2 and Figure S2), although the differences between A2 and A3 strategies for each method is not substantial except for the case where only within-layer interaction effects are present. Consistent with what we have found from the main effect only model, the number of sub-hypotheses and their significance have the largest impact on the Fisher-types of statistics, and the least influence on the minimum P-value method. In addition, the increase in correlations between omics layers can reduce the impact of the number of sub-hypothesis tests, especially for the Fisher-types of statistics. Given there is an association, the chance of getting more significant sub-hypotheses increases as the correlation between omics data increases, and thus substantially benefit the Fisher-types of statistics as they equally average information across all sub-tests. Nevertheless, the minimum P-value method has the best or close-to-the-best performance under the interaction effects only model, regardless of the analytical strategies and the types of interaction effects considered. The HMP method has the second-best performance.

When both main and interaction effects present (i.e models G+M+ GM and G+M+GG+MM+GM), the strategies that take interaction effects into account (i.e., A2 and A3) have much better performance than those without considering interaction effects (i.e., A1). With A1 strategy, the Fisher-types of statistics tend to perform the best, but the differences among all methods except TPM are small. With regards to the comparisons between A2 and A3 strategies, the strategy that best mimics the underlying disease model has the highest power, although the differences can be very small. Regardless of disease models and analytical strategies, the minimum P-value method tends to have the best power followed by the HMP method, whereas the relative performance of the other three methods depend on the disease model and the chosen strategy.
In summary, the minimum P-value method is the most powerful method for most of the considered disease models and the analytical strategies, followed by the HMP method. While the strategies that best mimic the underlying disease model perform the best, the minimum P-value method under the A3 strategy provides the best or close-to-optimum performance. The Fisher-types of statistics tend to be most sensible to the number of sub-hypotheses and their significant levels, whereas the minimum P-value method is much more robust. Both TPM and HMP that can be considered as test-statistics that weight information from different omics layers have a middle level of robustness, and HMP tends to perform better than TPM.
Scenario III: The Impact of Disease Model
For most complex diseases, not all layers of omics data are associated with the outcome. In this set of simulations, we evaluated its impact on the performance of these five methods by considering various disease models. We simulated 3 layers of multi-omics data, including genetic, methylation and gene expression data. We randomly selected a gene (i.e., gene RB1 located on chromosome 13), and generated its gene expression and methylation data using the InterSIM software that simulates omics data based on realistic correlations derived from the TCGA ovarian cancer study (Chalise, Raghavan, and Fridley 2016) [38]. The genetic data was generated by the HAPGEN2 software, where the CEU samples from the HAPMAP project [39] were set as the reference panel. We generated the outcome as,
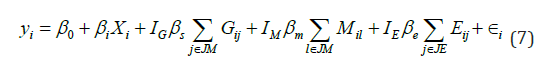
where Xi~N(0,1)and ∈ i~N(0,1). We set the gene expression effect (denoted by βe), genetic effect (denoted by βs), and methylation effect (denoted by βm) to be 0.08. A total of 8 disease models were considered, including disease outcomes were associated with 1) none of the multi-omics data 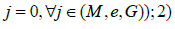 only one layer of omics data IJ=1 and
 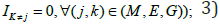 two layers of omics data Ij=Ik=1 and Im where (j,k,m)∈(G,M,E) and
  all of them
  .
.
When none of the omics is associated with the outcome, it is equivalent to the null model and thus type I errors for all five methods can be evaluated. While HMP has a slightly increased type I error (Type I error=0.057), the others control the type I errors reasonably well at the 5% level (Appendix Table S4). As shown in Figure 3, when only single layer of omics data is associated with the outcome (models G, M, and E) the HMP, TPM and the minimum P-value methods perform better than the Omnibus-Fisher and Kost methods. When multiple layers of omics data are associated with outcomes (models G+M, G+E, M+E and G+M+E), the Fisher-based methods (i.e., the Kost and the Omnibus-Fisher methods) are most powerful, followed by the HMP and TPM methods. The minimum P-value method tends to be the worst. As the HMP method has slightly inflated type I error, its power should be interpreted with caution. Nevertheless, as expected, when only a small subset of omics data is associated with the outcome, methods that only focus on the “significant results” tend to be more powerful. However, when the association signals come from multiple layers of omics data, the Fisher-based methods perform better.

Discussion
With the advances in high-throughput biotechnologies, multi-omics data have been collected and jointly analyzed to detect new disease-associated biomarkers. While methods designed for integrating evidence from correlated heterogeneous data sources can be adapted for multi-omics applications (e.g., see (Yan et al. [10] and [7]), there lack systematic comparisons to evaluate them. In this study, we conducted extensive simulation studies to evaluate the impacts of 1) inter-correlation among multi-omics data; 2) interaction effects within and between different layers of omics data; and 3) the underlying disease model on their performance. In summary, we found that the HMP and the minimum P-value methods have better performance than the other three methods, especially when the number of sub-hypotheses is large (e.g., various types of interaction effects are considered). The Fisher-types of statistics are most sensitive to the number of sub-hypotheses and the correlations among omics data. They can achieve the best performance when all the omics data are associated with the outcome, but they can also be the least powerful method when only a small fraction of the sub-hypotheses are significant. Given a fixed truncation point, TPM seldom achieves the highest power among all the simulations considered.
In real-world omics applications where researchers are interested in detecting disease-associated biomarkers, a commonly used approach is to conduct hypothesis tests for each layer of omics data and then combine them to provide the overall assessment. While easy to implement, it is often the case where correlations among P-values derived from each omics data and their combinations are unknown. An intuitive and straightforward approach is to estimate the correlations either empirically [10] or using parametric models [24]. While it is expected that the non-parametric methods are more robust, our analyses suggest that the Omnibus-Fisher and Kost methods perform similarly across a range of correlation levels (Figure S1). Indeed, the Kost method that uses parametric models to estimate the correlations has better performance than the non-parametric counterpart when the correlation is weak. Nevertheless, both the Omnibus-Fisher and Kost methods are based on the Fisher-type of statistics, and thus treat all sub-hypotheses equally. They are sensitive to the proportion of significant sub-hypotheses, especially when correlations between omics data are weak (Figure S1). TPM also requires the estimation of covariance between P-values, and it can be viewed as a variation of the equally weighted methods. It focuses on a subset of hypotheses with P-values less than a pre-specified truncation point τ. While TPM has the potential to reduce the impact of null results from sub-hypotheses, it is sensible to the truncation point. Given a fixed value of τ, TPM performs worst regardless of the correlation levels. A range of truncation points should be attempted for TPM to ensure its optimal performance.
Another approach for combining correlated information is to develop test-statistics that do not explicitly rely on the estimation of correlations. The minimum P-value method that focuses on the most significant sub-hypothesis and derives the empirical distribution via perturbation is within this category. It can achieve the highest power when the signal is sparse and the correlations among P-values are weak. Its performance is sub-optimal when both layers of data have weak but positively correlated effects (Figure S1). This is mainly because the minimum P-value method fails to utilize information from all relevant layers of data and misses the weak signals. However, as the correlation increases, the minimum P-value method has the same level of power as compared to the others (Figure S1). The recently developed HMP method, which defines its test-statistics using the idea of Bayesian average and derives the asymptotic distribution based on the generalized central limit theorem, does not require the estimation of covariance as well. Its test-statistics is mainly driven by the small P-values, especially when the correlations are weak. Therefore, HMP tends to have similar levels of performance as the minimum P-value method under the settings of sparse signal and weak correlations, and it performs better than the Fisher-types of statistics under such settings. However, different from the minimum P-value method that only focuses on the strongest signal, HMP also takes the P-values from other hypotheses into account. Therefore, it has better performance than the minimum P-value method and slightly worse performance than the Fisher-types of statistics when both layers of omics data have weak but positively correlated effects (Figure S1). Converging evidences suggest that epistasis within and between layers of omics data widely exists [40-42]. In our study, we started by considering the scenario where only main effects are associated with the outcome, followed by the scenario where only interaction effects present, and finally evaluated the situation where outcomes are related to both main and interaction effects. When analyzing the data, we considered three commonly used strategies, including only focusing on 1) main effects A1 2) the main effects and pairwise interactions between omics data A2, and 3) the main effects and pairwise interactions within and between omics layers A3. We found that the minimum P-value and HMP methods are much more powerful than the Fisher-based and TPM methods. Consistent with our expectation, the Fisher-types of statistics that average information across all sub-tests suffer the most power loss when the signals are sparse. While the analytical strategy that best mimics the underlying disease model is most powerful for all methods, the minimum P-value and HMP methods with the A3 analytical strategy can achieve the best or close-to-the-best performance. Even for the disease model with main effect only (model G+M) the power for the minimum P-value method with strategy is only slightly worse than that from the A1 strategy. Therefore, we recommend to use the minimum P-value or HMP with A3 strategy when interaction effects are of interest.
Declarations
Competing interests
The authors declare that they have no competing interests
Funding
This research was funded by a Precision Driven Health research partnership Doctoral Scholarship, the Faculty Research Development Fund from the University of Auckland, and the Marsden Fund from Royal Society of New Zealand (Project No. 19-UOA-209).
Acknowledgment
The author(s) wish to acknowledge the use of New Zealand eScience Infrastructure (NeSI) high performance computing facilities, consulting support and/or training services as part of this research. New Zealand’s national facilities are provided by NeSI and funded jointly by NeSI’s collaborator institutions and through the Ministry of Business, Innovation & Employment’s Research Infrastructure programme.
URL https://www.nesi.org.nz.
References
- Manolio, Teri A, Francis S Collins, Nancy J Cox, David B Goldstein, et al. (2009) Finding the Missing Heritability of Complex Diseases. Nature 461(7265): 747-753.
- Phan, John H, Chang F Quo, Chihwen Cheng, May Dongmei Wang (2012) Multiscale Integration of-Omic, Imaging, and Clinical Data in Biomedical Informatics. IEEE Reviews in Biomedical Engineering 5: 74-87.
- WLKoh, Hiromi, Damian Fermin, Christine Vogel, Pui Choi Kwok, et al. (2019)IOmicsPASS: Network-Based Integration of Multiomics Data for Predictive Subnetwork Discovery. Npj Systems Biology and Applications 5(22).
- Bersanelli Matteo, Ettore Mosca, Daniel Remondini, Enrico Giampieri, Claudia Sala, et al.(2016) Methods for the Integration of Multi-Omics Data: Mathematical Aspects.BMC Bioinformatics 17(2): S15.
- Li Bingshan, Suzanne M Leal (2008) Methods for Detecting Associations with Rare Variants for Common Diseases: Application to Analysis of Sequence Data. The American Journal of Human Genetics 83(3): 311-321.
- Zeng Yaohui, Tianbao Yang, Patrick Breheny(2017) Efficient Feature Screening for Lasso-Type Problems via Hybrid Safe-Strong Rules.” arXiv Preprint arXiv:1704.08742.
- Zhao Ni, Xiang Zhan, Yen-Tsung Huang, Lynn M Almli, et al. (2018) Kernel Machine Methods for Integrative Analysis of Genome-Wide Methylation and Genotyping Studies. Genetic Epidemiology 42(2): 156-167.
- Lanckriet, Gert RG, Tijl De Bie, NelloCristianini, Michael I Jordan, et al. (2004) A Statistical Framework for Genomic Data Fusion.Bioinformatics 20(16): 2626-2635.
- Speicher, Nora K,Nico Pfeifer (2015) Integrating Different Data Types by Regularized Unsupervised Multiple Kernel Learning with Application to Cancer Subtype Discovery. Bioinformatics 31(12): i268-i275.
- Yan Qi, Nianjun Liu, Erick Forno, GlorisaCanino, Juan C Celedón, et al.(2019) An Integrative Association Method for Omics Data Based on a Modified Fisher’s Method with Application to Childhood Asthma. PLoS Genet15 (5): e1008142.
- Wilson, Daniel J (2019) The Harmonic Mean P-Value for Combining Dependent Tests. Proceedings of the National Academy of Sciences 116(4): 1195-1200.
- Donoho David,Jiashun Jin (2004) Higher Criticism for Detecting Sparse Heterogeneous Mixtures.The Annals of Statistics 32(3): 962-994.
- Wu Zheyang, Yiming Sun, Shiquan He, Judy Cho, Hongyu Zhao, et al. (2014) Detection Boundary and Higher Criticism Approach for Rare and Weak Genetic Effects. The Annals of Applied Statistics 8(2): 824-851.
- Olkin, Ingram (1995) Statistical and Theoretical Considerations in Meta-Analysis. Journal of Clinical Epidemiology 48(1): 133-146.
- Hartung, Joachim (1999) A Note on Combining Dependent Tests of Significance.Biometrical Journal: Journal of Mathematical Methods in Biosciences 41(7): 849-855.
- Zaykin, Dmitri V, Lev A Zhivotovsky, Peter H Westfall, et al. (2002) Truncated Product Method for Combining P-Values. Genetic Epidemiology 22(2): 170-185.
- Poole William, David L Gibbs, Ilya Shmulevich, Brady Bernard, Theo A Knijnenburg (2016) Combining Dependent P-Values with an Empirical Adaptation of Brown’s Method. Bioinformatics 32(17): i430-i436.
- WuMichael C, Seunggeun Lee, Tianxi Cai, Yun Li, Michael Boehnke, et al. (2011) Rare-Variant Association Testing for Sequencing Data with the Sequence Kernel Association Test. The American Journal of Human Genetics 89(1): 82-93.
- WuMichael C, Peter Kraft, Michael P Epstein, Deanne M Taylor, Stephen J Chanock, et al. (2010) Powerful SNP-Set Analysis for Case-Control Genome-Wide Association Studies. The American Journal of Human Genetics 86(6): 929-942.
- Han Fang,Wei Pan (2010) A Data-Adaptive Sum Test for Disease Association with Multiple Common or Rare Variants. Human Heredity 70(1): 42-54.
- Price Alkes L, Gregory V Kryukov, Paul IW de Bakker, Shaun M Purcell, Jeff Staples, et al. (2010) Pooled Association Tests for Rare Variants in Exon-Resequencing Studies. The American Journal of Human Genetics 86(6): 832–838.
- Fisher, Ronald Aylmer (1992) Statistical Methods for Research Workers. Springer, United States.
- Brown,Morton B (1975) A Method for Combining Non-Independent, One-Sided Tests of Significance. Biometrics 31(4): 987-992.
- Kost, James T,Michael P McDermott (2002) Combining Dependent P-Values. Statistics & Probability Letters 60(2): 183-190.
- Alves Gelio,Yi-Kuo Yu (2014) Accuracy Evaluation of the Unified P-Value from Combining Correlated P-Values. PloS One 9(3): e91225.
- Hou, ChiaDing (2005) A Simple Approximation for the Distribution of the Weighted Combination of Non-Independent or Independent Probabilities. Statistics & Probability Letters 73 (2): 179-187.
- Whitlock, Michael C (2005) Combining Probability from Independent Tests: The Weighted Z-Method Is Superior to Fisher’s Approach.J Evol Biol 18 (5): 1368-1373.
- Wilkinson, Bryan (1951) A Statistical Consideration in Psychological Research. Psychological Bulletin 48(2): 156.
- Sheng, Xuguang, Jingyun Yang (2013) An Adaptive Truncated Product Method for Combining Dependent P-Values. EconLet 119 (2): 180-182.
- DudbridgeFrank,Bobby PC Koeleman (2003) Rank Truncated Product of P-Values, with Application to Genomewide Association Scans. Genetic Epidemiology: The Official Publication of the International Genetic Epidemiology Society 25 (4): 360–366.
- Frank Dudbridge, Bobby PC Koeleman (2004) Efficient Computation of Significance Levels for Multiple Associations in Large Studies of Correlated Data, Including Genomewide Association Studies.Am J Hum Genet75 (3): 424-435.
- Tippett, Leonard Henry Caleb (1931) The Methods of Statistics. The Methods of Statistics.
- Stouffer, Samuel A, Edward A Suchman, Leland C DeVinney, Shirley A Star, et al. (1949) The American Soldier: Adjustment During Army Life.(Studies in Social Psychology in World War II), Vol. 1.Princeton Univ. Press, United States.
- Lipták, Tamás(1958) On the Combination of Independent Tests. Magyar TudAkad Mat Kutato Int Kozl 3: 171-197.
- Larry V, Hedges, Ingram Olkin (1985) Statistical Methods for Meta-Analysis. Academic Press, San Diego, CA, United States.
- Wilks, Samuel S (1938) The Large-Sample Distribution of the Likelihood Ratio for Testing Composite Hypotheses. The Annals of Mathematical Statistics 9(1): 60-62.
- Sun, Yan V, Yi-Juan Hu (2016) Integrative Analysis of Multi-Omics Data for Discovery and Functional Studies of Complex Human Diseases.Adv Genet 93:147-190.
- Chalise, Prabhakar, Rama Raghavan,Brooke L Fridley (2016)InterSIM: Simulation Tool for Multiple Integrative ‘Omic Datasets. Computer Methods and Programs in Biomedicine 128: 69–74.
- Su Zhan, Jonathan Marchini,Peter Donnelly (2011) HAPGEN2: Simulation of Multiple Disease Snps. Bioinformatics 27(16): 2304–2305.
- WuCen, Fei Zhou, Jie Ren, Xiaoxi Li, Yu Jiang, et al. (20190 A Selective Review of Multi-Level Omics Data Integration Using Variable Selection.High-Throughput 8(1): 4.
- Hamid, Jemila S, Pingzhao Hu, Nicole M Roslin, Vicki Ling, et al. (2009) Data Integration in Genetics and Genomics: Methods and Challenges. Human Genomics and Proteomics: HGP 869093.
- Meng Chen, Bernhard Kuster, Aedı́n C Culhane, Amin MoghaddasGholami (2014) A Multivariate Approach to the Integration of Multi-Omics Datasets. BMC Bioinformatics 15 (1): 162.


