


A Note on the Dependence Measurement for Ordinal-Continuous Data
Emanuela Raffinetti*
Department of Economics, Management and Quantitative Methods University of Milan, Italy
Submission: September 24, 2019; Published: October 2, 2019
*Corresponding author: Emanuela Raffinetti, Department of Economics, Management and Quantitative Methods University of Milan, Via Conservatorio 7, 20122 Milan, Italy
How to cite this article: Emanuela Raffinetti. A Note on the Dependence Measurement for Ordinal-Continuous Data. Biostat Biom Open Access J. 2019; 9(5): 555775. DOI: 10.19080/BBOAJ.2019.09.555775
Abstract
In this paper, an extension of a recent monotonic dependence coefficient (MDC) has been introduced in order to deal with an ordinal dependent and a continuous independent variable. Through our proposal, the ordinal dependent variable, expressed according to subjective categories based on the Likert scale, is transformed into a variable which is measurable on a continuous scale.
Keywords: Ordinal data; Monotonic dependence relationship; Dependence coefficient
Abbreviations: MDC: Monotonic Dependence Coefficient; MDCadj: Adjusted Monotonic Dependence Coefficient
Introduction
The encounter with phenomena linked to each other through dependency relationships takes place in several contexts, especially in Biology and Medicine. As known, statistical literature provides dependence coefficients whose employment strongly depends on the nature of the variables involved into the analysis. On the one hand, if the two variables are quantitative, the most commonly used measure is the Pearson-r correlation coefficient. On the other hand, if the two variables are ordinal, the most appropriate measures are the Spearman-rS and Kendall-τ correlation coefficients. One of the main problems in the dependence relationship measurement arises if the two variables take different nature, that is one variable is continuous and the other variable is ordinal and expressed though a Likert scale (see, e.g. Likert [1]). This type of variables frequently appears in the research fields addressed to the medical diagnosis. As an example, suppose to evaluate the risk (low, medium, high) of a disease with respect to some blood parameter values which represent the risk factors. Due to the mixed nature of the variables, loss of information occurs if resorting to the Pearson’s, Spearman’s and Kendall’s correlation coefficients.
In this paper we propose a novel dependence coefficient suitable in catching the monotonic dependence relationships between an ordinal target variable and a continuous predictor. It is worth noting that our contribution is the result of the extension of a recent dependence measure (named Monotonic Dependence Coefficient-MDC) which was originally introduced by Ferrari & Raffinetti [2] with the aim of assessing the bivariate monotonic dependence relationships in the cases of continuous variables or a continuous dependent variable and an ordinal independent variable. The same coefficient was further developed by Raffinetti & Aimar [3] for the grouped-ordinal data scenario. In general, given an independent and a dependent variable, the MDC coefficient is computed by considering the dependent variable values re-ordered according to the ranks associated with the values of the independent variable. Contrary to the Spearman’s and Kendall’s correlation coefficients, the rank tool is not directly involved into the computation of the MDC index allowing to preserve the data raw metric. In order to cover the case of an ordinal dependent variable and a continuous independent variable, an ad-hoc adjustment is here suggested.
Proposal
The MDC coefficient proposed by Ferrari and Raffinetti [2] presents similarities with a further index, called Gini correlation, which was initially introduced by Blitz & Brittain [4] and subsequently re-formalized by Schezhtman & Yitzhaki [5], especially for the study of inequality in income distributions. Given two continuous variables Y and X, where Y and X take the role of the dependent and independent variable, the MDC index is expressed as

where YM is the Y mean value, *iy’s are the iy’s values re-ordered according to the ranks of the X values and ()iy’s are the iy’s values ordered in non-decreasing sense. As in Raffinetti & Aimar [3], in equation (1) we consider the MDC index expression based on the original real-valued Y variable. This because, we are not interested in the MDC coefficient interpretation in terms of the classical Lorenz curves (see Lorenz [6]) which require the presence of non-negative variables (see, e.g. Ferrari & Raffinetti [2]). The MDC coefficient takes values in the close range [−1; +1]. More precisely, in the case of a perfect direct monotonic dependence relationship MDC=+1, otherwise, in presence of a perfect inverse monotonic dependence relationship, MDC=−1. In all the intermediate situations, −1 where, given k ordered categories X1, . . . , Xg, . . . , Xk, with g = 1, . . . , k, *gnis the cumulative frequency of the first g categories and gyis the average of the Y values corresponding to Xg. Trivially, if g=k then *kn= n (see, Ferrari & Raffinetti [2]). In this case, the MDC coefficient never reaches the extreme bounds. Based on these premises, we propose an appropriate adjustment for the MDC index when the dependent variable is ordinal, and the independent variable is continuous. The presence of an ordinal dependent variable, expressed according to equidistant and subjective categories, has to be faced through a transformation able to turn it into a variable which is measurable on a continuous scale. Our proposal is to replace the ordinal variable integer values (categories) with the average of the continuous variable values corresponding to a specific ordinal variable category. Specifically, let X be the continuous independent variable and Y the ordinal dependent variable characterized by k ordered categories and such that 
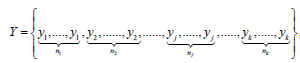
where nj represents the frequency associated with each jy−th ordered category (for j=1, . . . , k). Let us denote with 1jnjiixx==Σ, for j = 1, . . . , k, the mean of all the original X variable values corresponding to the jy−th ordered category. The original ordinal dependent variable Y is replaced by the new variable X, measured on the continuous scale and defined as:

Trivially, 1x= . . . = jnx, for every j = 1,…., k. Thus, any set jSis built by replicating the mean value of the original continuous X variable values, associated with the jy−th category, nj times the number of observations falling inside the jy−th ordered category. The new variable Xin (3) includes elements resulting in multiple observations of some values. As a consequence, being 1kjjnn==Σ , where nj represents the number of observations inside each set Sj (j = 1, . . ., k), the cumulative density function of X¯ can be written as

The adjusted MDC coefficient (MDCadj), can be re-express as the ratio between the values of the new variable X (taking the role of the dependent variable) ordered in non-decreasing sense and the values of the same variable re-ordered with respect to the ranks of the original continuous independent variable X values.
Formally,

where XM is the Xvariable mean value and ()ix’s and *ix’s are the variable Xvalues ordered in non-decreasing sense and according to the ranks of the independent variable X. The MDCadj coefficient is bounded in the close range [−1, +1]. Specifically, the extreme bounds and the case of value equal to zero are reached in the following scenarios.
Scenario 1 MDCadj = +1 if and only if
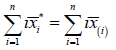
This result is achieved in all the situations in which the ranks associated with the ix’s values are reversed with respect to the re-ordering process based on the continuous independent variable.
Scenario 3 MDCadj = 0 if and only if
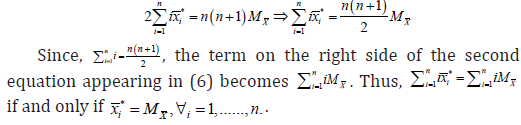
This result is only theoretical since it implies that a unique ordered category is present. Nevertheless, the more we approach to this situation, the more the monotonic dependence relationship between the variables is weak. To give more insight into the MDCadj coefficient behavior, we build a Monte Carlo simulation study for examining its performance with respect to that of the Pearson’s (r), Spearman’s (rS) and Kendall’s (τ) coefficients. Data are generated from a bivariate Normal distribution with pairwise correlation coefficient ρ={0.3, 0.7}. In this case, the pairwise correlation coefficient takes the role of reference for the relationships between the variables. This because it defines the strength of the existing dependence relationships (specifically, the linear one) between the original generated variables. Thus, samples of size equal to 500 are drawn and the process is iterated 10,000 times. Once generated our data, one of the two variables is discretized. The discretization process involves both the cases of four asymmetrical and uniform categories. The frequency distribution of the considered uniform and asymmetrical categories are reported in Table 1.


If on the one hand, the MDCadj coefficient deals with the ordinal nature of one of the two variables by converting it into a continuous scale, on the other hand the Pearson’s, Spearman’s and Kendall’s correlation coefficients are directly computed on the variable expressed through the Likert scale. The simulation findings are displayed in Figures 1-4, where the boxplots of the Monte Carlo values yielded in each drawn sample and referred to all the considered dependence coefficients are reported. More in detail, each of these figures differs both in terms of the values chosen for ρ (graphically denoted with the dashed red line) and of the discretization process (based on asymmetrical or uniform categories).
Figures 1,2 show that the MDCadj coefficient reaches a median value perfectly overlapping with the value of the pairwise correlation coefficient ρ=0.3. In Figures 3 and 4, the MDCadj coefficient median value is a little bit smaller than the pairwise correlation coefficient value (ρ=0.7), but also in this case greater than the median values associated with its competitors. Based on these considerations, we can conclude that MDCadj appears as the least sensitive coefficient to the discretization process and consequently the most appropriate measure to assess the original dependence relationship between the variables.
Conclusion
In this paper a new tool for measuring monotonic dependence relationships between an ordinal dependent and continuous independent variable is presented. Typically, when one of the two involved variables takes ordinal nature, the Pearson’s correlation coefficient may not be successfully applied since data are not specified according to a metric scale. Moreover, the subjectivity in the use of the Likert scale may lead to biased results. Vice versa, the employment of the Spearman’s and Kendall’s correlation coefficients neglects the continuous nature of one of the two variables, reducing its continuous information into its ordinal information. The MDCadj coefficient overcomes the above drawbacks by replacing the ordinal dependent variable integer values (categories) with the average of the continuous independent variable values associated with a specific ordinal variable category. The adequacy of the proposed adjustment is also validated by the Monte Carlo simulation results.
References
- Likert R (1932) A technique for the measurement of attitudes. Arch Psychol 22(140): 5-55.
- Ferrari PA, Raffinetti E (2015) A different approach to Dependence Analysis. Multivar Behav Res 50(2): 248-264.
- Raffinetti E, Aimar F (2018) M DCgo takes up the association/correlation challenge for grouped ordinal data. AStA Adv Stat Anal.
- Blitz RC, Brittain JA (1964) An extension of the Lorenz diagram to the correlation of two variables. Metron 23(1-4): 137-143.
- Schezhtman E, Yitzhaki S (1987) A Measure of Association Based on Gini’s Mean Difference. Commun Stat-Theory M 16(1): 207-231.
- Lorenz MO (1905) Methods of measuring the concentration of wealth. Publ Am Stat Assoc 9(70): 209-219.


