The New Evidence of Equality of Performance of Classification Tree Method to Discriminant Analysis
Belenky Vadim1*, Klicenko Olga2, Gelman Victor3 and Golovkin Vladimir4
1 Arsvita Clinic, St. Petersburg, Russia
2Department of Pedagogies, philosophy and law, North-Western State Medical University named after I.I. Mechnikov, St. Petersburg, Russia
3Department of medical informatics and physics, North -Western State Medical University named after I.I. Mechnikov, St. Petersburg, Russia
4Department of medical informatics and physics, North -Western State Medical University named after I.I. Mechnikov, St. Petersburg, Russia
Submission: February 26, 2019; Published: June 03, 2019
*Corresponding author: Belenky Vadim, Arsvita Clinic, St. Petersburg, Krasnoputilovskaya 125, Russia
How to cite this article: Belenky Vadim, Klicenko Olga, Gelman Victor, Golovkin Vladimir. The New Evidence of Equality of Performance of Classification Tree Method to Discriminant Analysis. Biostat Biometrics Open Acc J. 2019; 9(4): 555769. DOI: 10.19080/BBOAJ.2019.09.555769
Abstract
For solving the problem of classification/prediction in science, alternative statistical methods have been proposed, such as discriminant analysis, classification trees, neural network, factor analysis, logistic regression, support vector machines and some others tests, all these methods constantly being compared in their performance power. But the results of comparison of abovementioned methods still remain controversial, and hence comparative efficacy of those classifiers has not been established so far. When the authors of this paper explored biogenic amines status in neurologic disorder named dystonia, we also applied some of such statistical methods for data analysis and for elaboration of diagnostic test. The objective of the investigation was to elaborate discrimination of dystonia on the basis of biogenic amines exchange peculiarities. In such situation of creating a new diagnostic tool, the researcher always faces not only the medical problem of identification of some disorder, but also the mathematical problem of comparing efficacy of different methods of calculation, because he usually tries not one, but several statistical approaches, whose accredited comparative power has not been accepted so far. And that is true, of course, for any other science, when elaborating classification/determination tasks. That is why once we addressed ourselves to optimize the diagnosis of some disorder, we unavoidably challenged to explore the mathematical enigma of properties of these alternative methods of calculation, and in our case these alternative methods happened to be the classification tree and the discriminant analysis.
Keywords:Classification tree; Discriminant analysis; Dystonia; Biogenic amines
Abbreviations: TRP: tryptophan; 5-HTTP: 5-Hydroxy-Tryptophan; 5-HT: Serotonin; 5-HIAA: Hydroxiindolacetic Acid; TYR: Tyrosin; HVA: Homovanillic Acid; LCF: Linear Discriminate (classificational) Functions; CTr: Classification Trees; CART: Classification and Regression Tree
Introduction
In medicine, as in any other science, when tackling the classification problem, the researcher tries several alternative statistical approaches, because the exact comparative power of those approaches still remains unknown. The very demonstrative example is comparison of several classifiers performed by Reinberger G, et al. [1]. The author challenges the task of discrimination chronic active hepatitis from chronic persistent hepatitis on the base of some biochememical tests, and he brings the number of correct/false classifications performed by 3 methods – by neural network, by classification tree and by discriminant analysis.
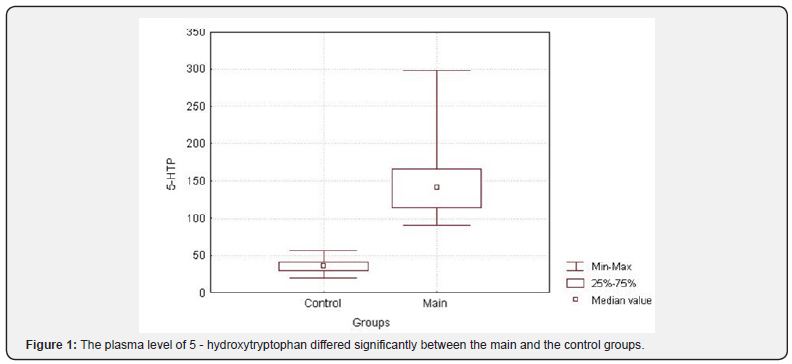
On the base of obtained results of biogenic amines exchange in our own research of neurological disorder dystonia, we faced the similar task of detecting the optimal classifier for elaboration of diagnostic test. We measured 6 substances in plasma of two groups of patients – in the main group of 12 patients suffering from dystonia, and in the second control group of 20 patients. Those 6 substances, referred to biogenic amines, were the following: tryptophan (TRP), 5-hydroxy-tryptophan (5-HTP), serotonin (5-HT), hydroxiindolacetic acid (5-HIAA), tyrosin (TYR) and homovanillic acid (HVA). Three from six substances appeared to be significantly increased in the group of dystonia (Figure 1).


Results of classification trees analysis
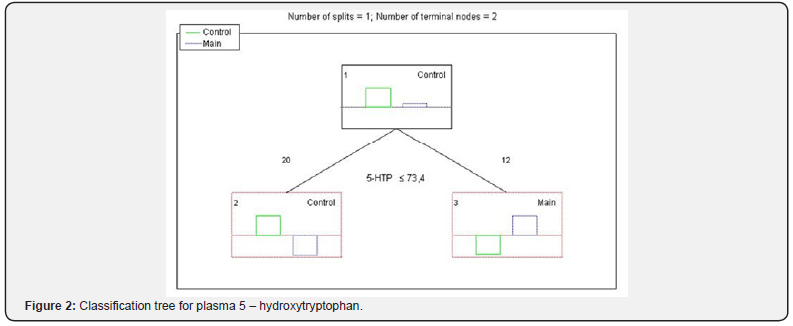
The results of classification trees analysis proved increased plasma 5 - hydroxytryptophan to be the reliable diagnostic criteria of dystonia (Figure 2 ) with its level- L0 5-HTP >73,4 favoring the diagnosis of dystonia.
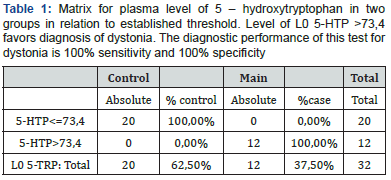
The diagnostic power of the classification tree test by 5 – hydroxytryptophan plasma level is clearly seen from the following matrix (Table 1).


Results of discriminate analysis
For discriminant analysis from 6 substances studied the most valuable differential indicators were picked, namely the level of 5-HIAA in plasma and 5 HTP in plasma (Figure 3).
As a result of discriminate analysis, we derived equations of canonical linear discriminate (classificational) functions (LCF), that probably can detect or exclude dystonia at examination of latent forms, so called “formes frustes”, of this disorder. These are the equations formulas –
LCF 1 = -1,329 + 0,038 x 5-HTP + 0,009 x 5-HIAA equation for control group without dystonia (G0)
LCF 2 = -14,95 + 0,155 x 5-HTP + 0,02 X 5-HIAA equation for case group with dystonia (G1)
The significance of derived discriminative functions р<0,0000 turned to be below р<0,05 (Figure 4).
When we check the patient for probable form frustes of dystonia, we just measure the level of 5 HTP и 5-HIAA in plasma, and obtained data we substitute into these two equations and then compare results of LCF 1 and LCF 2. If LCF 2 exceeds the LCF 1, our patient relates to the group G 1, suffering from dystonia and if LCF 1 exceeds LCF 2, the patient is related to the group G 0, free from dystonia.

The diagnostic performance of the new test elaborated by discriminant analysis could be seen from the Figure 5. The discriminant analysis possesses 100% sensitivity and 100% specificity.

It is remarkable, that either discriminant or classification tree tests – both - include 5–HTP and both posses 100% sensitivity and 100% specificity.
In the such situation of creating a new diagnostic tool, the joint use of several methods is frequently mentioned in scientific reports - namely the method of classification trees (CTr) and a method of discriminant analysis, these two methods proved to be nearly equal in their diagnostic power [1-7]. The joint use of factor and discriminant analysis is also reported [8-12] as well as some other combinations of classifiers [13-22]. We carried comparison of dystonia and control group by means of the decision tree method and discriminant analysis, and we revealed their high and almost equal efficacy. The efficacy of these two tests in our study turned to be strikingly high – both demonstrated the same 100% sensitivity and 100% specificity. In addition, factor analysis also coincided in our study with the results of discriminate and classification trees analysis results [23-25]. From the classification trees method and from discriminate analysis we derived alternative and reliable tests, that can detect or exclude dystonia at examination of latent forms so called “formes frustes” of this disorder. Classification trees method is non-parametric classifier that construct hierarchical decision trees by splitting data among classes of the criterion at a given step (node) accordingly to an “if-then” rule applied to a set of predictors, into two child nodes repeatedly, from a root node that contains the whole sample [26]. Thus, CTr can select the predictors and its interactions that are most important in determining an outcome for a criterion variable. The development of a CTr is supported on three major elements:
I. Choosing a sampling-splitting rule that defines the tree branch which connect the classification nodes;
II. The evaluation of classification produced by the splitting rule at each node and
III. The criteria used for choosing an optimal or final tree for classification proposes.
Accordingly, to the features of these major elements, the most usual CTr can be classified into Classification and Regression Tree (CART). Important thresholds were obtained in our study by means this method.
Then we used discriminant analysis, developed by R Fisher in 1936 [27]. It demonstrated the same 100% sensitivity and 100% specificity in differential diagnosis of dystonia and pointed the same substance of 5 – HTP- for diagnosis of dystonia
Conclusion
In the study of biogenic amines exchange we revealed enhancement in most dystonic patients of such metabolites as 5-HPT, 5-HT, TYR, HIAA. In attempt to analyze these changes, we matched control group and tried just two statistical approaches from plenty of existing. And these attempted methods instantly disclosed possibilities of differential diagnosis, based on analysis of peculiarities of biogenic amines exchange, and that is more, they appeared to be equal in diagnostic power. And this diagnostic power of those tests appeared to be very high, up to 100% sensitivity and 100% specificity. We expect, that sophistication of statistical methods applied to this problem in future would allow simplification of differential diagnosis. The main conclusion is that these 2 statistical methods are effective for classification task, and equal in their diagnostic power.
References
- Reibnegger G, Weiss G, Werner-felmayer G (1991) Neural networks as a tool for utilizing laboratory information: Comparison with linear discriminant analysis and with classification and regression trees. Proc Nati Acad Sci 88(24): 11426-11430.
- Chen J, Chen-An T, Moon H, Tsai CA, Ahn H, et al. (2006) Decision threshold adjustment in class prediction. SAR QSAR Environ Res 17(3): 337-3
- Maroco J, Silva D, Rodrigues A, Guerreiro M, Santana I, et al. (2011) Data mining methods in the prediction of Dementia: A real-data comparison of the accuracy, sensitivity and specificity of linear discriminant analysis, logistic regression, neural networks, support vector machines, classification trees and random forests. BMC Research Notes; 4: 299.
- Holmes Finch, Schneider K (2007) Classification Accuracy of Neural Networks vs. Discriminant Analysis, Logistic Regression, and Classification and Regression Trees. Methodology 3: 47-57.
- Hannöver W, Kordy H (2005)Predicting outcomes of inpatient psychotherapy using quality management data: comparing classification and regression trees with logistic regression and linear discriminant analysis. Psychother Res 15(3): 236-247.
- Feldesman M (2002) Classification trees as an alternative to linear discriminant analysis. Am J Phys Anthropol 119(3): 257-75.
- Krasteva V, Jekova I, Leber R, Schmid R, Abächerli R (2015) Superiority of Classification Tree versus Cluster, Fuzzy and Discriminant Models in a Heartbeat Classification System. PLoS One 10(10): 1-29.
- Tazhibi M, Sarrafzade S, Amini M (2014) Retinopathy risk factors in type II diabetic patients using factor analysis and discriminant analysis. J Educ Health Promot 3: 85.
- Sulthana A, Latha K, Rathan R, Sridhar R, Balasubramanian S (2014) Factor analysis and discriminant analysis of wastewater quality in Vidyaranyapuram sewage treatment plant, Mysore, India: a case study. Water Sci Technol 69(4): 810-818.
- Coolidge F (1976) Discriminant and factor analysis of the WAIS and the Satz-Mogel abbreviated WAIS on brain-damaged and psychiatric patients. J Consult Clin Psychol 44(1): 153.
- Riccia G, Shapiro A (1983) Fisher discriminant analysis and factor analysis. IEEE Trans Pattern Anal Mach Intell 5(1): 99-104.
- Rinke C, Williams M, Brown C (2012) Discriminant analysis in the presence of interferences: combined application of target factor analysis and a Bayesian soft-classifier. Anal Chim Acta 13(753): 19-26.
- Peter CA (2007) A comparison of regression trees, logistic regression, generalized additive models, and multivariate adaptive regression splines for predicting AMI mortality. Statistics in Medicine; 26(15): 2937-2957.
- Goss EP, Ramchandani H (1995) Comparing classification accuracy of neural networks, binary logit regression and discriminant analysis for insolvency prediction of life insurers. Journal of Economics and Finance 19: 1-18.
- Efron B (1975) The Efficiency of Logistic Regression Compared to Normal Discriminant Analysis. Journal of the American Statistical Association 70: 892-898.
- Fan X, Wang L (1999) Comparing linear discriminant function with logistic regression for the two-group classification problem. Journal of Experimental Education 67: 265-286.
- Lei PW, Koehly LM (2003) Linear discriminant analysis versus logistic regression: a comparison of classification errors in the two-group case. The Journal of Experimental Education 72: 25-49.
- Pohar M, Blas M, Turk S (2004) Comparison of Logistic Regression and Linear Discriminant Analysis: A Simulation Study. Metodološki zvezki 1: 143-161.
- Kurt I, Ture M, Kurum AT (2008) Comparing performances of logistic regression, classification and regression tree, and neural networks for predicting coronary artery disease. Expert Systems with Applications 34: 366-374.
- Poon TC, Chan AT, Zee B, Ho SK, Mok TS, et al. (2001) Application of classification tree and neural network algorithms to the identification of serological liver marker profiles for the diagnosis of hepatocellular carcinoma. Oncology 61(4): 275-283.
- Gelnarova E, Safarik L. (2005) Comparison of three statistical classifiers on a prostate cancer data. Neural Network World 15: 311-318.
- Duin RPW (1996) A note on comparing classifiers. Pattern Recognition Letters 17: 529-536.
- Belenky V, Golovkin V, Koroleva E, Gelman V (2018) Analysis of Biogenic Amines Exchange in Dystonia. Med - Clin Res & Rev 2(4): 1-5.
- Belenky V, Klicenko O, Gelman V, Koroleva E, Golovkin V (2018) Decision Tree, Discriminant and Factor Analysis of Biogenic Amines in Diagnosis of Dystonia SF. J Neurosci 2(2): 1-13.
- Belenky V, Golovkin V, Puzin M (2018) Torsion dystonias. Biochemical and PET studies. Lambert academic publishing. Maunthius. 62.
- Breiman L, Friedman JH, Olshen RA, Stone CJ (1984) Classification and regression trees. Chapman and Hall/ CRC, New-York 368.
- Fisher R (1936) The use of multiple measurements in taxonomic problems. Annals of eugenics 7: 179-188.


