


Preliminary Tests of Homogeneity - Type I Error Rates under Non-Normality
Tanweer Ul Islam*
Department of Economics, National University of Sciences and Technology (NUST), Pakistan
Submission: November 23, 2017; Published: May 22, 2018
*Corresponding author: Tanweer Ul Islam, Department of Economics, National University of Sciences and Technology (NUST), Pakistan; Email: tanweer.ul.islam@gmail.comHow to cite this article: Tanweer U I. Preliminary Tests of Homogeneity - Type I Error Rates under Non-Normality. Biostat Biometrics Open Acc J. 2018; 6(5): 555699.DOI:10.19080/BBOAJ.2018.06.555699
Abstract
Many statistical procedures utilize preliminary tests to enhance the accuracy of the final inferences. Preliminary tests like Goldfeld-Quandt (GQ) and Levene-type tests are used to assess the assumption of equality of population variances with normality as the underlying distributional assumption. Such tests must be used with care as the final inferences are conditional on the performance of these tests at first stage. This study explores the size distortions of GQ and Levene-type tests under non-normality. The results do not warrant the use of GQ & Levene test under non-normality as the size distortions are as high as 88 & 48% for the respective statistics. However, the modified form of Levene test (BF-test) retains its size properties except for the multi-model alternatives with relatively big outliers.
Keywords: Size Distortions; Levene test; Equality of variances; Statistical procedures; Preliminary test; Chow-test; ANOVA; Homoscedasticity; Heteroskedastic model; Accuracy; Null hypothesis; Deficit data; Unequal sample sizes; Skewness; Kurtosis; Maximum size; Goldfeld-Quandt; Non-normality; Robust form; Multi-model distributions; Outliers
Abbreviations: GQ: Goldfeld-Quandt; DGP: Data Generating Process
Introduction
Many statistical procedures utilize preliminary test(s) to enhance the accuracy of the final inference. For example, in time series regression model, the Chow-test is widely used to test the presence of any structural change in the Data Generating Process (DGP), employs the Goldfeld-Quandt [1] test (GQ) as a preliminary test to assess the assumption of homogeneity of variances. The GQ- test is usually applied prior to the Chow test with normality as the underlying distributional assumption. Several other statistical procedures in the field of medical & social sciences, for example, One-way ANOVA makes use of the Levene's and the BF-tests as preliminary tests to assess equality of population variances. Such kind of preliminary tests are used in wide variety of applications, for example, public deficit data [2], regression analysis [3], audit pricing [4], capital structure [5], medicine [6], surgery [7], arthroplasty [8] & neuro imaging [9]. Furthermore, applications of the Levene-type tests have been surveyed in detail by Gastwirth et al. [10].
These preliminary tests must be used with care as the final inferences are conditional on the performance of these preliminary tests at first stage [11]. The GQ and the Levene's type tests assume the normality of the data while assessing the equal population variances. Although, some authors reassure robustness of modified Levene's type tests to normality but this study reemphasizes the use of diagnostic tests for normality for validating inferences made from regression models and from other statistical procedures which utilize GQ & Levene's type preliminary tests. This study explores the impact of non-normality on the performance of the GQ & Levene’s type tests. Since I plan to use numerical methods, the alternative (non-normal) space must be narrowed down to something sufficiently small to permit exploration by numerical methods. At the same time, the space should be large enough to provide a good approximation to the full space of alternatives - failing that, it should be large enough to approximate the distributions conventionally used in simulations studies to assess the performance of normality tests [12]; Pearson et al. [13]; Thadewald et al. [14], Zhang, et al. [15], Yazici, et al. [16], Romao et al. [17], Yap, et al. [18] and Bispo, et al. [19], Islam [20]. The distributions used as alternative space cover a wide range of real world applications in the field of Social Sciences, Genomics, Neuro Sciences and Baysian Econometrics modelling. Type- I error rates for the GQ and Levene's type tests have been computed against the selected class of nonnormal space to explore the impact of non-normality on their performance.
The preliminary tests
Some common statistical procedures like t-test, ANOVA & Chow test assume that variances of the populations from which k different samples are drawn are equal. The GQ & Levene's type tests assess this assumption. They test the null hypothesis that the population variances are homogeneous.
The goldfeld-quandt (GQ) test
For this test, it is assumed that the observations can be divided into two groups in such a way that under the hypothesis of homoscedasticity, the disturbance variances would be the same in the two groups, whereas under the alternative, the disturbance variances would differ systematically. The most favorable case for this would be the group-wise heteroskedastic model
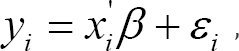
Such that σ2i= σ2ix2ifor some variable x. To test explicitly, the suggested procedure is, by ranking the observations based on this x and dropping the central 'c' values, we can separate the observations into those with high and low variances. The test is applied by dividing the sample into two groups with and observations such that n1 + n2 = n - c. To obtain the statistically independent variances estimators, the regression is then estimated separately with the two sets of observations. The test statistic is
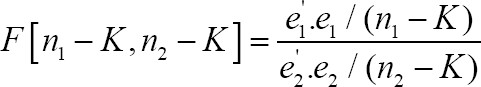
Where, it is assumed that the disturbance variance is larger in the first sample. (If not, then reverse the subscripts.) Under the null hypothesis of homoscedasticity, this statistics has an F distribution with n1 - K & n2 - K degrees of freedom. A larger value than the standard F table value at the given level of significance leads to the rejection of the null hypothesis.
The levene-type tests
The Levene's type tests are used to assess the underlying assumption of homogeneity of variances. Statistical procedures which typically assume equality of variances include analysis of variance (ANOVA) and t-tests. The Levene's test (1960) and the Brown-Forsythe (1974) test are often used as a preliminary test to validate the inferences drawn from the ANOVA and t-tests. The ANOVA is used to assess whether the k populations have a common mean For this, k samples xi1,xi2,....,xin , of size n_i with respective means, μ_1 and variances, σ2,i = 1...., ,k are drawn from each of k populations. To test the equality of means, the standard F-test assumes that the k populations has a common variance, σ2 . To test the homogeneity of variances assumption, Levene proposed the following statistic.
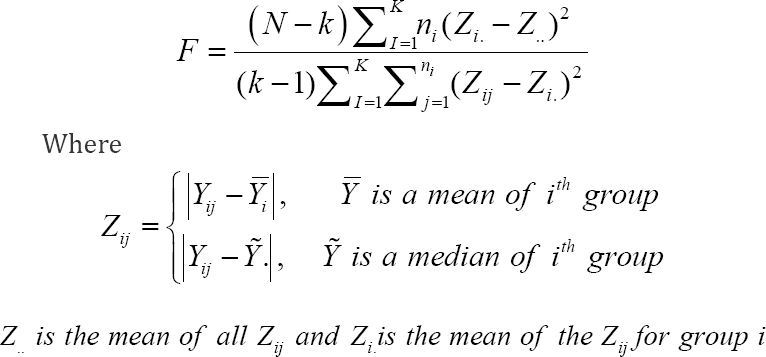
The Levene's statistic is approximately F-distributed with k-1 and N- k degrees of freedom. The Brown-Forsythe test uses the median instead of mean. The Levene’s type test based on median is recommended in the literature as these are robust statistics comparative to Levene's test against nonnormality of data.
Simulation study & t- I error rates
Monte Carlo procedures are conducted to compute the type- I error rates for the GQ & Levene’s type tests. These type- I error rates are obtained on the basis of 100,000 samples from the selected distributions (Table 1) for equal and unequal sizes of samples. Unequal sample sizes are chosen in 1:2, 1:3 & 1:4 ratios.

Performance of the GQ Test
In general, the GQ test performed poorly in terms of its size when evaluated over the entire range of selected alternative space for all sample sizes (Table 1 & 2). At 5% level of significance, the size of the GQ test goes up to 88% against highly skewed and heavy tailed alternatives both for the equal and unequal sample sizes. The size of the test is undervalued when the alternative belongs to symmetric short tail class of distributions. The tenacious size distortions do not improve with the increase in sample size (Figure 1a & 1b). The size distortions are more than 10% and less 20% only for those alternatives where both skewness and kurtosis statistics are not far away from the normal distribution benchmark values; 0 & 3 respectively. Size distortions increase with the increase in value of either of the statistics- skewness and kurtosis.


Performance of the levene-type tests
Robust form of Levene's test proposed by Brown-Forsythe (1974), BF-test, performed exceptionally well in terms of size properties against all alternative distributions except for the multi-model distributions where the size of the test is underestimated (Table 1 & 2). The size of BF-test improves with the increase in sample size except for the cases where the alternative distribution contains few extreme outliers relative to rest of the sample data. The Levene’s test performance is not satisfactory in comparison to its robust form (BF-test) which is based on median instead of arithmetic mean. The size of the test is more than 10% when the alternative space belongs to the group with skewness more than one and kurtosis more than five. Maximum size distortion reaches to as high as 48% for sample size of 25 (Figure 2a). There is a slight improvement in size distortions as the sample increases (Figure 2a & 2b). Mostly, the significant distortions are against the alternative distributions containing outliers with high values of skewness and kurtosis.


Conclusion
Preliminary tests of homogeneity such as Goldfeld-Quandt (1965) and Levene-type tests are used to assess the assumption of homogeneity of variances which serves as the underlying assumption of many statistical procedures including Chow- test and one-way ANOVA. These preliminary tests assume the normality of data while assessing the equal population variances. Such kind of preliminary tests should be used with care as the final inferences are conditional on the performance of these tests at first stage. This study explores the impact of non-normality of the size distortions of these tests. At 5% level of significance, the size of the GQ test goes up to 88% against highly skewed and heavy tailed alternatives both for the equal and unequal sample sizes (Table 1 & 2). The size of the Levene test is more than 10% when the alternative space belongs to the group with skewness more than one and kurtosis more than five. Maximum size distortion reaches to as high as 48% for sample size of 25 (Figure 2a). Robust form of Levene's test proposed by Brown-Forsythe, BF-test, performed exceptionally well in terms of size properties against all alternative distributions except for the multi-model distributions where the size of the test is underestimated (Table 1 & 2).
In general, both the statistics, GQ & Levene tests, suffer from severe size distortions when the alternatives belong to nonnormal distributional space. However, the robust or modified form of Levene test (BF-test) perform well against the selected non-normal space except for few alternative distributions which are multi-model and contains big outliers. This study does not recommend the use of GQ & Levene test for assessing the assumption of equality of populations variances when the distribution is non-normal. Although, the modified form of Levene's test (BF-test) retains its size properties however, the use is not recommended in case the distribution is multi-model and contains relatively big outliers.
References
- Goldfeld SM, Quandt RE (1965) Some Tests for Homoscedasticity. Journal of the American Statistical Association 60(310): 539-547.
- Correia Md, Neck R, Panagiotidis T, Richter C (2008) An empirical investigation of the sustainability of the public deficit in Portugal. Springer-Verlag 5(1): 209-223.
- Zeileis A, Hothorn T (2002) Diagnostic Checking in Regression Relationships. R News 3(3): 7-10.
- Francis JR, Simon DT (1987) A Test of Audit Pricing in the Small-Client Segment of the U. S. Audit Market. The Accounting Review 6(1): 145157.
- Tang CH, Jang S (2007) Revisit to the determinants of capital structure: A comparison between lodging firms and software firms. Hospitality Management 26: 175-187.
- Banks ML, Roma PG, Folk JE (2011) Effects of the delta-opioid agonist SNC80 on the abuse liability of methadone in rhesus monkeys: a behavioural economic analysis. Psychopharmacology 16(3): 431-439.
- Baiarda FU, Grobbelaar AO (2009) A comparison of one- versus two-stage surgery in an experimental model of functional muscle transfer with interposed nerve grafting. J Plast Reconstr Aesthet Surg 62(18):1042-1047.
- Chawda M, Hucker P, Whitehuse SL, Crawford RW, English H, et al. [2009] Comparison of Cemented vs Uncemented Positioning Using an Imageless Navigation System. J Arthroplasty 24(8): 1170-113.
- Grinband J, Wager TD, Ferrera VP, Hirsch J (2008) Detection of time- varying signals in event-related fMRI designs. Neuroimage 43(3): 509520.
- Gastwirth JL, Gel YR, Miao W (2009) The Impact of Levene's Test of Equality of Variances on Statistical Theory and Practice. Statistical Science 24(3): 343-360.
- Schucany WR, Ng HK (2006) Preliminary Goodness-of-fit Tests for Normality do not validate the One-Sample Student t. Communication in Statistics- Theory and Methods 35(12): 2275-2286.
- Shapiro SS, Wilk MB, Chen HJ (1968) A Comparative Study of Various Tests for Normality. Journal of the American Statistical Association 63(324): 1343-1372.
- Pearson ES, D Agostino RB, Bowman KO (1977) Tests for departure from normality: Comparison of power. Biometrika 64(02): 231-246.
- Thadewald T, Buning H (2007) Jarque-Bera test and its competitors for testing normality- A power comparison. Journal of Applied Statistics 34(1):87-105.
- Zhang J, Wu Y (2005) Likelihood-ration tests for normality. Computational Statistics & Data Analysis 49: 709-721.
- Yazici B, Yolacan S (2007) A comparison of various tests of normality. Journal of Statistical Computation and Simulation 77(02): 175-183.
- Romao X, Delgado R, Costa A (2010). An empirical power comparison of univariate goodness-of-fit tests for normality. Journal of Statistical Computation and Simulation 80(5): 1-47.
- Yap BW, Sim CH (2011) Comparisons of various types of normality tests. Journal of Statistical Computation and Simulation 81(12): 1-15.
- Bispo R, Marques T A, Pestana D (2012) Statistical power of goodness- of-fit tests based on the empirical distribution function for type-I right-censored data. Journal of Statistical Computation and Simulation 82(2): 173-181.
- Islam T U (2017) Stringency-based ranking of normality tests. Communications in Statistics- Simulation and Computation 46(1): 655-668.


