


Influence of Parameters of Water Regime and Hydrological Changes on the Pasture
Mazurkin PM*
Doctor of Engineering, Academician of Russian Academy of Natural History � Russian Academy of Natural Sciences, Russia
Submission: January 23, 2018; Published: April 27, 2018
*Corresponding author: Mazurkin PM, Doctor of Engineering, professor, Academician of Russian Academy of Natural History u Russian Academy of Natural Sciences, member of the European Academy of Natural sciences, Volga State University of Technology, Yoshkar-Ola, Russia; Email: kaf_po@mail.ru
How to cite this article: Mazurkin PM. Influence of Parameters of Water Regime and Hydrological Changes on the Pasture. Biostat Biometrics Open Acc J. 2018; 6(4): 555695. DOI: 10.19080/BBOJ.2018.06.555695.
Abstract
According to basic tabular data (DEFRA-commissioned project BD1310. Final report to the Department for Environment, Food and Rural Affairs) steady regularities between biochemical substances of the soil of pastures and hydrological parameters of their water mode are revealed. Shows the ranking methodology affecting and dependent factors and identification of deterministic models of the relationship between the 10 factors according to the general equation consisting of the sum of two biotechnical laws.
Keywords: Pastures; Options; Rating; Mutual influence; Factor; Analysis; Patterns
Introduction
Analysis of binary relations between the 10 factors conducted on the data [1] (Appendix C. Soil parameters used in the hydrological modeling). Statistical modeling was performed by identification of General algebraic formula containing the sum of two biotechnical laws [2-6]. Factor analysis is understood as the identification of stable patterns of changes of values of each of the plurality of parameters of the studied systems, as well as mathematical relations between the factors. In comparison with the approximation in the methodology of identifying the truth of stable laws is accepted as an axiom. So there is no need of using empirical formula it is set in advance. Our method of factor analysis allows not only to establish a posteriori causality, but also to give them a quantitative characteristic, provides an assessment of the level of influence of factors (influence parameters) on the results of functioning (dependent parameters). This makes factor analysis accurate method, and conclusions quantitatively valid and meaningful in the identification of regularities.
The source data
Us, it is assumed that the factors the researcher selected and the corresponding tabular model was compiled (Table 1). Then factor analysis is the identification of the algebraic relationships between the selected factors.

This will show a specific example [1]. From Table 1 it is clear that they received some kind of grouping. Most often the grouping is performed by calculating the arithmetic mean value. If at our disposal were the primary measurement data, it would be possible to identify a more accurate statistical model on 10 indicators with consideration of the wave components. On average factors, there is a coarsening of the desired biotechnical regularities. Therefore, the wave functions do not identify, and the only deterministic model binary relations between factors. Rank relationship is not detected, for a one-dimensional relationship, the correlation coefficient is equal to 1.
General biotechnical regularity. Inductively, on the basis of tens of thousands of examples of identification of statistical selections from various areas of science, two generalized mathematical models [2-6] were revealed:
a. The generalized determined (trend) model for identification on values of factors and communications between them (it is shown in this article);
b. The general wave function of oscillatory indignation of the studied system in the form of an asymmetric wavelet signal (it is offered according to primary not grouped data).
All tendencies are modeled by binomial regularity of a look

Where,
y - Estimated parameter (parameter is an indicator of the studied system),
X - The influencing parameter, in an example of [1] 10 measured factors on 20 values.
A rating of the influencing and dependent factors
The full correlation matrix (without rank distributions) binary (between couples of mutually influencing factors) communications between 10 factors is given in Table 2. Follows from the concept of a correlative variation of Ch. Darwin that in other conditions of dwelling other combinations of values of factors of the soil can be stronger (Darwin calls factors hereditary evasion). Therefore weak factorial communications can be stronger on other objects of research. You need to compare pastures from different regions of the Earth. In the end there is a mathematical tool to compare the environmental systems of pastures between them. The coefficient of functional connectivity (in the wider biotechnological meaning - correlative variation) 10 factors equal 53.2089/102= 0.5321. This criterion of fa is applied by comparison of different phytocenoses, in particular, of pastures from different regions. According to Table 2 among the influencing factors first place was won by a factor x2 (Subsoil hydraulic conductivity), the second- (Subsoil drainable pororsity) and the third- x5 (Unsaturated Hydraulic conductivity exponent) .Among dependent factors (indicators) in ranked first factor (Aeration threshold), and the second- potential transpiration) and the third-(SMD end July).
Correlation matrix of the binary relations
We will exclude a rating and cages with units on a diagonal from data of Table 2. Then we will receive a set of coefficients of correlation at binary communications. The maximum adequacy 0.9683 is observed at dependence x = f ( The minimum coefficient of correlation 0.0033 is equal for the relation x6 = f () (Table 3). Above the known level of adequacy 0.7 there are 15 binary communications (Table 4) that makes 100 15/(102-10)=16.67%. Thus the share of the strongest binary relations is very far from a gold proportion of 61.80%. The grayed out the block from pair communications between three factors is allocated x6 x7 and x In Table 5 compact records of values of parameters of model are given (1). In total three clusters of regularities were formed.


First cluster: It possesses good symmetry (Table 6). Here the strongest biotechnical regularities settle down. In fact three factors x6 ,(Rainfall), x7 (Potential transpiration) and x8 (SMD end July) become a kernel for all set of factors. Schedules are shown in Figure 1. Because of repetitions of values only 12 points were formed of 20 names of the sites. Apparently from Figure 1, these 12 points form a big cluster of basic data of nine points located closely to each other. Thus, the clustering occurs not only on regularities, but also on values of the factors entering thesen biotechnical regularities. As a result when using all primary data there will be also wave indignations.


Second cluster: It was defined (Table 7) influence on an indicator Xo (Aeration threshold) four influencing variable x2 (Subsoil hydraulic conductivity), X4 (Subsoil drainable pororsity), x5 (Unsaturated Hydraulic conductivity exponent) and x0 (SMD end July). In Figure 2 schedules of the binary relations are shown. The coefficient of correlation is given in the right top corner of the schedule.


Third cluster: It is received by addition to the group of regularities of influence of which is available in the Table 4 (Unsaturated Hydraulic conductivity exponent) (Tablet 8). This influence on three indicators xi (Topsoil hydraulic conductivity), x2 (Subsoil hydraulic conductivity) and x5 (Subsoil drainable pororsity) happens to correlation coefficients less than 0.7. In Figure 3 schedules of eight binary relations are given. In addition to the Table 5 influence happens on formulas:
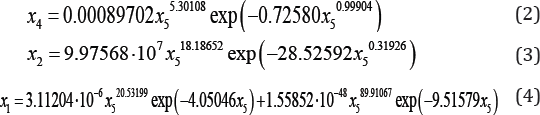

When the same design of the general model (1) specific design patterns varies greatly, so get differing in complexity graphics.
Conclusion
Between biochemical substances of the soil of pastures and hydrological parameters of the water mode always there is a homeostasis. On the general tabular model [1], after identification of strong factorial communications, it is quite possible to define optimum or rational values at all 10 factors. And then on statistical models to predict the productivity of hayfields and pastures on the rational values of the factors. You can then proceed to parametric substantiation of measures for improvement of the water regime of riparian areas.
References
- Gowing JG, Lawson CS, Youngs EG, Barber KR, Rodwell JS, et al. (2002) The Water Regime Requirements and the Response to Hydrological Change of Grassland Plant Communities. DEFRA-commissioned project BD1310. Final report to the Department for Environment, Food and Rural Affairs. Institute of Water and Environment. Silsoe. Bedford, UK, p. 98.
- Mazurkin PM (2014) Method of identification. International Multidisciplinary Scientific GeoConference Surveying Geology and Mining Ecology Management, SGEM 1(6): 427-434.
- Mazurkin PM (2015) Wavelet Analysis Statistical Data. Advances in Sciences and Humanities 1(2): 30-44.
- Mazurkin PM (2015) Invariants of the Hilbert Transform for 23-Hilbert Problem, Advances in Sciences and Humanities 1(1) 1-12.
- Mazurkin PM (2016) The Invariants of the Hilbert Transformation for Wavelet Analysis of Tabular Data. American Journal of Data Mining and Knowledge Discovery 1(1): 12.
- Mazurkin PM, Tishin DV (2015) Wave dynamics of tree-ring width of Oak. Integrated Journal of British 2(1) 55-67.


