


A Brief History of Sequence Logos
Kushal K Dey*
Department of Statistics, University of Chicago, USA
Submission: February 12, 2018; Published: April 25, 2018
*Corresponding author: Kushal K Dey, Department of Statistics, University of Chicago, 5747 S Ellis Ave, Chicago, IL 60637, USA. Tel: 312-7090680; Email: kkdey@uchicago.edu
How to cite this article:Kushal K Dey. A Brief History of Sequence Logos. Biostat Biometrics Open Acc J. 2018; 6(3): 555690. DOI: 10.19080/BBOAJ.2018.06.555690
Abstract
For nearly three decades, sequence logo plots have served as the standard tool for graphical representation of aligned DNA, RNA and protein sequences. Over the years, a large number of packages and web applications have been developed for generating these logo plots and using them to identify conserved patterns in sequences called motifs. Also, over time, we have seen a considerable upgrade in the look, flexibility of data handling and the overall scope of these plots in biological applications and beyond. Here I attempt to review some popular tools for generating sequence logos, with a focus on how these plots have evolved over time since their origin and how I view the future for these plots.
Keywords: Graphical representation; Sequence logo plots; Standard tool; Motifs; Biological applications; Flexibility of data; DNA sequence data; RNA sequence data; Visualize succinctly; Predictive power; Initial attempts; Widespread; Stylistic configurations; Multiple sequence alignment; Python library; Interdependencies; PLogo; Depletion of symbols; Alphanumeric strings; Visualizes pairwise; Oligonucleotide
Introduction
The seeds of the origin of sequence logos were planted in early 1980s when researchers, equipped with large amounts of DNA and RNA sequence data, started to develop keen interest in understanding how base (A, C, G and T/U) composition at different positions of these aligned sequences, together with the compositional patterns at neighboring positions, contribute to structural and functional properties. For example, a protein or a macromolecule tends to bind at a site in the DNA that has a characteristic pattern. Initial attempts to determine this pattern focused on building a consensus sequence from many aligned sequences-however, this approach was criticized for its lack of predictive power [1,2]. In 1986, Schneider et al. [3] proposed measures to estimate the amount of information at each site of the sequence. An obvious next step was to visualize succinctly, this flow of information along the sequence and the proportional contribution of the different bases to the information content at each position. This resulted in the origin of sequence logo plots in 1990 in a seminal work by Schneider & Stephens [4].
Despite their origin in 1990s, the current widespread use of sequence logos is largely the result of the development of software packages (in R/python) and web applications since mid to late 2000s that has made it extremely simple to generate these logos. A user currently has access to a plethora of open source tools that allow one to generate these sequence logos for DNA, RNA and protein amino acid sequences (Figure 1), using different model assumptions and stylistic configurations for the plots. They also enable one to easily identify conserved patterns in the sequences called motifs and perform downstream motif based comparisons and predictions. In the next section, we review the modeling frameworks and functionalities of some of these tools [5].
Discussion
Modelling Framework
Consider a set of n aligned sequences, with each element of the sequence corresponding to one in a cohort of J symbols. Suppose each aligned sequence is L symbols long. Then the information content at each position l = 1,2,L is defined as
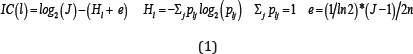
Where, Pij is the relative frequency of symbol j in position l of aligned sequences and e is a correction term adjusting for the number of samples. The value of J equals 4 for DNA (RNA) sequences corresponding to the 4 bases A, C, G, T/U and equals 20 for protein sequences, corresponding to the 20 amino acids. The height of the stack of logos at position l equals the information content IC(l) and the proportional height of each symbol Pij in the stack equals Pij Instead of the sequence data, if only the positional weights Pij are available, then the correction term e is removed from the expression of IC(l) in (1). When prior probabilities of symbols qj are known, then we replace IC(l) by KL(l;q) reported below for determining stack heights.

Software review
The first breakthrough in terms of software for creating logo plots took place in 2004 with Web Logo [6], which was designed to generate logo plots from multiple sequence alignment of DNA, RNA and proteins following the same model as (1). Figure 1c for an example protein logo plot. Web Logo provides the flexibility to run commands to generate logos from command line, or as an web application or as part of a Python library. It also has a R package interface now called RWebLogo [7]. This software is currently in its 3rd version, is still very actively maintained and has already been cited more than 6000 times.

The package that introduced R users to logo plots was seqLogo [5]. Nearly 11 years old, this package has been downloaded more than 100,000 times already. seqLogo assumes the input to be the position weight probabilities of bases obtained from aligning DNA sequences and follows the model assumptions in (1) sans the correction factor. Figure 1a for an example seqLogo plot. The web application Seq2Logo [8] improved on seqLogo in terms of the flexibility to handle sequence sets and position specific scoring matrices for both DNA, RNA and protein sequences. Seq2Logo also allows for non-uniform prior probabilities for the symbols and proposes other alternatives besides (1) and (2) to determine stack heights.

Several packages have been suggesting improvements on the model in (1). k-mer probability logo (kpLogo) uses positional interdependencies of aligned sequences to visualize conserved patterns (motifs) [9]. dagLogo can visualize conserved amino acid sequence patterns in groups defined by charge, hydrophobicity etc [10]. Web servers pLogo and iceLogo use probability based methods to determine the stack heights [11,12]. R package Logolas uses median adjustment of log positional weights to highlight both enrichment and depletion of symbols at each position in the logo plot [13].


Besides the modeling framework, in recent times, we have also observed upgrades in plotting styles, flexibility and scope of these sequence logos. Some packages ggseqlogo14 and gglogo15 have integrated ggplot2 graphics with logo plots, thereby generating fancy publication ready logo plots (Figures 1b & 1d) [14,15]. While the initial packages were restricted to using either A, C, G, T or English alphabets as symbols in a logo plot, ggseqlogo has the flexibility to use numbers and Greek letters as symbols as well. R package Logolas even allows one to plot alphanumeric strings as symbols, thereby extending the scope of logo plots beyond DNA, RNA and protein sequences to more general compositional data (Figures 1e & 1f).

One primary application of logo plots is in detecting motifs in a set of aligned sequences and comparing these motifs across many such sets. Several packages have been developed in this context. motifStack R package uses a distance metric based on STAMP to calculate distance between motifs and visualize the alignment of multiple motifs on a tree or circle based on the similarity scores [16,17]. R package DiffLogo visualizes pairwise differences in motifs corresponding to multiple sequence logos, with an intuitive visualization of the difference patterns [18]. Web application two samples Logo also uses statistical tests to compare between two aligned sets of sequences and visualize the differences [19]. R package motifcounter can match a sequence with previously known motifs and then perform enrichment of the number of motif hits based on match scores, with respect to random DNA sequences [20].
Conclusion
First conceptualized nearly 30 years back, sequence logo plots have now become the standard for visualizing patterns in aligned oligonucleotide and protein sequences. With the growing size of multiple sequence alignment data generated through wet lab experiments (HT-SELEX, Chip-Seq, Chip-chip) from various model organisms (humans, mouse, plants, fungi), the need for sequence logo plots to visualize and interpret motif patterns keeps on increasing. In fact, several current databases, for e.g. - JASPAR, ENCODE-motifs, HOCOMOCO, that host multiple alignment related data for different transcription factors and proteins, also prefer to display the sequence logo plots alongside the data [21-25].
In near future, I see the applications of sequence logos extending to identification and visualization of DNA or protein structural motifs, besides the usual sequence motifs. While the broad underlying structure of sequence logo plots is expected to stand the test of time, there is ample scope to improve on the modeling framework to highlight motifs in a batter way. Also, with so many motifs reported by various studies for the same transcription factor, I see extensive work happening in near future centering around grouping of such motifs to build more consensus sequence logos [26,27]. One thing is for certain- sequence logos are here to stay!
Acknowledgement
The author would like to acknowledge Dongyue Xie and Matthew Stephens for helpful discussions.
References
- Smith TF, Waterman MS, Sadler JR (1983) Statistical characterization of nucleic acid sequence functional domains. Nucleic acids research 11(7): 2205-2220.
- Hawley DK, McClure WR (1983) Compilation and analysis of Escherichia coli promoter DNA sequences. Nucleic acids Res 11(8): 2237-2255.
- Schneider TD, Stormo GD, Gold L, Ehrenfeucht A (1986) Information content of binding sites on nucleotide sequences. J Mol Biol 188(3): 415-431.
- Schneider TD, Stephens RM (1990) Sequence logos: a new way to display consensus sequences. Nucleic acids Res 18(20): 6097-6100.
- Bembom O (2017) seqLogo: Sequence logos for DNA sequence alignments. R package version 1.44.0.
- Crooks GE, Hon G, Chandonia JM, Brenner SE (2004) WebLogo: a sequence logo generator. Genome Res 14(6): 1188-1190.
- Wagih O (2014) RWebLogo: plotting custom sequence logos. R package version 1.0.3.
- Thomsen MCF, Nielsen M (2012) Seq2Logo: a method for construction and visualization of amino acid binding motifs and sequence profiles including sequence weighting, pseudo counts and two-sided representation of amino acid enrichment and depletion. Nucleic Acids Res 40(W1): W281-W287.
- Wu X, Bartel DP (2017) kpLogo: positional k-mer analysis reveals hidden specificity in biological sequences. Nucleic Acids Res 45(W1): W534-W538.
- Ou J, Stukalov A, Nirala N, Acharya U, Zhu LJ (2018) dagLogo: dagLogo. R package version 1.16.1.
- O'shea JP, Chou MF, Quader SA, Ryan JK, Church GM, et al. (2013) pLogo: a probabilistic approach to visualizing sequence motifs. Nat Methods 10(12): 1211-1212.
- Colaert N, Helsens K, Martens L, Vandekerckhove J, Gevaert K (2009) Improved visualization of protein consensus sequences by iceLogo. Nature Methods 6(11): 786-787.
- Dey KK, Xie D, Stephens M (2017) A new sequence logo plot to highlight enrichment and depletion. bioRxiv P.226597.
- Wagih O (2017) ggseqlogo: a versatile R package for drawing sequence logos. Bioinformatics 33(22): 3645-3647.
- Hofmann H, Hare E, GGobi Foundation (2017) gglogo: Geom for Logo Sequence Plots. R package version.
- Ou J, Wolfe SA, Brodsky MH, Zhu LJ (2018) motifStack for the analysis of transcription factor binding site evolution. Nature Methods 15(1): 8-9.
- Mahony S, Benos PV (2007) STAMP: a web tool for exploring DNA- binding motif similarities. Nucleic Acids Res 35(suppl_2): W253-W258.
- Nettling M, Treutler H, Grau J, Keilwagen J, Posch S, et al. (2015) DiffLogo: a comparative visualization of sequence motifs. BMC bioinformatics 16(1): 387.
- Vacic V, Iakoucheva LM, Radivojac P (2006) Two Sample Logo: a graphical representation of the differences between two sets of sequence alignments. Bioinformatics 22(12): 1536-1537.
- Kopp W, Vingron M (2017) An improved compound Poisson model for the number of motif hits in DNA sequences. Bioinformatics 33(24): 3929-3937.
- Sandelin A, Alkema W, Engstrom P, Wasserman WW, Lenhard B (2004) JASPAR: an open-access database for eukaryotic transcription factor binding profiles. Nucleic Acids Res 32(suppl_1): D91-D94.
- Kheradpour P, Kellis M (2013) Systematic discovery and characterization of regulatory motifs in ENCODE TF binding experiments. Nucleic Acids Res 42(5): 2976-2987.
- Kulakovskiy IV, Medvedeva YA, Schaefer U, Kasianov AS, Vorontsov IE, et al. (2012) HOCOMOCO: a comprehensive collection of human transcription factor binding sites models. Nucleic Acids Res 41(D1): D195-D202.
- Kulakovskiy IV, Vorontsov IE, Yevshin IS, Soboleva AV, Kasianov AS, et al. (2015) HOCOMOCO: expansion and enhancement of the collection of transcription factor binding sites models. Nucleic acids research 44(D1): D116-D125.
- Kulakovskiy IV, Vorontsov IE, Yevshin IS, Sharipov RN, Fedorova AD, et al. (2017) HOCOMOCO: towards a complete collection of transcription factor binding models for human and mouse via large-scale ChIP-Seq analysis. Nucleic Acids Res 46(D1): D252-D259.
- Koch CM, Andrews RM, Flicek P, Dillon SC, Karaoz U, et al. (2007) The landscape of histone modifications across 1% of the human genome in five human cell lines. Genome Res 17(6): 691-707.
- Alexandrov LB, Nik-Zainal S, Wedge DC, Aparicio SA, Behjati S, et al. (2013) Signatures of mutational processes in human cancer. Nature 500(7463): 415-421.


