


Power Analysis and Sample Size Determination in Log-Rank (Lakatos) Test
Özlem KAYMAZ1, Mustafa Agah TEKİNDAL2*, Can ATEŞ3, Ayşe Canan YAZICI GÜVERCİN44
1Department of Statistics, Ankara University,Ankara, Turkey
2Department of Biostatistics, Selçuk University,Konya, Turkey
3Department of Biostatistics, Van Yüzüncü Yil University, Turkey
4Department of Biostatistics, İstanbul Aydın University, Turkey
Submission: February 28, 2018; Published: April 04, 2018
*Corresponding author: Mustafa Agah Tekindal, Department of Biostatistics, Selfuk University, Selfuk Universitesi Alaeddin Keykubat Yerlejkesi, Selfuklu/KONYA, Turkey, Tel: +905553990599; Email: matekindal@gmail.com
How to cite this article:Özlem KAYMAZ, Mustafa Agah TEKİNDAL,Can ATEŞ, Ayşe Canan YAZICI GÜVERCİN. Power Analysis and Sample Size Determination in Log-Rank (Lakatos) Test. Biostat Biometrics Open Acc J. 2018; 6(1): 555677. DOI: 10.19080/BBOAJ.2018.06.555677
Abstract
In this study, it was aimed to investigate the method of calculating the sample size for the Log-rank test developed and proposed by Lakatos (1988) in different scenarios. To that end, Type I error was accepted as 0.05 and the constant hazard rate (p) was accepted as 0.50. The test’s power in different sample sizes was calculated using the Kaplan-Meier method. Through the Monte Carlo simulation method, each situation was repeated 10,000 times, and the results were examined. According to the simulation results the test’s power increased while the total time, sample size and incidence rate increased. When the total incidence rate was 65%, the test’s power reaches up to 80%. In this case, the sample size was above 100. When using the log-rank (Lakatos) test for survival analysis studies, the results of the asymptotic power analyzes were summarized by taking into consideration the situation, group number, total and related event frequency, hazard ratio and test power of different sample scenarios. Sincethe Lakatos method avoids extreme assumption, it provided better results in the simulation study than the other methods requiring assumption.
Keywords:Simulation; Power analysis; Lakatos method; Log-rank test; Sample size
Introduction
The period of time between a given starting time and failure of a living organism or an object is called "lifetime". It is not always possible to find out the lifetime of each patient in clinical trials. Some patients may survive although the trial came to an end, while some may quit the trial or may be excluded from follow-up for some reason. Observations whose survival times are not known due to the specified potential reasons are defined as censored observations [2]. Censored data are encountered in many areas, including medicine, biology, food, engineering and quality control. The most commonly used method for estimating the survival function of a dataset containing censored observations is the Kaplan-Meier method. Kaplan-Meier (KM) method is a non-parametric method that helps calculate the life and death functions without dividing the data on lifetimes into time intervals [3]. Kaplan-Meier method assumes that censored observations and lifetimes are independent of each other. In some cases, more than one survival function can be calculated for patients treated through different methods, and the researcher may wish to test the difference between the survival functions. One of the tests employed to compare survival functions in such cases is the Log-rank test. This test is the most commonly used method for comparing the survival curves in cases where the assumption of proportional hazard is violated [4,5].
In setting up hypotheses in a clinical trial, researchers first determine the population of the research, and then select a random sample, which they think represents the population well, and finally attempt to estimate the population. So, selecting a sample large enough to represent the population is critically important in terms of the reliability and estimation power of the study. It is desired that a planned clinical trial is of an appropriate degree of significance and has a sufficient estimation power. The estimation power is often expected to be higher than 80%. If the power of the test used is low, the test may fall short in detecting a difference that actually exists [6,7]. However, calculation of the actual power of the trial is difficult as it depends on many unknown factors such as censor rate, distribution of lost data, and survival distributions of treatment groups as well as other factors such as stop time, follow-up time, Type I and Type II error rate, and size of impact. This study aims to explore, in different scenarios, the results of the Lakatos method, which is one of the methods where power analysis and sample size calculations in comparing the survival functions of two independent groups.
Methodology
In the study, Type I error was accepted as 0.05 and the constant hazard rate was accepted as 0.50. The test's power in different sample sizes was calculated using the Lakatos method. The scenario is as follows. For instance, the sample size and time interval were accepted to be equal for the treatment groups. Parameters (e.g. 0, , p, ) were calculated for each time interval. Results obtained from repetition of each situation for 10,000 times in the Monte Carlo simulation method were examined. The sample sizes were calculated using PASS (Version 11) program [8].
Lakatos method
The method developed and suggested by Lakatos [9] is based on the assumption that the occurrence of an expected event has an equal weight in all times and that the hazard rates for individuals in different groups are the same in all times [10]. Recording time, follow-up time, and time-dependent hazard rates are used as parameters. This method is based on the Markov model with the variance of the log-rank statistic and an asymptotic mean. In this method, power can be calculated for four different cases, namely, hazard rates, median survival time, survival rate and mortality rate. In this study, the power is calculated for the hazard rates.
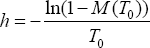
The parameter hazard rate is determined individually for the control group and the treatment group. The median survival time (MST) is determined and can be converted into hazard rates using the following relationship:

The parameter survival rate indicates the rate of survival up to T0 (constant time point) and can be converted into hazard rates using the following relationship: .
The parameter hazard rate is determined individually for the control group and the treatment group. The median survival time (MST) is determined and can be converted into hazard rates using the following relationship:

The parameter mortality rate indicates the rate of mortality up to T0 and can be convertedinto hazard rates using the following relationship:
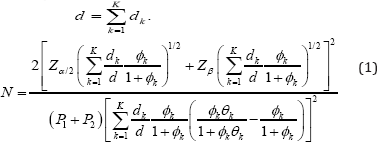
The proportional hazard assumption may be violated in calculating the power and sample size for the Log-rank statistic. In this case, the sample size formula based on the Markov Process, suggested by Lakatos, can be used. In this process, the survival model contains the following parameters: noncompliance, loss of follow-up time, drop-in, and delay of treatment's effectiveness over the course of the trial. The expected value and variance of the Log-rank statistic is calculated using the hazard rates and the risk rates in each different interval. Lakatos stated that in order to calculate the sample size, the trial period needs to be divided into N equal intervals. The interval should be long enough to fix the number of patients under risk and risk rate in each interval. The sample size required to obtain the test's power (1-p) can be calculated by Equation (1) below, where 0k is the hazard rate of the incident in the kth interval, k is the ratio of patients under risk in the two treatment groups in the kth interval, dk is the number of deaths that occurred in the kth interval, and d is defined as
Results and Discussion

The simulation results obtained are given in Table 1 & 2. The test’s power increased while the duration of the trial (recording time), sample size and incidence rate increased. The same results can be seen in Figure 1 & 2 as well. When the cumulative incidence is approximately 65% and the sample size is 100 in the recording time 1, the test's power reaches up to 80%. When the cumulative incidence is approximately 73% and the sample size is 100 in the recording time 2, the test’s power is approximately 84%. Therefore, the power value increases while the survival rate in the control and treatment groups increases.


Conclusion
Calculation of sample size is a very critical stage in clinical trials. However, this stage is often bypassed due to complexity of the procedures, which may affect the reliability of the results and result in wasted time and resources used in implementing the clinical trial. In survival analyses, log-rank test is often used to compare two treatment groups. In the present study, a simulation was carried out, and the test's power was assessed through the Lakatos method, one ofthe log-rank tests, in different sample sizes. In calculating the power of the test, the hazard rate was accepted to be 0.50 and the type I error was accepted to be 0.05. Power values were calculated for the different values of recording time, cumulative incidence, and survival rates of groups. According to the results, when the recording time is 1, the test's power is approximately 80%, whereas the recording time increases, the power value rises above 80%. Thus, the test’s power increases while the recording time increases. Also, as the cumulative incidence, sample size and survival rate increase, the test's power increases as well. As can be seen in Figure 2, when thetest’s power is above 80%, the sample size is above 100.
In a simulation study conducted by Alkan et al. [6], it was shown that as the recording time increased, the sample size increased as well in order to achieve a power above 80%. Sample sizes for achieving a power above 80% were found to be 270, 310 and 410. In their simulation study, Lakatos & Lan [1] calculated the test's power to be approximately 90% as the sample size and incidence rate increased. Therefore, they noted in their studies that the Lakatos method gives more accurate results compared to other methods, particularly under the assumption of nonproportional hazard. In conclusion, working on a sample size smaller than what is required in scientific studies decreases the power of the study results, whereas working on a sample size larger than what is required means a waste of time and resources. Thus, by determining an optimum sample size in accordance with the research hypothesis in the beginning of the study, it is possible to ensure the reliability of the study results and prevent the waste of resources.
References
- Lakatos E, Gordon Lan KK (1992) A comparison of sample size methods for the logrank statistic. Stat Med 11(2): 179-191.
- Kleinbaum DG, Klein M (2005) Survival Analysis: A Self-Learning Text, Springer, New York, USA.
- Özdamar K (2003) SPSS ile Biyoistatistik, 5.Baski, Kaan Kitabevi, Eskijehir.
- Moreau T, Maccario J, Lellouch L, Huber C (1992) Weighted log-rank statistics for comparing two distributions. Biometrika 79(1): 195-198.
- Lee JW (1996) Some versatile tests based on the simultaneous use of weighted log-rank statistics. Biometrics 52: 721-725.
- Schlotzhauer S (2007) Elementary Statistics Using JMP. Cary, NC: SAS Institute Inc. USA.
- Alkan N, Terzi Y, Alkan BB (2015) Power analysis for log rank test and calculation of sample width IAAOJ, Scientific Science 3(2): 19-28.
- Hintze J (2008) PASS 2008 NCSS, LLC. Kaysville, Utah USA.
- Lakatos E (1988) Sample Sizes Based on the Log-Rank Statistic in Complex Clinical Trials. Biometrics 44: 229-241.
- Bland JM, Altman DG (2004) The Log rank test. British Medical Journal 328(7447): 1073-1073.


