


New Perspective on the Determination of the Number of Japanese Patients in Multiregional Clinical Trials
Seung-Ho* Kang and Ji-Hun Bae
Department of Applied Statistics, Yonsei University, Korea
Submission: February 2, 2018; Published: February 27, 2018
*Corresponding author: > Seung-Ho Kang, Department of Applied Statistics, Yonsei University , Seoul, Korea, 120-749, Tel: 82-2-2123-2548, Fax: 82-2365-2535; Email: seungho@yonsei.ac.krHow to cite this article: Seung-Ho Kang, Ji-Hun Bae. New Perspective on the Determination of the Number of Japanese Patients in Multiregional Clinical Trials. Biostat Biometrics Open Acc J. 2018; 5(3): 555663.DOI:10.19080/BBOAJ.2018.05.555663
Abstract
Through Method 1, the Japanese government wants to acquire a sufficient number of Japanese subjects to determine whether the effect of the test treatment is consistent between Japanese and non-Japanese. However, the Japanese government did not provide clear parameter-based criteria regarding the consistency of the effect of the test treatment between Japanese and non-Japanese. Thus, the goal of the evaluation by Method 1 remains unclear. Currently, it is impossible to interpret Method 1 within a traditional statistical framework. Thus, the purpose of this paper is to propose a new perspective on Method 1 within a traditional statistical framework. To do this, the paper proceeds as follows. First, we propose clear parameter-based criteria for the claim that the effects of the test treatment are consistent between Japanese and non-Japanese.
Second, we treat Method 1 as an exploratory hypothesis testing for the claim that the effects of the test treatment are consistent between Japanese and non-Japanese. Third, we discuss the benefits of accepting Method 1 as a means of exploratory hypothesis testing. If the proposal in this paper is accepted, it will become possible to study the pros and cons of Method 1, to suggest a better method, and to compare the statistical properties of Method 1 with those of other methods.
Keywords: Bridging Study; Assurance Probability; Sample Size Calculation; Type I Error; Power
Introduction
A multiregional trial (MRCT) is a trial conducted simultaneously in more than one region based on a common protocol [1-3]. Recently, multiregional trials have become more popular as part of the effort to speed up drug development to allow faster access to drug products globally for patients. Given that multiregional trials pose significant regulatory challenges, a considerable number of studies have been conducted regarding statistical issues pertaining to multiregional trials [4-17].
Although there are various ways to classify studies on MRCT, one of them is from which perspective to handle MRCT: a global perspective and a regional perspective. From the global perspective, we study how to plan, conduct, and analyze MRCTs overall such as how to write the protocol of the MRCT, and how to allocate appropriate sample sizes to each region. On the other hand, the regional point of view considers MRCTs from the perspective of a regional regulatory agency. From the regional perspective, we are more interested in extrapolating the overall result to the target region by securing a sufficient number of patients from the target region rather than planning the overall MRCT [18-23]. Small regions or small countries are more interested in the regional perspective than the global perspective, because there are more cases for which it must be considered whether they can apply the overall result to the target region as opposed to planning and conducting the MRCT overall. Therefore, this study utilizes a regional perspective with the aim of helping small regions or countries such as Japan, Korea, and Taiwan.
It is important to allocate a sufficient number of patients to each region in a MRCT in order to assess the consistency of the treatment effect across regions, and several studies have investigated this issue [19-31]. In this paper, we will discuss what has been termed Method 1, which was originally proposed by the Japanese government. The motivation behind this study as follows. First, Method 1 assigns a sample size to a target region from a regional perspective. Second, although several studies describe approaches that assign a sample size to each region in a MRCT, these methods are only at the level of research papers, whereas Method 1 is formulated as a guideline officially issued by the Japanese government and is often used in practice.
However, there are not many studies of Method 1. Ko et al. [27] derived an exact mathematical formula to determine the assurance probability which can be used with Method 1. Quan et al. [23] studied sample size allocation methods for continuous, binary and time-to-event variables. However, these studies do not examine Method 1 within the traditional statistical framework. In fact, there is currently no way to assess Method 1 within the traditional statistical framework. Therefore, no research has critically evaluated Method 1or has sought to determine whether there is room for further improvements. Therefore, the purpose of this study is to propose a new perspective within the framework of traditional statistics, which treats Method 1 as a means of exploratory hypotheses testing. We also discuss the benefits that can be gained by accepting this new perspective.
Notation
In this paper, we deal with only two-arm placebo-controlled parallel Phase III clinical trials for the sake of simplicity. Let X and Y denote the continuous primary endpoints for patients receiving the test product and a placebo control, respectively. It is assumed that large values represent better efficacy. We assume that

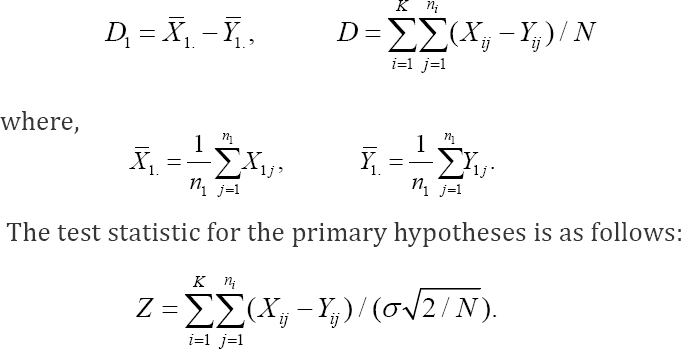
where, the population variance σ2 is assumed to be known, although σ2 is actually unknown and must be estimated from the data. The primary purpose of multiregional trials is to test the overall treatment effect globally. Therefore, the primary hypothesis is given by

where, 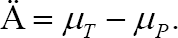 The secondary purpose of multiregional trials is to assess the consistency of the treatment effect across regions. The key argument of this paper is to consider Method 1 as a means of exploratory hypothesis testing to assess the consistency of the treatment effect across regions. The secondary hypotheses associated with the secondary purpose are described in section 5. For a given significance level
α, power 1 - β and an expected treatment effect Δ = δ the total sample size for each group is given by
The secondary purpose of multiregional trials is to assess the consistency of the treatment effect across regions. The key argument of this paper is to consider Method 1 as a means of exploratory hypothesis testing to assess the consistency of the treatment effect across regions. The secondary hypotheses associated with the secondary purpose are described in section 5. For a given significance level
α, power 1 - β and an expected treatment effect Δ = δ the total sample size for each group is given by
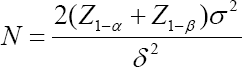
where, Z1—α is the 1 — αth percentile of the standard normal distribution [32]. However, calculating the total sample size is outside of the scope of this paper. The main focus here is to determine the number of patients in the target region (for example, Japan) when the total sample size is given. The number of regions in multiregional trials is denoted by K and the proportion of patients out of 2N in the ith region is denoted by pi, i = 1,2,...,K,, where  The number of patients per group in the ith region is represented by ni = piN. In the ith region let Xij and Yir be the primary continuous endpoints for patients j and r receiving the test product and the placebo control, respectively. For convenience, we assume that the first region (i = 1) is the target region (for example, Japan). Let D1 be
the observed mean difference for the first region and D be the observed mean difference for all regions. Hence,
The number of patients per group in the ith region is represented by ni = piN. In the ith region let Xij and Yir be the primary continuous endpoints for patients j and r receiving the test product and the placebo control, respectively. For convenience, we assume that the first region (i = 1) is the target region (for example, Japan). Let D1 be
the observed mean difference for the first region and D be the observed mean difference for all regions. Hence,
Review of method 1
Multiregional trials make it possible to demonstrate the efficacy of a drug in all regions, while regional regulatory agencies can evaluate the possibility of extrapolating the overall results to their own region. Accordingly, as noted in section 2, it is important to understand that there are two main aims in multiregional trials:
I. The primary aim is to show the overall treatment effect in all regions.
II. The secondary aim is to assess the consistency of the treatment effect across regions.
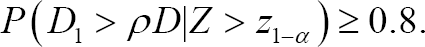
In Section 1, we stated that there are two perspectives with regard to a MRCT: the global and the regional perspectives. To achieve a secondary aim from a global perspective, the entire sample should be appropriately allocated to each region, rather than focusing only on specific regions. On the other hand, in order to achieve a secondary aim from a regional perspective, rather than allocating the entire sample to each region appropriately, each regional regulatory agency is interested in securing sufficient numbers of subjects in their own region. In section 1 we noted that this paper utilizes a regional perspective rather than a global perspective. According to the regional perspective, the secondary aim is to assess the consistency of the treatment effect between the target region and non-target region. Method 1 proposed by the Japanese government is a sample size allocation method for evaluating the secondary aim from a regional point of view. Method 1 requires that the number of Japanese patients should be determined such that we have a sufficiently high probability that the ratio of the treatment effect estimate for Japan to that for all regions exceeds a given number, which is between zero and one (MHLW 2007). That is, the goal is to determine n1 or p1 such that
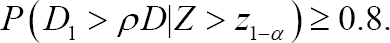
Here, we consider the probability of D1 > ρD given that the overall result is significant (Z > z 1—α) because, if Z < z 1—α it is meaningless to evaluate D1 > ρD. Method 1 implies that the Japanese government would like to include a sufficient number of Japanese patients to check the assumption of a homogeneous treatment effect between the target region and non-target region when the overall result is shown to be significant, although such an assumption is made during the planning stages of multiregional trials In other words, although the Japanese government accepts the assumption of a homogeneous treatment effect between the target region and non-target region before multiregional trials begin, they are not completely sure if the assumption is valid. Therefore, the Japanese government would like to check the assumption by including a sufficient number of Japanese patients after the multiregional trials end.
If the Japanese government undoubtedly accepts the assumption of a homogeneous treatment effect between the target region and non-target region, there is no reason to recruit Japanese patients. In an extreme case, even if multiregional trials are conducted without any Japanese patients, the Japanese government should apply the global result to the Japanese population without any doubt, as they trust the homogeneous assumption completely.
Method 1 as a means of exploratory hypotheses testing
In modern statistics, two statistical approaches have been used to calculate sample sizes. In the first method, the sample size is computed such that the width of a confidence interval is equal to a given length [33]. The first method is widely used in survey sampling, in which estimations of unknown parameters are the most important tasks. In the second method, the sample size is calculated such that the power of a hypothesis test under an alternative hypothesis is equal to a given value, such as 80%. The second method has been widely employed in clinical trials in which testing primary hypotheses is the most important task.
Method 1 described in section 3 is a sample size calculation method for Japanese patients in multiregional clinical trials. How can we interpret Method 1? There are three possible interpretations. The first interpretation is that Method 1 is a method involving the use of confidence intervals. However, it is obvious that Method 1 does not use confidence intervals, thus the first interpretation appears to be inappropriate. The second interpretation is that Method 1 is a means of hypothesis testing. The third interpretation is to treat Method 1 as a new perspective by developing a new statistical theory without the use of confidence intervals or hypothesis testing. However, no attempt has been made to develop this new statistical theory. Given that the first interpretation and the third interpretation are not possible in this way, if we want to explain Method 1 within the framework of traditional statistical theory, we can only consider Method 1 as a means of a hypothesis testing. In other words, unless Method 1 is considered as a means of hypothesis testing, it is impossible to understand Method 1 within the framework of modern statistics.
Hence, in this paper, we assume that Method 1 is a sample size calculation method such that the power of a hypothesis test under an alternative hypothesis is equal to a given value, such as 80%. If we accept this claim, in order to proceed with this argument, we require statistical hypotheses, the test statistics, and a rejection region for Method 1. Therefore, it is necessary to consider what these statistical hypotheses, the test statistic, and rejection for Method 1 are because the statistical hypothesis for Method 1 is not established in advance, there may be a variety of ways to express the secondary aim that the effect of the test treatment is consistent between the target region and non-target region in statistical hypothesis testing. First, the claim that the effect of the test treatment is consistent between the target region and non-target region can be established as either the null hypothesis or the alternative hypothesis [34]. In addition, there may be various forms of concrete hypotheses depending on each method. It is important to understand that the conclusions differ completely depending on the hypothesis behind the claim of consistency of the treatment effect. Moreover, because this hypothesis is an exploratory analysis not previously described in the protocol, it is my claim that Method 1 is viewed as only a means of exploratory hypothesis testing and, not a means of confirmatory hypothesis testing.
The Japanese government did not claim that Method 1 engaged in statistical hypothesis testing. In addition, the Japanese government has not provided clear parameter-based criteria for the consistency of the test treatment between the target region and non-target region. Therefore, currently, when using Method 1, even if the condition of D1 > pD is met, we cannot accurately describe our conclusion using parameters. Moreover, we cannot assess the probability that our conclusions are incorrect. Regarding this point, Chen et al. [35] stated the following:
"The definition of a false positive rate for the PMDA methods is less clear because there are no true parameter-based consistency criteria; hence, it is unclear what is meant when one states that a regional effect is consistent."
"Statistical power for the PMDA method is less well defined given that a real regional difference is unclear under PMDA methods. Instead, a different probability measure, assurance probability is considered."
According to a personal conversation with a senior statistician in PMDA, it was argued that Method 1 is not a means of statistical hypothesis testing but is intended only for sample size calculations. However, we must rethink why the Japanese government devised Method 1 for recruiting a sufficient number of Japanese patients. The reason for this is clearly that it is to evaluate whether the treatment effect is consistent between the target region (Japan) and non-target region. If the person who initially proposed Method 1 is a statistician, he (or she) should have given clear parameter-based criteria for asserting that the treatment effect is consistent between the target region and nontarget region, but this person did not. Hence, Method 1 became statistically ambiguous with regard to what it evaluates.
Therefore, in this paper, we present clear parameter-based criteria for asserting that the treatment effect is consistent between the target region and non-target region. We also suggest Method 1 as a means of exploratory hypothesis testing that tests whether the criteria are satisfied. Only then we can better understand the statistical properties of Method 1, and, if there are any shortcomings of Method 1, we can study and propose a better approach. At present, there is no way to study whether Method 1 is suitable or unsuitable.
Another factor must be mentioned here. Even if the treatment effect between the target region and non-target region is judged to be consistent, it does not guarantee the approval of the test treatment from the target regulatory agency, as the marketing authorization for the test treatment involves a decision that combines all results, such as the statistical significance, clinical significance, and a benefit-risk analysis. What statisticians can do during this process is to study a statistical methodology that can help to assess the level of statistical significance.
Secondary hypotheses and corresponding test statistics
If you agree with the contents of section 4 and consider Method 1 as a means of exploratory hypothesis testing, we must think about how to establish the null hypothesis and the alternative hypothesis. It should be appreciated that the method of establishing a hypothesis can vary widely, as described in Section 4. In order to establish the appropriate null hypothesis and alternative hypothesis of Method 1, first, let Δ1be the effect size of the test treatment in the target region as follows.
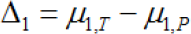
where, μ1,T, and μ1,Pare the effect sizes of the test treatment and the placebo in the target region. Because Method 1 requires a greater probability D > ρD, in this paper, we suggest that Δ1, >ρΔ is treated as the parameter-based criteria of the consistency of the treatment effect across regions, as D1 and D are estimators of and The proposed criteria of the consistency: Δ1, > Δ1
Moreover, given that the Japanese government appears to want to prove that Δ1, >ρΔ through MRCT, it appears to be natural to use the following secondary hypothesis.

It is also natural to establish D1 > ρD as the rejection region from the form of the alternative hypothesis in (2). Although it was mentioned in Section 4, we would like to reemphasize that there are a variety of ways to establish a hypothesis.The hypotheses in (2) represent only a single method. Tanaka et al. [34] & Chen et al. [35] discussed various means of establishing a hypothesis of the consistency of the treatment effect across regions. Let us call the type I and type II error associated with above secondary hypotheses as the regional type I and type II errors. The regional type I error is then, in fact, an error of concluding that the efficacy of the test treatment in Japan is noninferior to the overall effect, although it is inferior. This regional type I error is fatal to the Japanese government.

The regional type II error is, in fact, an error which concludes that the efficacy of the test treatment in Japan is inferior to the overall effect, despite the fact that it is non-inferior.

For the Japanese government, this regional type I error is more serious than a regional type II error.
The benefits of considering method 1 as a means of exploratory hypothesis testing and corresponding test statistics
In section 4, we suggested that Method 1 should be considered as a means of exploratory hypotheses testing, and in section 5 we suggested specific hypotheses and test statistics. In Section 6 we will examine the benefits to be gained from these new proposals.
The calculation of the number of Japanese patients based on the regional power
Method 1 seeks to determine the number of Japanese patients which meet the following conditions:
While this proposal seems intuitively sound, there is a lack of a detailed account of the statistical basis on which the Method 1 was proposed. However, according to the method proposed in this paper, Method 1 calculates the number of Japanese patients such that the regional power associated with the secondary hypothesis is greater than or equal to 80%.

In other words, if the proposal in this paper is accepted, a theoretical explanation of Method 1 becomes possible. The possibility of this theoretical explanation is very important, as within this framework we can now study the pros and cons of Method 1, suggest a better method, and compare the statistical properties with those of other methods. This provides a theoretical basis for further developing Method 1 statistically. Another factor to consider in connection with the regional power is the assurance probability. The assurance probability for the criterion of Dl > ρD is defined as follows:
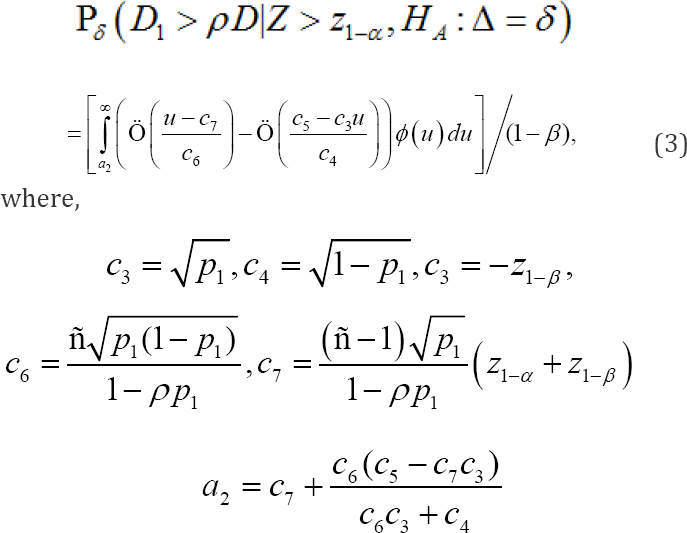
In these equations, α and β denote the overall significance leveland the type II error rate, respectively. It is important to note that the assurance probability depends only on α,β,ρ, p1 and that it does not depend on N,σ or Δ Ko et al. (2010] proposed a method for determining p1, the proportion of patients out of the 2N patients in the target region, to ensure that the assurance probabilities for the criteriaD1 > ρD under the primary alternative hypothesis(HA:Δ=δ) were maintained at a desired level, say 80%. However, Ko et al. [27] claim that to evaluate D1ρD, under the primary alternative hypothesis is inappropriate, (HA:Δ=δ) because the assurance probability does not depend on5 under the primary alternative hypothesis In fact, Ko et al. [27] evaluate the assurance probability under the assumption of a homogeneous treatment effect across the target region and non-target region. Because the assumption of a homogeneous treatment effect across the target region and nontarget region is a type of secondary alternative hypothesis, the assurance probability is a form of regional power. Therefore, the assurance probabilities studied thus far can be brought into and explained within the framework of the regional power.
Calculating the regional type I error
As described in Section 6.1, if we use the regional power to calculate the Japanese sample size, the regional type II error is known. However, a more serious error for the Japanese government is the regional type I error. Before the proposal in this paper, it was impossible to assess how likely the Japanese government was to commit this serious error, but it is now possible if we accept the proposal in this paper. Specifically, the regional type I error can be calculated by the equation below, and the specific values are shown in Table 1. From Table 1, the regional type I error rate is 55% when  and σ=1The regional type I error rate increases as the value of pl does. I do not think it is necessary to give too much meaning to these results (for example, 55% type I error rate), because the secondary hypotheses are not pre-specified, and there are various ways to construct the secondary hypotheses. What we want to argue in this paper is to take the view that Method 1 is considered as a means of exploratory hypothesis testing. If this consideration is accepted, then further research on the most appropriate form of secondary hypotheses can be performed in the future.

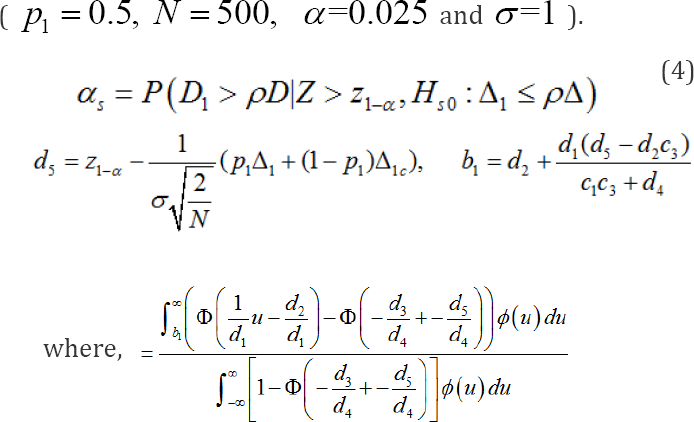
where, Δlcis the effect size of the test treatmentfor the nontarget region. Appendix A shows the following relationship,
where,λ1 is the ratio of the total number of patients in thetarget region to the total number of patientsin all participating regions.The mathematical derivation of the regional type I error rate in (4] is provided in Appendix B. When Δ1=Δlc,, we can show that (3) and (4) are identical by checking the following:
C3 = d3 C4 = d4 C5 = d5 C6 = d1 C7 = d2
The regional type I error rate in (4] depends N,α, ρ,Δ1,Δ1c,Δ1 and σ. However, it does not depend on β
The determination of ρ
In Method 1, there is no known statistical method to determine ρ thus far. However, if we adopt Method 1 as a means of exploratory hypothesis testing, we can calculate ρ as shown below. The idea is to treat ρ as a critical value. In general, the critical value of a statistical hypothesis testing procedure is determined under the null hypothesisin order to keep the type I error rate under the level of significance considering that the type I error is more serious than the type II error. By adopting a similar idea, we determine p in orderto keep the regional type I error rate under some desirable level. From section 6.2, the regional type I error depends on N,α, ρ,Δ1,Δ1c,Δ1 and of these,N,α, and σ are set to constant values when calculating the total sample size in MRCT. Therefore, the values controllable by the target regulatory agency are only ρ, Δl Δlc and p1. In this subsection, we consider the following two cases depending on how the value of p1 is determined.
In the first case, the value of pl is determined on non- statistical grounds (such as the speed and cost of patp nt recruitment) before the start of the multi-regional clinical trial. In the second case, there is no pre-specified figure for the number of patients in the target region, and the value of is only known once the multi-regional trial ends. In the two cas es above, because the value ofp1 is known after the end of the multi- regional trial, the determination of the critical value (ρ) leads to the determination of the value of the regional type I error (αs) for the given values of-Δ1 and Δ1cu and vice versa. In other words, if a regional regulatory agency determines the regional type I error rate (αs.) for given values of Δ1and Δ1, on clinical or regulatory grounds, we can obtain the value of the critical value (ρ) and vice versa.
Conclusion
In this paper, we proposed a new viewpoint to consider method 1 as an exploratory hypothesis test, after which we discussed the benefits of this new perspective. Due to this new viewpoint, method 1 can be handled within the traditional statistical framework. We hope that this new perspective becomes a catalyst for studying the statistical properties of Method 1, and hopefully more research will be done to ensure better MRCTs.
Acknowledgement
This research was supported by the Basic Science Research Program through the National Research Foundation of Korea (NRF) funded by the Ministry of Education (2016R1D1A1A09916819).
References
- International Conference on Harmonization of Technical Requirements for Registration of Pharmaceuticals for Human Use (2006) Q&A for ICH E5 Guideline on Ethnic Factors in the Acceptability of Foreign Data.
- International Conference on Harmonization of Technical Requirements for Registration of Pharmaceuticals for Human Use (2016) General Principles for Planning and Designing Multi-Regional Clinical Trials.
- Ministry of Health, Labor, and Welfare of Japan (2007) Basic Principles on Global Clinical Trials. Tokyo: MHLW.
- Ando Y, Hamasaki T (2010) Practical issues and lessons learned from multiregional clinical trials via case examples: A Japanese perspective. Pharma Stat 9(3): 190-200.
- Chow SC, Chiang C, Liu JP, Hsiao CF (2012) Statistical methods for bridging studies. J Biopharm Stat 22(5): 903-915.
- Chen YF, Wang SJ, Khin NA, Hung HMJ, Laughren T (2010) Trial design issues and treatment effect modelling in multiregional schizophrenia trials. Pharmaceutical Statistics 9: 217-229.
- Chen J, Quan H, Binkowitz B, Ouyang SP, Tanaka Y, Li G (2010b) Assessing consistent treatment effect in a multi-regional clinical trial: A systematic review. Pharm Stat 9(3): 242-253.
- European Medicines Agency (2009) Reflection paper on the extrapolation of results from clinical studies conducted outside the EU to the EU-population.
- Girman CJ, Ibia E, Menjoge S, Chen J, Agarwal A (2011) Impact of different regulatory requirements for trial endpoints in multiregional clinical trials. Drug Information Journal 45: 587-594.
- Hung HMJ, Wang SJ, O Neill RT (2010) Consideration of regional difference in design and analysis of multi-regional trials. Pharm Stat 9(3): 173-178.
- Liu JP, Lin JR, Hsieh E (2009) A non inferiority test for treatment-by- factor interaction with application to bridging studies and global trials. Drug Information Journal 43(1): 11-16.
- Liu JP, Chow SC, Hsiao CF (2013) Design and Analysis of Bridging Studies.CRC Press.
- Tsou HH, Chien TY, Liu JP, Hsiao CF (2011) A Consistency approach to evaluation of bridging studies and multi-regional trials. Stat Med 30(17): 2171-2186.
- Tsou HH, Tsong Y, Chang WJ, Dong X, Hsiao CF (2012) Design and analysis issues of multi-regional clinical trials with different regional primary endpoints. J Biopharm Stat 22(5): 1051-1059.
- Quan H, Li M, Chen J, Gallo P, Binkowitz B, et al. (2010) Assessment of consistency of treatment effects in multi-regional clinical trials. Drug Information Journal 14: 617-632.
- Quan H, Li M, Shih WJ, Ouyang SP, Chen J, et al. (2013) Empirical shrinkage estimator for consistency assessment of treatment effects in multi-regional clinical trials. Stat Med 32(10): 1691-1706.
- Quan H, Mao X, Chen J, Shih W J, Ouyang SP, et al. (2014) Multi-regional clinical trial design and consistency assessment of treatment effects. Stat Med 33(13): 2191-2205.
- Chen YH, Wu YC, Wang MA (2009) Bayesian approach to evaluating regional treatment effect in a multiregional trial. J Biopharm Stat 19(5): 900-915.
- Chen X, Lu N, Nair R, Xu Y, Kang C, et al. (2012a) Decision rules and associated sample size planning for regional approval utilizing multiregional clinical trials. J Biopharm Stat 22(5): 1001-1018.
- Huang Q, Chen G, Yuan Z, Lan G (2012) Design and sample size considerations for simultaneous global drug development program. Journal of Biopharmaceutical Statistics 22(5): 1060-1073.
- Tsong Y, Chang WJ, Dong X, Tsou HH (2012) Assessment of regional treatment effect in a multiregional clinical trial. J Biopharm Stat 22(5): 1019-1036.
- Tsou HH, Chow SC, Lan KKG, Lui JP, Wang M, et al. (2010) Proposals of statistical consideration to evaluation of results for a specific region in multiregional trials - Asian perspective. Pharm Stat 9(3): 201-206.
- Quan H, Zhao PL, Zhang J, Roessner M, Aizawa K (2010) Sample size considerations for Japanese patients in a multi-regional trail based on MHLW guidance. Pharm Stat 9(2): 100-112.
- Chen CT, Hung HMJ, Hsiao CF (2012) Design and evaluation of multiregional trials with heterogeneous treatment effect across regions. Journal of Biopharmaceutical Statistics 22(5): 1037-1050.
- Ikeda K, Bretz F (2010) Sample size and proportion of Japanese patients in multi-regional trials. Pharm Stat 9(3): 207-216.
- Kawai N, Stein C, Komiyama O, Li Y (2008) An approach to rationalize partitioning sample size into individual regions in a multiregional trial. Drug Information Journal 42: 139-147.
- Ko FS, Tsou HH, Liu JP, Hsiao CF (2010) Sample size determination for a specific region in a multi regional trial. J Biopharm Stat 20(4): 870885.
- Li M, Quan H, Chen J, Tanaka Y, Ouyang P, et al. (2012) R functions for sample size and probability calculations for assessing consistency of treatment effects in multi-regional clinical trials. Journal of Statistical Software 47: 1-10.
- Tsou HH, Hung HMJ, Chen YM, Huang WS, Chang WJ, et al. (2012) Establishing consistency across all regions in a multi-regional clinical trial. Pharm Stat 11(4): 295-299.
- Uesaka H (2009) Sample size allocation to regions in a multiregional trial. J Biopharm Stat 19(4): 580-594.
- Wu YJ, Tan TS, Chow SC, Hsiao CF (2014) Sample size estimation of multi-regional clinical trials with heterogeneous variability across regions. J Biopharm Stat 24(2): 254-271.
- Chow SC, Shao J, Wang H (2003) Sample size calculations in clinical research.CRC press.
- Cochran WG (1977) Sampling Techniques, 3rd edition. John Wiley & Sons, USA.
- Tanaka Y, Li G, Wang Y, Chen J (2012) Qualitative consistency of treatment effects in multi-regional clinical trials. J Biopharm Stat 22(5): 988-1000.
- Chen J, Quan H, Gallo P, Meajoge S, Luo X, et al. (2011) Consistency of treatment effect across regions in multi-regional clinical trials, Part I: Design Considerations. Drug Information Journal 45: 595-602.


