


Interval Estimation and Inferential Procedures for the Measures of Hybrid Roc (HROC) Curve
Balaswamy S1 and Vishnu VR2*
1Department of Statistics, Indira Gandhi National Tribal University, India
2Department of Statistics, Podicherry University, India
Submission: September 8, 2017; Published: October 18, 2017
*Corresponding author: Vishnu Vardhan R, Department of Statistics, Podicherry University, India, Email: rvvcrr@gmail.com
How to cite this article: Balaswamy S, Vishnu VR. Interval Estimation and Inferential Procedures for the Measures of Hybrid Roc (HROC) Curve. Biostat Biometrics Open Acc J. 2017; 3(4): 555617. DOI: 10.19080/BBOAJ.2017.03.555617.
Abstract
Receiver Operating Characteristic (ROC) Curve is used to classify the individuals into one of the two populations, which underlie a particular distribution. In real life scenario, we come across situations where two populations will follow different distributions. Taking this into consideration, the ROC Curve was proposed using Half Normal and Exponential distributions for normal and abnormal populations respectively; hence named as Hybrid ROC (HROC) Curve. In this paper, the measures of HROC Curve and their corresponding confidence intervals are derived and evaluated. The accuracy of a test can be explained by the measures of ROC Curve and a better test procedure can be identified through inferential procedures. In order to explain the behaviour of HROC Curve and to identify the better test, simulation studies are conducted at various sample sizes with different combinations of scale parameters of both populations. To demonstrate the utility of HROC methodology in practice, APACHE IV score is used for early detection of mortality rate and the prognosis of the disease.
Keywords: Optimal Threshold; Youden's Index; AUC; HROC Curve
Introduction
The Receiver Operating Characteristic (ROC) Curve originated during Second World War to analyse radar signals by observing the relationship between signal and noise [1]. The framework of ROC Curve has a wide spread of interdisciplinary applications such as human perception, decision making [2], industrial quality control [3], military monitoring [4] etc. In later years, the applications of ROC Curve branched to many other fields such as experimental psychology, engineering, machine learning, biosciences etcetera [5]. Leo Lusted [6] introduced the concept of ROC Curve analysis into medicine for analysing radiographic images. Smoothed ROC Curves were fitted when the populations have certain probability distribution, such as Binormal and Bi- Logistic models [2]. Further, Maximum Likelihood Estimation of ROC Curve from categorical confidence rating data was first used by Dorfman & Alf [7] based on the conventional Binormal model. In particular, the conventional Binormal ROC Curve and its extension to continuously distributed data have been applied successfully to a wide variety of problems in Radiology [8,9]. The Binormal model assumes independent Normal distributions with different population means and variances, other models considered in the literature include Bi-Logistic [10], BiExponential model [11]. Campbell & Ratnaparkhi [12] derived an ROC model by considering that the rating data follows Lomax Distribution. Further, Dorfman et. al. [13] proposed a model which assumes Gamma Distributions.
In most of the situations, the distribution of abnormal population tends to follow some distribution other than normal due to high variability in data. In the context of classification, the variability exists in both the populations but larger variability is usually observed to a maximum extent in abnormal population. Apart from this, data so collected always do not explain the nature of normal distribution but tend to have some skewed nature that leads to skewed distributions such as Exponential, Rayleigh, Weibull and many more. Therefore, proposed ROC Curve is based upon the skewed distributions Half Normal and Exponential distributions and hence it is named as Hybrid ROC (HROC) Curve [14]. In the present work, it is assumed that the test scores of normal and abnormal populations follow Half Normal and Exponential distributions. The motivation for considering Exponential is its mathematical approximations, where it can easily be derived from all other distributions and also has a mathematical ease over other distributions. Moreover, the concept of ROC evolved by analyzing radar signals (Signal Detection Theory) and an important application of Exponential distribution is to analyze and assess the signals received. Hence, Exponential distribution is an appropriate distribution to explain the spread in the abnormal population and helps in identifying the exact status of the objects/individuals. Further, another type of HROC Curve along with its confidence intervals is developed by considering Half Normal and Rayleigh distributions [15].
If the test scores of normal and abnormal populations follow different distributions, then the bi-distributional ROC forms will not produce reliable outputs. For instance, consider that a marker, namely, APACHE (Acute Physiology and Chronic Health Evaluation) II, is used to predict the mortality status of patients who are admitted into ICU. The pattern of APACHE scores for live and dead patients' does not possess normality and explains skewed nature of the data. In this dataset, the normal and abnormal populations follow Half Normal and Rayleigh distributions respectively. From this discussion about the practical tractability of data, the conventional binormal ROC model will fail or overestimate the accuracy (AUC) and intrinsic measures (sensitivity and specificity) and threshold. Hence, the main concentration of this paper lies in handling the situations when distributions of two populations are different (In particular Half Normal and Exponential distributions of normal and abnormal populations). For example, this paper adopts a real dataset which is about the ICU scoring system of mortality rate and this scoring system evaluates the critical conditions of a patient who admits in ICU, namely, APACHE IV, since the normal and abnormal populations follow Half Normal and Exponential distributions respectively. The remaining details have been given about this dataset and goodness of fit of the data is detailed in the results section.
The ROC Curve is a classification technique used to assess the performance of a test or a procedure. An individual will be classified into one of the two groups by means of a threshold. A threshold is said to be an optimal, if it provides maximum accuracy with more number of abnormal (sensitive) cases. In order to identify the optimal threshold, the most familiar and widely accepted measures are Area under the Curve (AUC) and Youden's Index. Further, the ROC Curve is defined as a graphical representation of 1-Sp (False Positive Rate, FPR) as a function of Sn (True Positive Rate, TPR) across all possible thresholds, where Sn is the probability that a truly abnormal individual has a positive test result, and Sp is the probability that a truly normal individual has a negative test result. The Youden's Index (J), is a measure of overall diagnostic effectiveness, first introduced to the medical literature by Youden [16]. The Youden’s Index provides a pair of Sensitivity and Specificity at each point of threshold and these intrinsic measures are inversely related to each other. More importantly, J occurs at the threshold that optimizes the biomarkers differentiating ability when equal weight is given to sensitivity and Specificity [16-19]. Conventionally, J is found by evaluating sensitivity and specificity for all possible thresholds, with the optimal threshold corresponding to Youden's Index.
Methods of evaluating and comparing the performance of diagnostic tests areof increasing importance as new tests are developed and marketed. Therefore, to identify a better test procedure among several or to test the significance of the estimated accuracy of a test with standard test or a procedure, the statistical significance tests and comparison procedures were developed. Greenhouse & Nathan [20] provided significance test procedures to compare diagnostic tests for independent and dependent samples. Gourevitch & Galanter [21] proposed a statistical significance test for pair wise comparisons of ROC curves based on single parameter estimated from a single operating point. The statistical significance tests were derived and evaluated [22] for measuring differences between obtained and expected Binormal ROC Curve, between two independent Binormal ROC Curves, and among groups of independent Binormal ROC Curves. They have used an approximate Chi-square statistics for each of the three tests which were constructed from maximum likelihood estimates of the two parameters defining the Binormal ROC Curve. '
Further, Hanley & McNeil [23] provided the comparison for assessing the performance of a diagnostic test based on the areas under two ROC Curves derived from same set of patients by taking correlation between paired samples into account. Vardhan & Sarma [24] proposed an approach of estimating the Area under the ROC Curve using confidence interval of means. Further, Vardhan & Balaswamy [25] proposed a new method to estimate the AUC of Binormal ROC model by taking into account of the confidence intervals of mean and corresponding variances. The present paper brings out the mathematical aspects of HROC Curve such as constructing the asymptotic confidence intervals for the indices β, AUC, FPR and TPR; identification of optimal threshold and testing the significance using AUC. The practical importance of the above proposed are demonstrated using a real dataset and simulated datasets too.
Methods
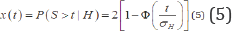
Let x1 and x2 be the test scores (S) which are distributed according to Half Normal and Exponential distributions in normal (H) and abnormal (D) populations respectively. The cumulative distribution and probability density functions of Half Normal and Exponential distributions are as follows,
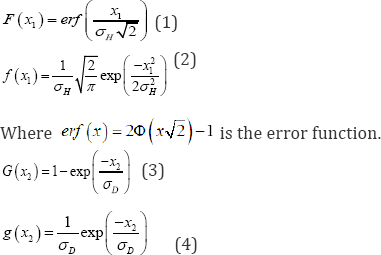
Where σH and σD are the scale parameter of H and D populations. Since both x1 and x2 are continuous, every data value acts as a possible threshold. As usual let t be threshold so that in the usual notations for sensitivity (TPR) and specificity (1-FPR) are
Sn = P (S > t|D ) = 1-P (S ≤ 1|D ) = 1-G (t)
Sp = P (S ≤ t|H ) = F (t)
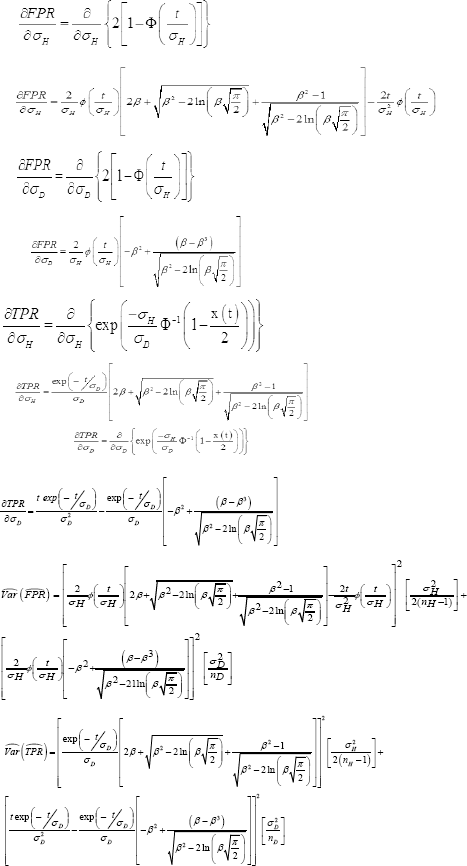
The expression for FPR is defined as
The expression for t can be obtained as
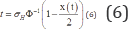
Where Ф-1(.)is the inverse cumulative standard normal distribution function. Similarly TPR is defined as
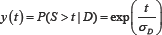
Now substituting the expression for t in the above expression,
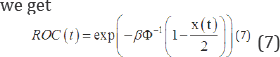

Where  and Ф-1(.) is the inverse of standard normal deviate. The expression in (7) is called as the Hybrid ROC (HROC) Curve [14], since it is obtained on using two different skewed distributions. Here, the ratio β can be used to explain the functional behaviour of the HROC Curve. The typical forms of the HROC Curve are shown in Figure 1 by considering three different cases such as β = 1, β< 1and β> 1.
We observe the following pattern
If β = 1 then the HROC Curve roughly coincides with the chance line.
If β> 1 then HROC Curve explains worst-case scenario. This is unusual in any field as it occurs only when σH >σD.
If β < 1 then the HROC Curve lies above chance diagonal. Lower β values lead to better classification.
Area under the Curve (AUC)
The accuracy of a diagnostic test can be explained using the Area under the Curve (AUC) of an ROC curve.AUC describes the ability of the test to discriminate between abnormal and normal. AUC gives information about the general goodness of a test as well as interpretation of a test result.
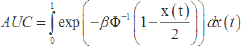
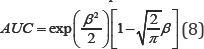
On further simplification, the closed form of AUC is
Identifying Optimal Threshold (t) & Youden's Index (J)
Once, the HROC Curve and AUC are estimated, another important aspect in classification is to obtain the optimal threshold, which is unique and provides a better percentage of correct classification. This criterion can be met in two ways, first one depends on the condition that the probability density functions of two populations are equal and second way is to make use of the widely accepted measure, namely Youden's Index (J). To obtain the optimal threshold for the HROC Curve, let us assume that both population densities are equal i.e. f (t ) = g (t),
on further simplification, the expression for t, which is a quadratic equation given in equation(9)
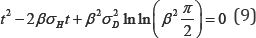
The expression in equation(9) can be simplified to achieve the optimal threshold as follows
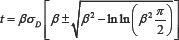
In choosing positive or negative sign to obtain the optimal cut-off, positive sign must be considered because the expression  is always positive whether β> 1 or β< 1. Therefore, the expression for optimal threshold is given by,
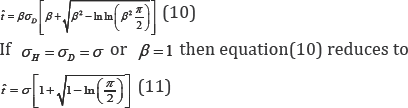
Here, description on the use of Youden's Index in validating the obtained optimal threshold is given. In ROC context, the Youden's Index is defined as
J = maximum{Sensitivity(t ) + Specificity(t ) -1} (12)

over all cut points t, -∞ < t < ∞ The index (J) ranges between 0 and lwith a value of 1 indicating perfect diagnostic effectiveness and 0 indicating an ineffective test. With respect to the ROC curve, J is the maximum vertical distance between the curve and the diagonal (chance line) and acts as a global measure of the optimum diagnostic ability (Figure 2). Evaluating sensitivity and specificity at t and then substituting in (12), we have
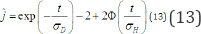
Where Φ denotes the standard normal cumulative distribution function. When distributional parameters are unknown, estimators  and ĵ are found by substituting the estimated variances
  for σ2H and σ2D respectively in equations (10) and (13) or equations (11) and (13) for equal variance case.
In the next subsections, the 100(1-α) % asymptotic confidence intervals are derived for the measures of HROC Curve such as , AUC, FPR and TPR. For parametric and semi-parametric methods, maximum likelihood theory will provide asymptotic expressions for variances and covariances of the parameters and delta method can be used to obtain the required variance to construct asymptotic confidence intervals.
Asymptotic Confidence Intervals for 
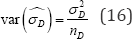
In order to obtain asymptotic confidence intervals for true AUC, one needs to have an estimate ofvar . The 100(1-α)% asymptotic confidence interval for AUC is given by  ±
where Var is the variance of and
±
where Var is the variance of and  standard
2 2
normal percentile. While the exact variance of is unknown, we find a reasonable approximation through the delta method, Var Therefore, the resulting asymptotic confidence intervals is
standard
2 2
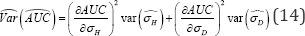
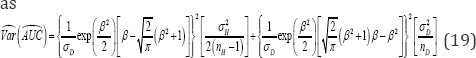
normal percentile. While the exact variance of is unknown, we find a reasonable approximation through the delta method, Var Therefore, the resulting asymptotic confidence intervals is  , where Var(AC) is the estimated variance of AUC. Using Delta method [22] the approximate estimated variance of , noting the independence of σH2 and σD2 is given in equation (14)
The delta method is used (Appendix 1) to estimate and is given below,
Appendix 1
Estimation of Parameters
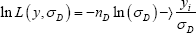
Here, X and Y are independent random variables from Half Normal and Exponential distributions with scale parameters �H and a D respectively. Then the likelihood function for the Half Normal distribution is
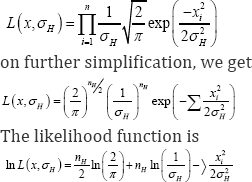
On partially differentiating the above expression with respect to the parameter σ_H and the associated gradient is as follows
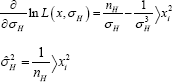
It is known that the Half Normal distribution follows N (0, σH2) , therefore N (0,1), Further, it is nown that
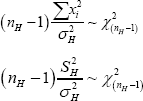
Therefore, variance of SH2can be obtained from the Chi- square distribution with (nH - 1) degrees of freedom.
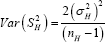
Similarly, the likelihood function for the Exponential distribution is
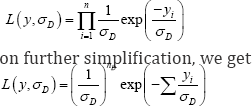
log likelihood function is
On partially differentiating the above expression with respect to the parameter σ_D and the associated gradient is as follows
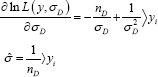
here, yi follows Exponential distribution with parameterσD which implies that 
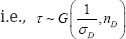
where τ = Σyi . Using the relation between Gamma and Chi- square distribution, it is easy to show that
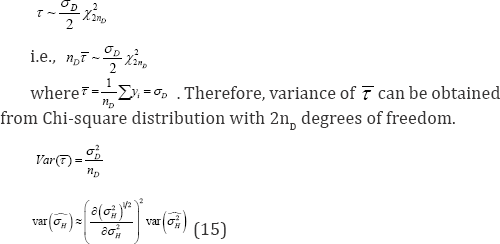
Further, the variance of σ
The partial derivatives of AUC with respect to the parameters are
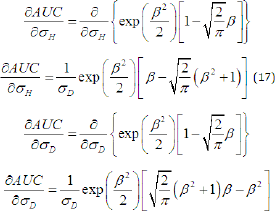
On substituting equations (17) and (18) along with its variances in equation(14), the expression for  is obtained
Asymptotic Confidence Intervals for HROC Curve
The confidence interval estimation for the HROC Curve represents the range of the curve at each point of FPR and its corresponding TPR. Therefore, the 100(1-α)% asymptotic confidence intervals for FPR and TPR are as follows,
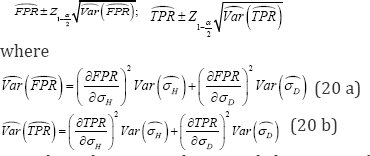
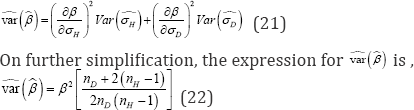
Now, by substituting the partial derivatives (Appendix 2) along with its variances of both parameters in equations (20a) and (20b), the variances of FPR and TPR are as follows
Appendix 2
Further, the partial differentiations of FPR and TPR with respect to their parameters are as follows,
Asymptotic Confidence Intervals for
The behaviour of HROC Curve depends upon scale parameters of both populations σH andσD . Therefore, their ratio β is very important in construction of HROC Curve. As βvaries, shape of the HROC Curve will vary between convex and concave forms. The interest is to estimate a 100(1 -α)% asymptotic confidence
interval for βand is 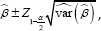 ,
,
The variance of can be obtained through delta method and is givn below,
Testing of Hypothesis based on AUC
So far, the concentration is in estimating the summary characteristics of HROC Curve such as AUC, β , FPR and TPR. Then the asymptotic confidence intervals for AUC, FPR and TPR are constructed to know the variability of these estimates. Now, the inferential matter of HROC Curve is considered for testing the significance of the curve. The main aim of the HROC Curve is to classify the subjects into one of the two populations. So, to measure the extent of classification between the population scores, one needs to measure the difference between HROC Curve and its chance diagonal. The most common one to test the classification is the difference between the AUC and chance line. So, the way of testing whether the classifier under study has any ability to discriminate between two populations is to test whether its AUC is significantly greater than the area under the chance line, i.e., 0.5. The hypothesis is defined, as the classifier will only be useful if its HROC Curve lies uniformly above the chance diagonal.
The null and alternative hypothesis are H0 : AUC = 0.5 versus H1: AUC ≥ 0.5 and a natural test statistic is,

Where  is the estimated variance of On employing asymptotic arguments [26], the distribution of Z under the null hypothesis can be approximated by an asymptotic standard normal distribution.
Results and Discussion
The proposed methodology is demonstrated using simulation studies as well as a real data (APACHE IV).
Simulation Studies
Random samples of different sizes are generated with various combinations of scale parameters of considered distributions using Inverse Cumulative Method. The algorithms which are used to generate random samples of different sizes for Half Normal and Exponential distributions are as follows.
Generating Random Samples from Half Normal Distribution
I. Generate random samples from u 1∽ U(0,1)
II. Using the expression, 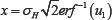 to obtain random samples of Half Normal distribution.
III. Repeat steps (1) and (2) for generating random samples of different sizes.
Generating Random Samples from Exponential Distribution
I. Generate random samples from u 2∽ U(0,1)-
II. Using the expression,y=-σDln(1-u2)to obtain random samples of Exponential distribution.
III. Repeat steps (1) and (2) for generating random samples of different sizes.

In order to illustrate the proposed methodology and on using the above two algorithms, random samples are generated at different sample sizes i.e., n = nH = nD = {25,50,100,200,500;} with various combinations of scale parameters. From Table 1, it is clear that as β tends to have a smaller value (β <1), the accuracy of a test increases indicating higher value of J. The worst case of HROC Curve can also observed when σH=σD.

Figure 3a & 3b depict the proposed HROC Curves at various and H populations becomes larger, otherwise. On observing the combinations of scale parameters. These curves will deviate from different forms of the Hybrid ROC Curves in Figure 3a & 3b, it is chance line as the variability between the scale values of both D clear that the curve is monotonically increasing.

Table 2 depicts the Confidence intervals for AUC and p at different sample sizes with various combinations of scale parameters. As variance expression of the measures of HROC Curve involves sample size n, it reflects in the width of the confidence interval. It is also observed that whenever the difference between scale parameters is zero (i.e.,σH-σD = 0 ) the lower bound will be equal to zero and upper bound will attain a value one, which means that the C.I's are not able to produce any information about the true accuracy, since it is a case of random classification. Also, it is clear that whenever the accuracy of a test is high (i.e., at σH= 06 and σD = 2 ), this situation leads to provide a very short confidence intervals with true AUC at all sample sizes and these intervals are precise when compared to other combinations.
The statistical significance tests are evaluated to validate the accuracy of a test at α/2 percentile (Table 2). From the results, it is observed that the hypothesis will be accepted withZAUC < 1.96 in the case of worst classification (i.e., σH = σD = 1.5 ) over all sample sizes, whereas at other combinations, the hypothesis is rejected when the difference between scale parameters is high, giving rise to a better phenomenon (i.e., at σH= {0.8,0.6,0.3} and σD = {1.5,2}). From Figure 4, it is observed that as the difference between scale parameters increases, width of between scale parameters is equal to zero, width of confidence interval line will be above all other combinations of HROC Curve. This is due to the density curves of both populations, since the confidence intervals depends on variance of measures and these measures are estimated through the overlapping area of density curves. The confidence intervals for the HROC Curve at various combinations are drawn to show the variability of the curve at each point on the ROC Curve (Figure 5). Further, the optimal threshold along with the pair of FPR and TPR is highlighted in each combination, which can be used to classify the individuals into one of the groups.


Real Dataset

The real dataset is about the ICU scoring system, APACHE IV, which is used to predict the status of the patients (Dead or Alive) that takes into consideration various parameters like physiological variables, vital signs, urine output, neurological score along with age related parameters and co-morbid conditions. This data consist of 111respondents, of which 66 (59.46%) are alive and 45 (40.54%) dead. From this dataset, it is observed that the APACHE IV scores for dead patients follow Exponential distribution (one sample K-S Statistic = 0.0794; p-value= 0.9175 at ) and for those patients who are alive follow Half Normal distribution (one sample K-S Statistic = 0.1091; p-value = 0.3835 at ). The results are reported in Table 3 and it is observed that the accuracy of APACHE IV test is 61.43% with the ratio equals to 0.6.
This means that the APACHE IV score can predict survivors from non survivors with an accuracy of 61.43% with an optimal threshold of15.86. This means that when an individual's APACHE IV score exceeds 15.86, then the patient will have a higher chance of attaining the critical event, death. The confidence intervals explain the variability in the estimated measures of HROC Curve. Further, the test statistic reveals that the HROC Curve for APACHE IV is significant enough to explain the mortality rate (Z>1.96) and uniformly lies above the chance line. Figure 6 depicts the lower and upper confidence intervals for HROC Curve along with optimal threshold.

Conclusion
In real life situations, the researcher or practitioner anticipates some advanced statistical tools which can handle his/ her data pattern easily. Often, a practitioner wishes to identify a subject's status using a diagnostic test or procedure. Under every diagnostic test or procedure, there exists a biomarker, by which the classification of subjects will be done and usually these biomarkers are continuous in nature. In reality many situations arise where the biomarker tends to have skewed type of distribution and also the biomarkers of normal and abnormal populations tend to have different distributions. In such situations, the conventional Binormal and Bi-distributional ROC models are not appropriate and mislead (overestimate or underestimate) the results (accuracy and threshold). Moreover, in most of the situations the abnormal population will be more skewed than normal population. Therefore, this paper addresses all these issues in the context of skewed distributions in classification. This paper focuses on the HROC Curve based upon two different distributions such as Half Normal and Exponential. The AUC and related measures of ROC curve are derived for this proposed model. The HROC Curve completely relies on its scale parameters; further the ratio of normal to abnormal scale parameters plays a prominent role in shaping the HROC Curve. In the context of classification, the abnormal test scores will always be higher than the normal, therefore, the HROC Curve gets the shape of concavity, which reflects to produce a better accuracy when β <1 . The other case is to have a convexity, when β >1 and such situations lead to a worst classification.
Here, an attempt made is to observe the impact of sample size resulted positively in the construction of confidence intervals for the measures considered. Further, inferential procedures are provided to validate the significance of a test compared to random one. An observation made in the simulation study is that a proper discrepancy will not be possible at smaller sample sizes when it is tested against random classification (AUC=0.5). Further, the real dataset for detection of mortality rate using APACHEIV explains an accuracy of 61.43% along with the ratio β=06 .This means that the APACHE IV score is able to identify the status of patients with 61.43% of correct classification at an optimal threshold equals to 15.86 meaning to that an individual’s APACHE IV score exceeds this value then that individual's life is at risk.
Acknowledgment
The authors would like to thank and acknowledge Dr. Vimal Kumar, Department of Public Health and Medicine, S.R.M. Medical College Hospital and Research Centre, Chennai, India for sharing the data to carry out the results.
References
- Peterson WW, Birdsall TG, Fox WC (1954) The theory of signal detectability. Transactions of the IRE Professional Group on Information Theory PGIT 2(4): 171-212.
- Green DM, Swets JA (1966) Signal Detection theory and Psychophysics. Wiley, New York, USA.
- Drury CG, Fox JG (1975) Human reliability in quality control. NY: Halsted, New York, USA.
- Swets JA, Egilance (1977) Relationships among theory, physiologicalcorrelates and operational performance. Plenum, New York, USA.
- Krzanowski WJ, Hand DJ (2009) ROC curves for continuous data, Monographs on Statistics and Applied Probability. NY: CRC Press, Taylor and Francis Group, USA.
- Lusted LB (1971) Signal detectability and medical decision making. Science 171: 1217-1219.
- Dorfman DD, Alf E (1969) Maximum-likelihood estimation of parameters of signal detection theory and determination of confidence intervals Rating-method data. Journal of Mathematical Psychology 6(3): 487-496.
- Swets JA (1986) Form of empirical ROCs in discrimination and diagnostic tasks: Implications for theory and measurement of performance. Psychol Bull 99(2): 181-198.
- Metz CE (1989) Some practical issues of experimental design and data analysis in radiological ROC studies. Invest Radiol 24(3): 234-245.
- Goddard MJ, Hinberg I (1990) Receiver Operating Characteristic (ROC) Curves and non-normal data: An empirical study. Stat Med 9(3): 325337.
- England WL (1988) An Exponential Model Used for optimal Threshold selection on ROC Curves. Med Decis Making 8(2): 120-131.
- Gregory C, Makarand VR (1993) An application of Lomax Distributions in Receiver Operating Characteristic (ROC) Curve Analysis. Communications in Statistics-Theory and Methods 22(6): 1681-1687.
- Dorfman DD, Berbaum KS, Metz CE, Lenth RV, Hanley JA, et al. (1997) Proper Receiver Operating Characteristic Analysis: The Bigamma Model. Acad Radiol 4(2): 138-149.
- Balaswamy S, Vishnu VR, Sarma, KVS (2015) The Hybrid ROC (HROC) Curve and its Divergence Measures for Binary Classification. International Journal of Statistics in Medical Research 4: 94-102.
- Balaswamy S, Vishnu VR (2015) Intervals Estimation for the Measures of ROC Curve underlying Half Normal and Rayleigh Distributions. IAPQR Transactions 40(1): 19-32.
- Youden WJ (1950) An index for rating diagnostic tests. International Journal of Green Computing 3: 32-35.
- Ferragi D (2000) The Effect of Random Measurement Error on Receiver Operating Characteristic (ROC) Curves. Stat Med 19(1): 61-70.
- Reiser B (2000) Measuring the effectiveness of diagnostic markers in the presence of measurement error through the use of ROC curves. Stat Med 19(16): 2115-2129.
- Miller RG (1981) Survival Analysis. John Wiley and Sons, New York, USA.
- Greenhouse SW, Nathan M (1950) The evaluation of diagnostic tests. Biometrics 6(4): 399-412.
- Gourevitch V, Galanter E (1967) A significance test for one parameter is sensitivity functions. Psychometrika 32: 25-33.
- Metz CE, Kronman HB (1980) Statistical Significance Tests for Binormal ROC Curves. Journal of Mathematical Psychology 22: 218-243.
- Hanley JA, McNeil JB (1983) A method of comparing the Areas under Receiver Operating Characteristic Curves Derived from the Same Cases. Radiology 148(3): 839-843.
- Vishnu VR, Sarma KVS (2010) Estimation of the Area under ROC Curve using Confidence Interval of Mean. ANU J Phy Sci 2(1): 29-39.
- Vishnu VR, Balaswamy S (2013) Improved Methods for Estimating Area under the Receiver Operating Characteristic Curves: A Confidence Interval Approach. International Journal of Green Computing 4(2): 5875.


