


An Improved Estimation Procedure of the Mean of a Sensitive Variable Using Auxiliary Information
Tanveer AT1 and Housila PS2
1Department of Computer Science and Engineering, Islamic University of Science and Technology, India
2School of Studies in Statistics, Vikram University Ujjain, India
Submission: August 22, 2017; Published: October 02, 2017
*Corresponding author: Tanveer A Tarray, Department of Computer Science and Engineering, Islamic University of Science and Technology, India, Email: tanveerstat@gmail.com
How to cite this article: Tanveer AT, Housila PS. An Improved Estimation Procedure of the Mean of a Sensitive Variable Using Auxiliary Information. Biostat Biometrics Open Acc J. 2017; 3(2): 555607. DOI:10.19080/BBOAJ.2017.03.555607
Abstract
This paper proposes new ratio and regression estimators for the mean of sensitive variable utilizing information on a non - sensitive auxilia-ry variable. Expressions for the Biases and mean square errors of the suggested estimators correct up to first order of approximation are derived. It has been shown that the suggested new ratio and regression estimators are better than conventional unbiased estimators which do not utilize the auxiliary information, Sousa et al. [1] ratio estimator and Gupta et al. [2] regression estimator under a very realistic condition. In support of the present study we have also given the numerical illustrations.
Keywords: Ratio estimator; Regression estimator; Randomized response technique; Mean Square error; Bias; Auxiliary variable
Introduction
Let Y be the variable under study, a sensitive variable which can't be observed directly. Let X is a non - sensitive auxiliary variable which is strongly correlated with Y. Let S be a scrambling variable independent of the study variable Y and the auxiliary variable X. The usual additive model used for gathering information on quantitative sensitive variable is due to Himmelfarb & Edgell [3]. Their model allows the interviewee to hide personal information using a scrambling variable to their response. The respondent is asked to report a scrambled response for the study variable Y (based on additive model) given by Za =Y+S, but is asked to provided a true response for the auxiliary variable X [1].
Hussain [4] have discussed the use of subtracting scrambling. Thus following Hussain [4], the respondent is asked to report a scrambled response for the study variable Y (based on subtractive model) given by Zs = Y-S, but is asked to provide a true response for the auxiliary variable X. It is interesting to mention that the proposed model generalizes both usual additive and subtractive models. Gjestvang & Singh [5] have pointed out that “the practical application of an additive model is much easier than the multiplicative model, that is, respondents may like to add two numbers rather than doing painstaking work of multiplying two numbers or dividing two numbers: thus the improvement of the additive model has its own importance in the literature”. Looking at the form the additive model, subtractive model and above arguments due to Gjestvang & Singh [5] we have introduced a new model (which is additive in nature)
Zφ = Y + φS
where φ is a known scalar such that - 1 ≤ φ ≤1.
Thus keeping the proposed model Zφ = Y + φS view, the respondent is asked to report a scrambled response for Y given but is asked to provide a true response for X. Let a simple random sample of size n be drawn without replacement from a finite population U = (U1,U2,...UN). For the ith unit (i=1,2,... ,N), let and respectively be the values of the study vari able Y and the auxiliary variable X. Further, let 
 be the sample means and
  be the population mean for Y, X and Zφ respectively. We assume that the population mean
  of the auxiliary variable X is known and
  = E(S)= O
Thus,E(Zφ) = E(Y) .We also define
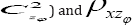
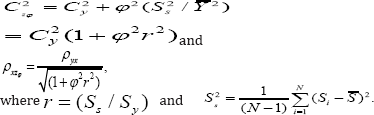
where Cx and Czφ are coefficients of variation of X and Zφ respectively, and ρxz is the correlation coefficient between X and Zφ The square of the coefficient of variation of 
If information on auxiliary variable X is ignored, then the mean square error of the estimator 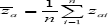 basedon conventional additive model Z a = Y +S is given by

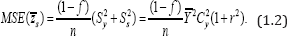
Further if the information on auxiliary variable X not utilized, then the mean square error of the estimator  based on conventional subtractive model Zs = Y - S is given by
It follows from (1.1) and (1.2) that 
The mean square error of the estimator 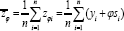 based on the suggested additive model Zφ= Y + φS is given by
Thus in the proposed additive model Zφ = Y + φS , the choice of the value of the scalar between -1 to +1 is justified.
We note that Sousa et al. [1] have mentioned in their study (about their proposed estimators) that "there is hardly any difference in the first order and second order approximations for mean square error (MSE) even for small sample sizes". Keeping this in view, we have studied the properties of the proposed estimators in the subsequent sections only to the first order of approximation. The merits of the proposed estimators are examined through numerical illustration.
The suggested ratio estimator
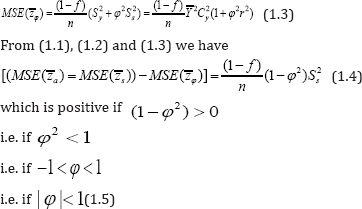
We consider the following ratio estimator for the population mean  of the study variable Y using the known population mean of the auxiliary variable X:
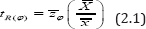
We note that for =1, the proposed estimator reduces to the estimator
which is due to Sousa et al [1], where  For
For  estimator
based on true responses of variables Y and X.
Expressing (2.1) in terms of eZφ and ex we have

We assume that |ex|<1 so that (1+ex)-1 is expandable. Expanding the right hand side of (2.4), multiplying out and neglecting terms of e's having power greater than we have
Taking expectation of both sides of (2.5) we get the bias of to the first order of approximation as
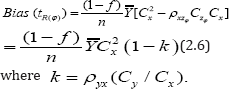
It is observed from (2.6) that the bias of the proposed 2.6). Thus the bias of the proposed estimator  is independent of ϕ.So whatever be the vale of ϕ' the bias of
  Will remains same as given in (2.6). Thus the bias of the proposed estimator
  and the bias of the estimator
  due to Sousa et al. [1] are same. This fact can also be seen from (2.6) and (2.9).
Squaring both sides of (2.5) and neglecting terms of e's having power greater than two we have

Taking expectation of both sides of (2.7) we get the mean square error (MSE) of to the first degree of approximation as
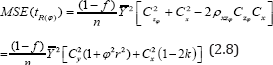
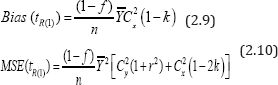
Expression (2.8) indicates that the MSE of the proposed estimator depends on the scalar ϕ. So there will be effect of selecting the value of ϕ towards increasing or decreasing the MSE of . So one should be very cautious about the selection of value of ϕ . Setting φ = 1 in (2.6) and (2.8) we get the bias and MSE of the Sousa et al. [1] estimator tR(1) to the first degree of approximation respectively as
Efficiency Comparison
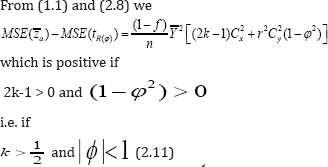
Thus the proposed estimator is more efficient than the usual unbiased estimator  as long as the condition (2.11) is satisfied. The conditon (2.11) also holds for the proposed estimator to be better than the usual estimator based on subtractive model.
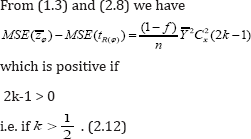
This is a condition of the classical ratio estimator tR in (2.3) to be better than the usual unbiased estimator  It follows from (2.11) and (2.12) the proposed estimator more efficient than the unbiased estimator
  and
and  if the conditions (2.11) holds true.
Further from (2.8) and (2.10) we have
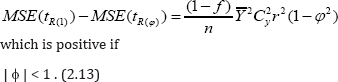
Thus it follows from (2.11), (2.12) and (2.13) that the suggested estimator is more efficient than the unbiased estimator , and the ratio type estimator tR(1) due to Sousa et al. [1].
Remark 2.1: If the correlation between the two variables Z ϕ and the auxiliary variable X is negative high, then one can consider the following product- type estimator for the population mean as
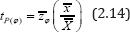
To exact bias of the proposed product - type estimator by tp(φ) is given by
which is same as the bias of the classical product estimator

based on true response of variables Y and X.
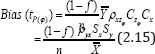
It is observed from (2.15) that the bias expression of tp(φ) is free from the scalar ϕ . So whatever be the value of ϕ, the bias of tp(φ) will remains same as given in (2.15).
The mean square error of the estimator tp(φ) ( p) to the first degree of approximation is given by

which depends on the value of the scalar ϕ . So one should be careful in selecting the value of ϕ .
From (1.3) and (2.17) we have
Which equals to the same condition in which the classical product estimator tP is better than usual unbiased estimator
Empirical Study
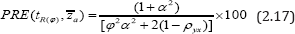
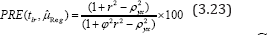
To judge the superiority of the proposed estimator over and the ratio type estimator tR(1) due to Sousa et al.[1]we have computed the percent relative efficiencies of with respect to and tR(1) by using the formulae:
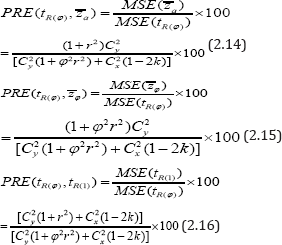
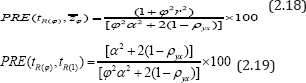
For the percent relative efficiency (PRE's) computation purpose we assume for the sake of simplicity that  where α is a scalar in percent, (i.e. α % ) as mentioned in Sousa et al. [1], Gupta et al.[2]. Under the above assumptions the PRE's formulae given by (2.14), (2.15) and (2.16) respectively reduce to:

It is observed from Table 1-3 that:


I. For fixed values of a = 10 % , 20% , 30 % , larger gain in efficiency is observed by using the proposed estimator over the conventional unbiased estimators and which do not utilize the auxiliary information.
II. For α = 10 % the gain in efficiency by using the proposed estimator over the ratio type estimator due tR(1) to Sousa et al.'s (2010) is marginal while for a =20 % and 30 % are substantial.
III. For fixed values of (α , ρyx), the values of, ncrease as the value of ϕ increases up to 'zero' and starts decreasing when it goes beyond 'zero'.
IV. The maximum gain in efficiency is observed when ϕ =0, which is obvious because proposed additive model Z φ becomes free from the scrambling.
V. For fixed value of (ρyx , α), the values of increase as the values of the correlation coefficient ρ yx increases.
Overall we conclude that the proposed estimator is to be preferred in practice when:
i. The standard deviation of the scrambling variable S is closer to the standard deviation of the auxiliary variable X.
ii. The value of ϕ is closer to 'zero' and the value of correlation coefficient ρ yx is larger.
Proposed Regression Estimator
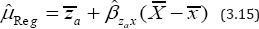
To obtain the regression estimator of the population mean we first define the difference estimator for as

where d is a suitably chosen constant. It is easy to verify that the difference estimator td is unbiased estimator of the population mean .
The variance of the estimator td is given by
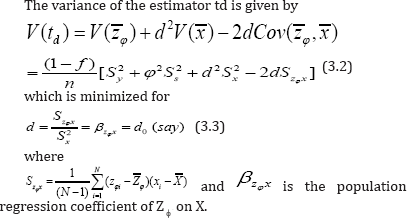
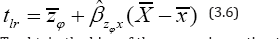
Substitution of (3.3) in (3.1) yields the resulting optimum difference estimator for the population mean as
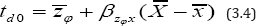
We note that the value of βzφx is unknown in practice. In such a situation we replace βzφx by its consistent estimate
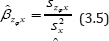
where  is the sample regression coefficient of Zϕ and X and Zϕ=Y+ ϕ S is the scrambled response on Y;
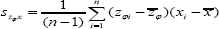
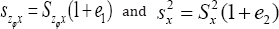
and 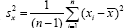 are unbiased estimators of Szφx and S2x respectively. Thus the resulting regression estimator for the population mean is given by
To obtain the bias of the regression estimator tlr we further write
such that
E(e1)=E(e2) =0
and from Sukhatme & Sukhatme [6] we have
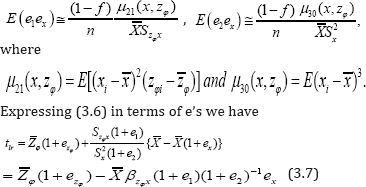
We assume that |e2| <1 so that (1+e2)-1 is expandable. Now expanding the right hand side of (3.7), multiplying out and neglecting terms of e's having power greater than two we have
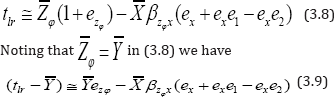
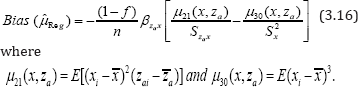
Taking expectation of both sides of (3.9) we get the bias of tlr to the first degree of approximation as
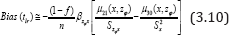
Showing that the proposed regression estimator tlr is a biased estimate. The bias will be negligible if the sample size n is sufficiently large.
Squaring both sides of (3.10) and neglecting terms of e’s having power greater than two we have

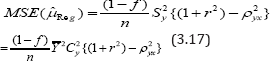
Taking expectation of both sides of (3.11) we get the mean square error of tlr to the first degree of approximation as
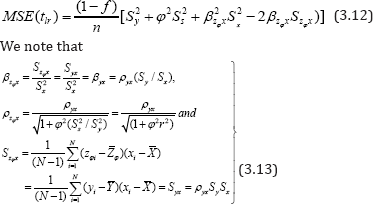
In the light of (3.13), the expression (3.12) reduces to:
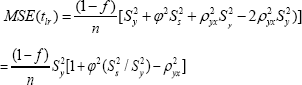
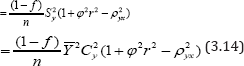
It is observed from (3.14) that the MSE of tlr depends on the scalar ϕ. So the value ϕ will effect the MSE of tlr . Thus one should be very cautious about the selection of the value of scalar ϕ. Assuming linear relationship between Y and X Gupta et al. (2012) suggested the following regression estimator for the population mean as
where is the sample regression coefficient between Za and X and Za = Y +X is the scrambled response on Y. Setting ϕ = 1 in (3.10), one can easily get the bias of Gupta et al.'s (2012) regression estimator  as
as
The mean square of the Gupta et al.'s (2012) regression estimator to the first degree of approximation is given by
which can be also obtained from (3.14) just by setting ϕ =1
Efficiency Comparisons
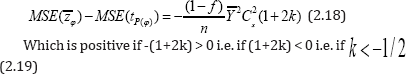
From (1.1) and (3.14) we

which is always positive if
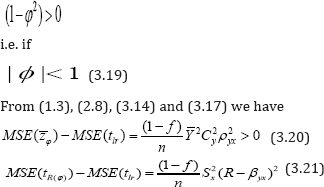
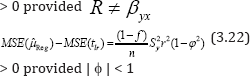
It follows from (3.19), (3.20), (3.21) and (3.22) that the proposed estimator tlr is more efficient than:
(i) The conventional unbiased estimator  and the regression estimator due to Gupta et al. (2012) as long as the condition: | ϕ | <1 is satisfied.
(ii) The usual unbiased estimator Zφ
(iii) The ratio estimator tR(1) considered by Sousa et al.(2010) unless R = βyx , the case where both the estimators tR(1) and tlr are equally efficient.
Empirical Study
To judge the merits of the suggested regression estimator tlr over Gupta et al. [2] regression estimator we have computed the percent relative efficiency of the suggested estimator tlr with respect to Gupta et al.'s (2012) estimator by using the formula:
Under the assumption  and
and  ,where
α is a scalar in percent (i.e. α %), the
,where
α is a scalar in percent (i.e. α %), the  reduces to:
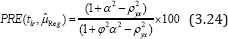
We have computed the values of in (3.24) for α = 10 %, 20 %, 30 % and ρ yx =0.55, (0.6) 0.9 and the finding are depicted in Tables 4-6.
Tables 4-6 clearly indicate that the values of are larger than 100. So the proposed regression estimator tlr is more efficient than that of Gupta et al. [2] regression estimator when | ϕ | < 1. There is considerable gain in efficiency by using the proposed regression estimator tlr over Gupta et al.'s (2012) regression estimator when the value of ϕ is in the neighborhood of 'origin', the value of ρ yx is closer to 'unity' and the value of a is moderately large. Thus in such situations our recommendation is to use the proposed regression estimator tlr as long as |ϕ | < 1.


Acknowledgement
The authors are thankful to the Editor-in-Chief, and to the anonymous learned referee for his valuable suggestions regarding improvement of the paper.
References
- Sousa R, Shabbir J, Real PC, Gupta S (2010) Ratio estimation of the mean of a sensitive variable in the presence of Auxiliary information. Jour Statist Theo and Pract 4(3): 495-497.
- Gupta S, Shabbir J, Sousa R, Real PC (2012) Estimation of mean of a sensitive variable in the presence of auxiliary information. Commun.statist Theo and Metho 41:2394-2404
- Himmelfarb S, Edgell SE (1980) Additive constant model: a randomized response technique for eliminating evasiveness to quantitative response questions. Psych Bull 87: 525-530.
- Hussain Z (2012) Improvement of Gupta and Thornton scrambling model through double use of randomization device. Int Jour Acad Res Bus Soc Sci 2(6): 91-97.
- Gjestvang CR, Singh S (2009) An improved randomized response model: Estimation of mean. Jour Appl Statist 36(12): 1361-1367.
- Sukhatme PV, Sukhatme BV (1970) Sampling theory of surveys with applications. (2nd Rev Edn) Ind Soci Agri Statist, New Delhi, India.


