Why One Should Avoid 'Routine' Medical Check-Up?
Sanjeev Sarmukaddam*
Research Professor, Sangeet-Sadhana, India
Submission: August 23, 2017; Published: September 20, 2017
*Corresponding author: Sanjeev Sarmukaddam, Research Professor, Sangeet-Sadhana, 11th Lane, Paramhans Nagar, Off Paud Road, Pune, India, e-mail: sanjeev.sarmukaddam@gmail.com
How to cite this article: Sanjeev S. Why One Should Avoid 'Routine' Medical Check-Up?. Biostat Biometrics Open Acc J. 2017; 3(1): 555604. DOI:10.19080/BBOAJ.2017.03.555604
Abstract
Interpretation of a test result should be done carefully considering test's characteristics (sensitivity & specificity) and correct estimate of 'prior probability' based on all background factors, history, presence of signs-symptoms, physical/clinical examination findings, etc. This short assay will focus on these aspects and will hopefully be useful. Every laboratory test or diagnostic or screening procedure has a set of characteristics that reflect the information expected in patients with and without the disease in question
These test characteristics lead to two fundamental questions
o If the disease is present, what is the likelihood that the test result will be positive?
o If the disease is not present, what is the likelihood that the test result will be normal or negative?
o However, knowledge of test characteristics does not permit accurate interpretation of test result. Such knowledge tells us only what proportion of patients with and without the disease in question will have a positive or negative result, respectively
Since the task of a clinician is to determine the presence or absence of the disease, the questions he or she must address are:
o Given a positive test, what is the probability that the disease is present?
o Given a negative test, what is the probability that the disease is absent?
Answers to these questions are discussed along with a simple method of estimation of 'Predictive value of positive test' result and 'Predictive value of negative test' result (for interpretation of any one result) based on prior probability of disease, sensitivity & specificity of a test
Abbreviations: ROC: Receiver Operating Characteristic; ETT: Exercise Tolerance Test
Introduction
Tests or procedures are done when the information available from historical review, physical examination or previous testing is considered inadequate to address the questions in hand. The decision to do a given test or procedure is therefore made on the assumption that the result will appreciably reduce the uncertainty relating to given question. These issues are discussed adequately in the literature [1-5].
The process of diagnosis i.e. diagnostic journey requires two essential steps. The first is the establishment of diagnostic hypothesis followed by attempts to reduce their number by progressively ruling out specific diseases. This process requires very sensitive test. Such test when normal (-ve) permit the physician to confidently exclude the disease. The next step is the pursuit of a strong clinical suspicion. This process requires a very specific test. Such a test when abnormal (+ve) should essentially confirm the presence of the disease.
Now let us define these terms Sensitivity & Specificity of the test
Sensitivity of the test is the ability to identify correctly those who have the disease. It is determined by identifying the proportion of patients with disease in whom the test is positive.
Sensitivity = (True positive results / Total patients with disease)
= [(TP)/(TP + FN)]
Specificity of the test is the ability to identify correctly those who do not have the disease. It is determined by identifying the proportion of patients without disease in whom the test is negative.
Specificity = (True negative results/Total patients without disease)
= [(TN)/(TN + FP)]
When a test is used either for screening or to exclude a diagnostic possibility, it must be sensitive. When two or more such tests are available, that with the highest sensitivity is preferred. The process of confirming a disease requires a test whose specificity is high. When two or more tests are available for this purpose, test with the highest specificity is preferred. The intelligent selection of test depends upon the purpose intended. Results of a test with high values of sensitivity and specificity are affected by prevalence or in case of single patient 'prior' probability of disease. When prevalence is low, even a highly specific test will give relatively large number of false positives. This necessitates defining two more terms. Predictive value of a positive test which is the likelihood that an individual with a positive test has the disease,
Predictive value of positive test = [(TP)/(TP + FP)]
and predictive value of a negative test which is the likelihood that a person with a negative test does not have the disease;
Predictive value of negative test = [(TN)/(TN + FN)]
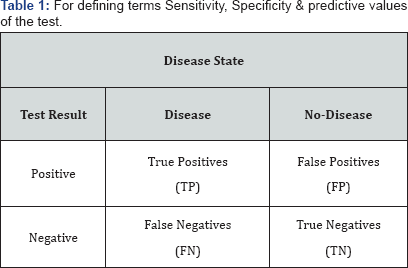
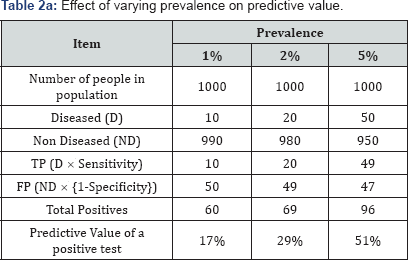
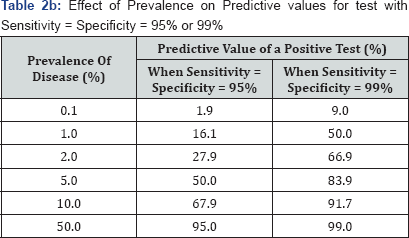
To see the effect of 'prevalence' (called as 'pre-test probability' in interpretation of test result) consider the following example. Let a population of 1000 people is screened with a test of 99% sensitivity and 95% specificity of 3 levels of prevalence [i.e. 'prior' probability of disease in case of single patient ]-1%, 2% & 5% (Table 1). If we keep sensitivity & specificity constant at 95% (or 99%) each and change prevalence, then the predictive value of a positive test would vary widely as shown in following Table 2.
This explains why so many reports of new tests look so good, but when those same tests used in the field, failure is common. Hopefully this explains "Why one should avoid 'routine' medical check-up?" Generally when any particular test is not 'indicated' (i.e. not advised by physician), prior probability of disease is as smaller than '0.1' and even with a very good test [say with Sensitivity = Specificity = 95%] "Predictive value of a positive test (%)" is lower than 2%.
Conclusion
Whenever result is 'positive' of a test which was not 'indicated' (i.e. not advised by physician), it is likely (>98%) to be a 'False Positive’ result. Therefore, one should avoid 'routine' medical check-up.
Note: Trade mill test’s sensitivity is 75% (which is found to be as low as 55% in one of the well planed studies recently) and ECG's sensitivity is only 30% (to detect heart disease). No test is perfect [i.e. with 100% sensitivity and 100% specificity]. There is trade-off between sensitivity and specificity. As sensitivity is increased, specificity falls and vice versa. Test that yields a quantitative result (e.g. blood sugar, blood pressure) the situation is different, in the sense that clear cut presence or absence of disease cannot be said. Each cut-off point thus defined a set of operating characteristics for the test in question.
A change in cut-off value alters sensitivity & specificity. Because no single value or cut-off point of an individual test can be expected to have both a perfect sensitivity and a perfect specificity it is often necessary to determine which value or cutoff point is the most appropriate for a given purpose. A graph can be constructed that correlates true and false positive rates or sensitivity and (1-specificity). Such a graph, which is known as receiver operating characteristic (ROC) curve of a test, is useful to decide the optimum cut-off point according to the purpose of the administration of the test. There is need to go in intricacies of ROC technique.
4A simple method of estimation of predictive values (2x2 method of calculation of post-test probabilities for interpretation of any one result)
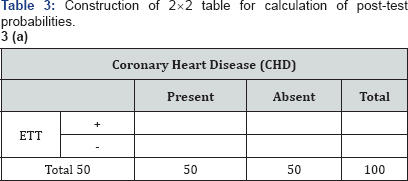
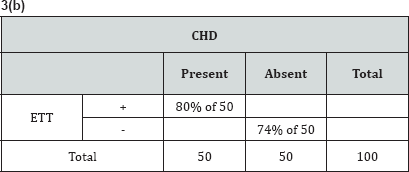
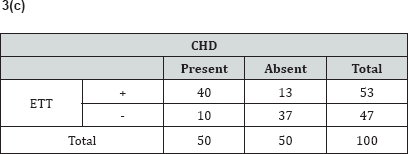
An entire volume is devoted for this purpose by American College of Physicians [6]. To illustrate this method we will consider one example. Suppose that based on the signs & symptoms in a given patient the physician considers the likelihood of coronary heart disease to be about 50:50 and orders an exercise tolerance test (ETT) which is 80% sensitive and 74% specific to further evaluate the patient. Post-test probabilities (predictive value of positive test and predictive value of negative test) can easily be calculated by constructing 2x2 Table 3a-3c in a following way:
Now the post-test probabilities are:
Predictive value of positive test = (40 / 53) * 100 = 75%
Predictive value of negative test =(37 / 47) *100 = 79%
The application of the known operating characteristics (sensitivity 80%, specificity 74%) of the ETT to some assumed numbers (e.g. CHD presents n=50, absent n=50) results in an increase in the likelihood of CHD from 50% to 75% in this patient when the ETT is positive. A normal ETT on the other hand reduces the likelihood of disease from 50% to 21% (or raises probability of no CHD from 50% to 79%).
The proper interpretation of the test result intimately depends on the clinician’s prior estimate of the likelihood of disease. Let in the opinion of physician the likelihood of having CHD for a given patient is 90% then, if the test is positive, the likelihood of CHD increases from 90% to 96% but if the result is negative the likelihood of CHD reduces from 90% to 72%. Here, a positive test adds little certainty to an already high likelihood of disease (an incremental in gain of 6%) whereas a negative test does not markedly reduce the likelihood of disease (an incremental ruling out gain of 18%). The usefulness of the test in this instance is marginal since there is only a small confirmatory gain when the test is positive and a normal result is misleading in three of four such patients.
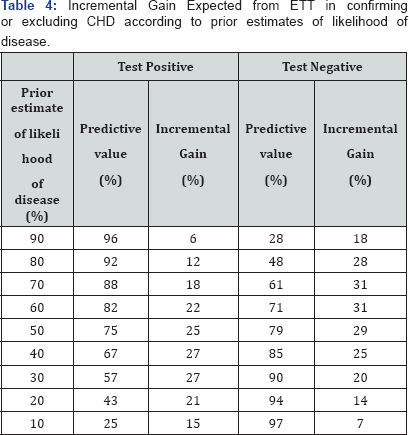
Calculation of the predictive values of positive and negative results for any test or procedure (whose sensitivity & specificity are known) by varying the prior probabilities may help to show where the test is useful. Following table shows the incremental gain expected from ETT in confirming or excluding the presence of CHD according to various prior estimates of the likelihood of disease. (These data apply only when the criterion used for a positive test is that 1mm or grater depression of the ST Segment) (Table 4).
The maximum incremental gains for positive and negative tests occur when the prior estimates are 40% and 60% respectively. When the pre-test likelihood of disease is high, positive result tends to confirm the disease but an unexpected negative result is not particularly helpful in ruling the disease out. When the pre-test likelihood of disease is low, a normal result tends to exclude the disease but an unexpected positive result is not particularly helpful in confirming the disease.
In fact, for any diagnostic test the change from pre test to post test probability (i.e. incremental gain) is maximum when the pre test probability is 50%. In other words, a sign, symptom or laboratory test is of greatest diagnostic value to a physician when he/she is in a 50:50 dilemma and cannot decide whether the patient has the disease. Other mathematical method of estimating post test probabilities (predictive values) is through odds likelihood ratio. This method can be used even when quantitative test result is categorized in more than two categories. With this method, which is comprehensively explained in [7] and briefly described here, a nomogram given by Fagan [8] can be used for ease in calculations.
A likelihood ratio which is an index of how good a diagnostic test is, contrasts the proportions of patients with and without the disease, who display the given level (means the presence or absence of sign or symptom or any of the levels of a laboratory test result) of a diagnostic test result. That is a likelihood ratio expresses the odds that a given level of a diagnostic test result would be expected in a patient with (an opposed to one without) the disease. For our earlier example calculation of likelihood ratios are shown in following Table 5.

The likelihood ratio for a positive test result (which is denoted as LR +) is {(Sensitivity)/ (1 - Specificity)}.
is 3.08, that means that ETT results of this sort are 3.08 times as likely to come from patients with CHD as from patients without CHD. It may be noted that the likelihood ratio for a negative test result is (which is denoted as LR -) is {(1-Sensitivity)/ (Specificity)}. The likelihood ratio for negative test result is 0.27, that means that ETT results of this sort are about one fourth as likely to come from patients with CHD as from without CHD. Since the proportions that make up the likelihood are calculated vertically (like Sensitivity and Specificity) likelihood ratios do not change with changes in the prevalence (or pretest probability) of the disease. Separate likelihood ratios can be calculated for several levels of the sign, symptom or laboratory test result rather than just the two levels (+ and -). This makes this one a very powerful diagnostic strategy.
To convert post- test odds back to probability, divide it by itself plus one. That is:
Post - test probability = [Post - test odds]/[Post - test odds +1]
In our earlier example, the pretest probability is 0.5 and therefore the pretest odds are 0.5/ 1-(0.5) = 1 for presence of disease. Post-test odds are 4.4 and therefore post-test probability is 4.4/4.4+1 = 0.81 (or 81%). To avoid calculations of switching back and forth between probabilities and odds one can use a very useful nomogram by Fagan [8].
References
- Sarmukaddam SB (2014) Clinical Biostatistics. New Age International Publishers Ltd., New Delhi, India
- Indrayan A, Sarmukaddam SB (2001) Medical Biostatistics. Marcel Dekker, New York, USA.
- Sarmukaddam SB (2006) Fundamentals of Biostatistics. Jaypee Brothers Pvt. Ltd., New Delhi, India.
- Sarmukaddam SB (2010) Biostatistics Simplified. Jaypee Brothers Pvt. Ltd., New Delhi, India
- Sarmukaddam SB (2017) Methods & Controversies in Clinical Trials. Centre for Behavioral Medicine, Pune, in Press, India
- American College of Physicians(1981) A special issue. Annals of Internal Medicine
- Sackett DL, Haynes RB, Guyatt GH, Tugwell P (1991) Clinical Epidemiology. A basic science for clinical medicine. Little Brown and Company, Boston, USA
- Fagan TJ (1975) A nomogram. New Eng Jr Med Pp. 293-257.


