Signal Variation in Multiplexed Nanowire Array Based Biosensors: A Quantitative Approach
Krishna Mohan K, Prashanthi K and Montemagno CD*
Department of Chemical and Materials Engineering, University of Alberta, Canada
Submission: July 14, 2017; Published: July 27, 2017
*Corresponding author: Montemagno CD, Department of Chemical and Materials Engineering, University of Alberta, Canada, Email: montemag@ualberta.ca
How to cite this article: Krishna M K, Prashanthi K, Montemagno C D. Signal Variation in Multiplexed Nanowire Array Based Biosensors: A Quantitative Approach. Biostat Biometrics Open Acc J. 2017: 2(4): DOI: 10.19080/BBOAJ.2017.02.555591.
Short Communication
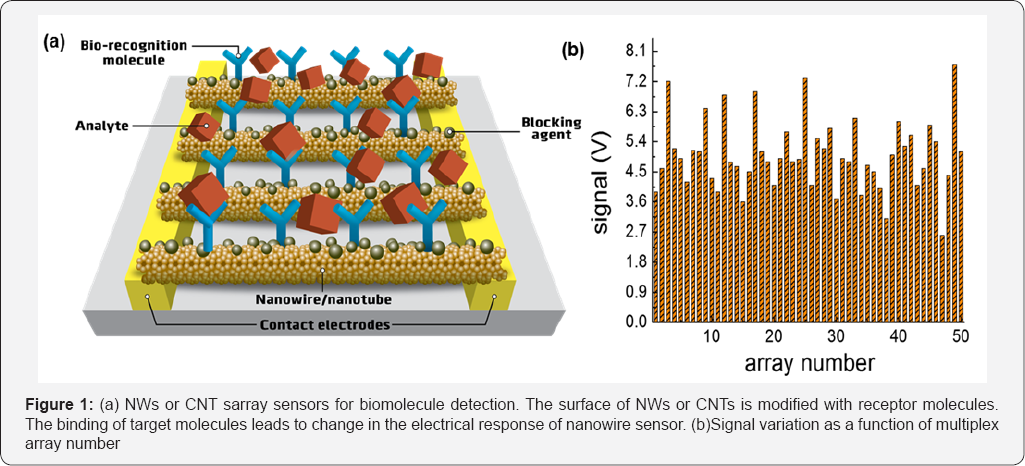
Multiplexed detection of biomarkers is in demand as it offers a simple and reliable way of point-of-care (POC) testing. For multiplexed detection and quantification of biological species [1-4], nano structure array based biosensors offer new and unique opportunities. Interestingly, one dimensional (1-D) nanostructures, such as nanowires (NWs) and carbon nanotubes (CNTs), are perfect candidates in this dimension as they offer high surface area to volume ratio with excellent electro mechanical properties which are added assets for the biosensor technology. The most important component of the nano biosensor is the transduction mechanism from NWs which is responsible for converting the responses of bio analyte interactions in recognizable and reproducible manner using the conversion of specific biochemical reaction energy into an electrical signal. Unlike the photolithography based top-down process for nano biosensor fabrication, cost-effective bulk fabrication of nanosensor devices calls for either bottom-up self-assembly or drop casting approaches. However, solution based drop casting approaches lead to innate disparities in the structure of nominally identical nanosensor devices; consequently, there is wide inter-device variance in their functionality as well as signal variation. In this short communication, we report such signal variations from a multiplexed nanobiosensor, which arise due to various experimental factors. Furthermore, we perform a quantitative analysis [5] to quantify the experimental factors affecting the signal variation of the multiplexed nanobiosensor. ( Figure 1a) schematically depicts a NW or CNT array based multiplexed biosensor. For such a biosensor, sites of NWs/CNTs that are not functionalized with a receptor (ex: antibodies) molecule can potentially participate in non-specific binding, resulting in undesired noise in the signal. A blocking agent is used to screen such interactions to avoid this problem. Upon selective binding of the target analyte to the receptor on NW surface, there are changes to the conductivity of the NW due to the variation in number of charge carriers in the NW. (Figure 1b) shows experimentally measured signal variation as a function of array number from a multiplexed nano biosensor. We expect a constant output signal for a given set of experimental conditions for an ideal multiplexed array based nano biosensor. However, in a real scenario, we see a noticeable variation in the output signal from the multiplexed array (Figure 1b). While manufacturing large-scale nano biosensors for possible commercialization, it is important that we encounter the factors affecting the signal variation in order to mitigate the risk associated with it.
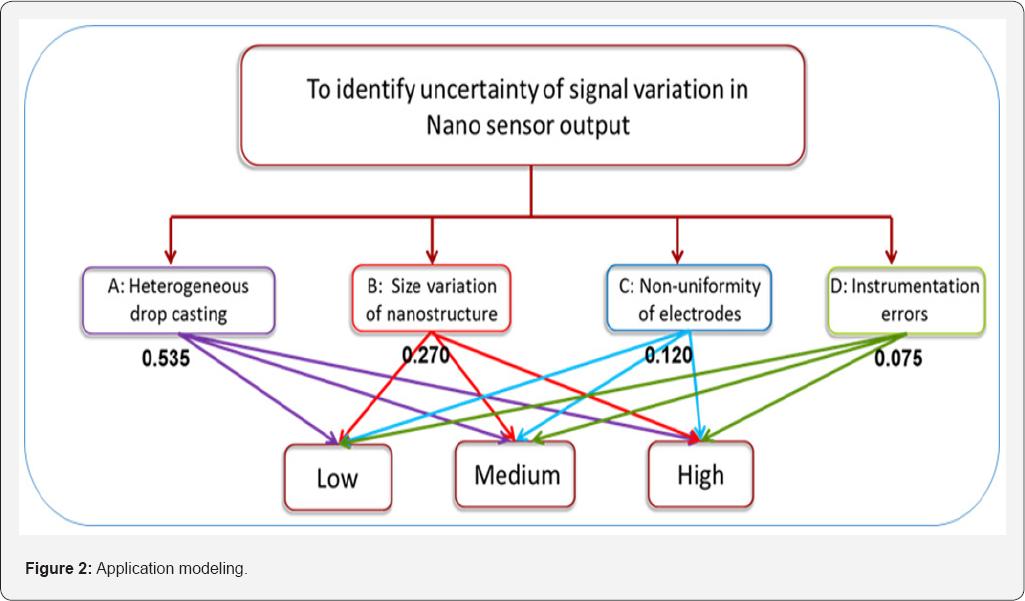
Therefore, we identified various influencing factors that are responsible for this signal variation based on the experimental setup conditions. More specifically, we employ an analytical technique [6-8] which relies on hierarchical structure connecting the factors identified (first level) and the severity of signal variation (last level) of our considered application problem. The quantitative analysis of our application is performed using the analytical process and modelled in a hierarchical structure in two levels shown in (Figure 2). The first level consists of factors - A: Heterogeneous drop casting; B: Size variation of Nanostructure; C: Non-uniformity of electrodes; D: Instrumentation errors. The last level with the degree of signal variation of low, medium and high.
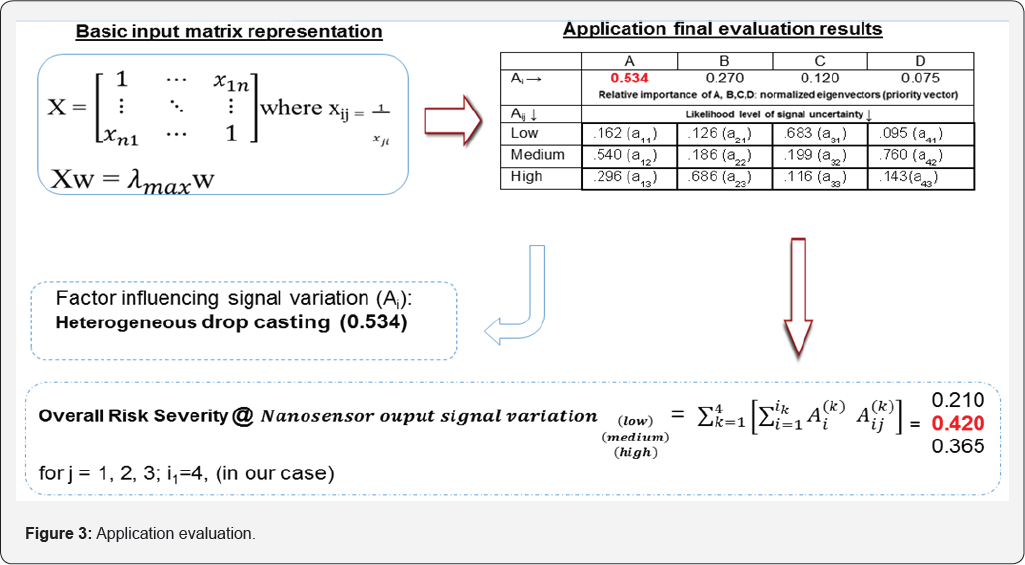
All individual influencing factors at first level are paired against each other and compared their relative importance as a judgement matrix with nine point scale proposed by Saaty [9], forming in one matrix. The last level in the hierarchy represents different levels of signal uncertainty (i.e. severity levels of low, medium and high), thus resulting in the formation of four matrices. The inputs for the matrices are based on the expert judgement and data patterns. Eventually, we compute the principal eigenvector that explains the most variation in the data with a consistency check [9]. In (Figure 3), we have shown the basic input matrix and the evaluation results computed from the five matrices mentioned (principal eigenvector values) along with the final outcome of our application. Eventually, on the application of the analytical model, we evaluate quantitatively.
a. The most influencing factor for the signal variation
b. The degree of severity of low, medium and high considering all the factors (overall level) of our application.
Thus, in our case, we found the most influencing factor as A: Heterogeneous drop casting with a value of 0.535 and signal variation at an overall level as medium (0.420) affecting nano biosensor (Figures 1-3). Finally, based on our quantitative analysis we conclude the most influencing factor to be heterogeneous drop casting effecting the signal variation and a medium level risk severity at an overall level (comprising all influencing factors) of multiplexed nano biosensor.


References
- Zheng G, Patolsky F, Cui Y, Wang WU, Lieber CM (2005) Multiplexed electrical detection of cancer markers with nano wire sensor arrays. Nat Biotechnol 23: 1294-301.
- Zheng G, Liber CM (2011) Nanowire Biosensors for Label-Free, Real-Time, Ultrasensitive Protein Detection. Methods Mol Biol 790: 223237.
- Patolsky F, Zheng G, Lieber C M (2006) Nanowire sensors for medicine and the life sciences. Nanomedicine (Lond) 1(1): 51-65.
- Ghosh S, Lincoln P, Petersen C, Valdes A (2014) Virus Detection in Multiplexed Nanowire Arrays using Hidden Semi-Markov models.
- Mohan KK, Verma AK, Srividya A, Papic L (2010) Integration of black-box and white-box modeling approaches for software reliability estimation. Int J Reliab Qual Saf Eng 17: 261-273.
- Mohan KK, Verma ASAK (2016) Prototype dependability model in software: an application using BOCR models. Int J Syst Assur Eng Manag 7(2): 167-182.
- Mohan KK, Srividya A, Verma AK (2010) ANP-based software reliability prediction using PoCs and subsequent employment of orthogonal defect classification measurements for risk mitigation during prototype studies. Int J Syst Assur Eng Manag 1(1): 11-16.
- Srividya A, Mohan KK, Verma AK (2009) Improvement of QoS in Process Centric Software Development Using ANP. In 2009 Third IEEE International Conference on Secure Software Integration and Reliability Improvement. IEEE Computer Society 451-452.
- Saaty TL (2003) Decision-making with the AHP: Why is the principal eigenvector necessary. European Journal of Operational Research 145: 85-91.


