


A New Long-Term Survival Distribution
Francisco Louzada and Pedro Luiz Ramos*
Institute of Mathematical Science and Computing, University of Sao Paulo, Brazil
Submission: March 18, 2017; Published: May 15, 2017
*Corresponding author: Pedro Luiz Ramos, Institute of Mathematical Science and Computing, University of Sao Paulo, Brazil, Email: pedrolramos@usp.br
How to cite this article: Francisco L , Pedro L R, A New Long-Term Survival Distribution. Biostat Biometrics Open Acc J. 2017;1(4): 555574. DOI: 10.19080/BBOAJ.2017.01.555574
Abstract
In this paper a new long-term survival distribution named long term weighted Lindley distribution is proposed. This new model allows us to fit data where a part of the population is not susceptible to the event of interest. This model can be used in clinical studies where a portion of the population can be cured during a treatment. An account of mathematical properties of the new distribution is presented such as moments and survival properties. The maximum likelihood estimators (MLEs) for the parameters are presented. A numerical simulation is carried out in order to verify the performance of the MLEs. Finally, an important application related to the leukemia free-survival times for transplant patients are discussed to illustrates our proposed distribution.
Keywords: Long-term survival distribution; new distribution; Survival model Weighted Lindley distribution
Introduction
Advances in computational methods and numerical simulations has made possible to incorporate efficient models that are capable to be used for describing real problems. Although generalizations of the standard exponential distribution are more common, many new distributions have been proposed based on the Lindley distribution, e.g., the generalized Lindley [1], extended Lindley [2], exponential Poisson Lindley [3] and Power Lindley [4] distribution, to list a few. Another important generalized was presented by Ghitany et al. [5], such distribution is known as weighted Lindley (WL) and its probability density function (p.d.f) is given by
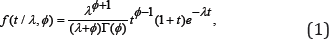
for all t>0, $>0 and λ>0 and 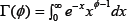 is the gamma function. Many properties of the WL were discussed earlier. Ghitany et al. [5] presented basic properties of the p.d.f., hazard function and the mean residual life function. Mazucheli et al. [6] compared different estimation procedures of the parameters of the WL distribution using numerical simulations. Wang &Wang [7] presented bias-corrected MLEs expression in which outperforms the other estimation procedures. Ali [8] considered a Bayesian approach and also presented the Bonferroni and the Lorenz curves, many entropies and order statistics for this distribution.
Recently, Ramos & Louzada [9] presented a three parameters generalized weighted Lindley distribution based on mixture of generalized gamma distribution. Although this distribution provided much flexibility in the hazard function, it does not allow us to fit data where a part of the population is not susceptible to the event of interest. For instance, in clinical studies a portion of the population can be cured during a treatment. Models that consider such characteristic are usually called long term survival models. In this study, a new long-term survival distribution is proposed, hereafter we shall call it the long term weighted Lindley distribution or simplistically the LWL distribution. Some mathematical properties for the LWL distribution is provided such as moments, survival properties and hazard function. The maximum likelihood estimators of the parameters and its asymptotic properties are discussed. We performed a numerical simulation to examine the performance of the MLEs. Finally, our proposed methodology is illustrated in a real data set related to the leukemia free-survival times (in months) for the 50 allogeneic transplant patients.
The paper is organized as follows. Section 2 reviews the weighted Lindley distribution. Section 3 presents the new long-term survival distribution. Section 4 discusses the inferential procedure based on MLEs. Section 5 displays the results of a simulation study in other to verify the performance of the MLEs. Section 6 illustrates the relevance of our proposed methodology in a real lifetime data. Finally, Section 7 summarizes the study.
Weighted Lindley Distribution
Finite mixture models have been received special attention in order to describe hetero-geneous survival data. The chosen model can be expressed as a mixture model given by

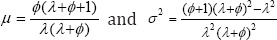
where p = λ/(λ+φ) and fj(t|λ,φ), j=1, 2 has p.d.f Gamma (φ+j-1,λ) distribution. Many mathematical results can be derived using the proposed structure. For instance, the mean and variance of the WL distribution can be easily computed by
Using this property Ghitany et al. [5] derived the survival function of T given by
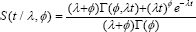
where is the upper incomplete gamma. The hazard function of the WL distribution is given by
The authors proved that the hazard rate function (2) is bathtub (increasing) shaped if 0 < φ < 1 (φ ≥ 1) for all λ > 0. Figure 1 shows some examples from its shapes under different values of φ and λ.

Cure Rate Model
An important aspect to be considered is the presence of long-term survivors where a portion of the population may be not susceptible to the event of interest (Maller and Zhou, [10]; or Perdona &Louzada [11]). In this case, we assume that the population is divided in two groups: a not susceptible to the event of interest with probability π and the other susceptible (in risk) to the event with probability (1-π). The long-term survivor is expressed as
where πЄ(0,1) and S0(t) is the survival function related to the susceptible group. The obtained survival function (not conditional) is improper and its limit corresponds to the individual proportion cure. From the survival function one can easily derive the p.d.f. given by

where f0(t) is the p.d.f. related to the susceptible group. Thus, from (3) and (4) the hazard function is given by
Considering that f0(t) follows a WL distribution, then the p.d.f of the LWL distribution is given by

where θ=c(λ,φ,π) is the vector of parameters and λ > 0, φ > 0 and πЄ(0,1). The the rth moments of T about the origin is
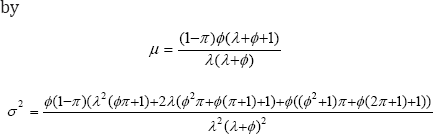
Therefore, the mean and variance of the LWL distribution can be easily computed
The survival function and the hazard function of the LWL distribution is given by
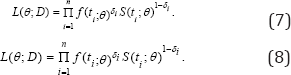
Figure 2 displays some examples from the shapes of the p.d.f. and the survival function of the LWL distribution

Inference
Let us consider the case where the failure time of the ith individual may not be observed and is subject to right censoring. Additionally, the random censoring times Cis are independent of Tis (non censored time) and their distribution does not depend on the parameters. In a sample of size n, the data set is D = (ti,δi), where ti = min(Ti,Ci) and δi=I(Ti ≤ Ci). This random censoring scheme has as sperial case type I and II censoring mechanism. The likelihood function is given by
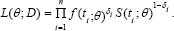
Let T1,...,Tn be a random sample of LWL distribution, the likelihood function considering data with random censoring is given by

The log-likelihood function is given as

The maximum likelihood estimation method is widely used in statistical inference. It has many desirable properties, including consistency, asymptotic efficiency and in-variance. The maximum likelihood estimators are obtained from the maximization of the log-likelihood function (10). Here, we performed directly the maximization of log-likelihood function using existing statistical packages. Further information about the numerical procedures will be discussed in the next section.
Under mild conditions the obtained estimators are consistent and efficient with an asymptotically normal joint distribution given by
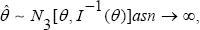
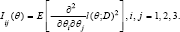
where I(θ) is the Fisher information matrix, 3 x 3 and Iij(θ), is the Fisher information of 0 in i and j given by
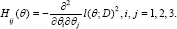
Since it is not possible to compute the Fisher information matrix, an alternative is to consider the observed information matrix, where the terms is given by
For large samples, approximated confidence intervals can be constructed for the individual parameters θi i = 1,...,3, assuming a confidence coefficient 100(1 - γ)%, the marginal distributions is given by

Simulation Study
In this section a simulation study is presented to compare the efficiency of the maximum likelihood method. This procedure is conducted by computing the mean relative errors (MRE) and the mean square errors (MSE) given by
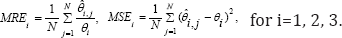
where N is the number of estimates obtained through the MLE approach. The 95% coverage probabilities of the asymptotic confidence intervals are also evaluated. From our approach, it is expected that the MLEs returns the MREs closer to one with smaller RMSEs. Additionally, considering a 95% confidence level, the frequencies of intervals that covered the true values of 0 should be closer to 95%.
The simulation study is performed considering the values: θ= ((0.5, 2, 0.3),(0.5, 2, 0.6), (3, 2, 0.3),(3, 2, 0.6)), N = 10, 000 and n = (10, 25, 50, 100, 200). We have considered two scenarios where we obtained approximately 0.3 and 0.6 proportions of censored data, i.e., 30% and 60% of censorship. Since the censoring is random, we may observe different proportions of censoring for each data set. However, considering this approach we expected that the mean of the proportions of censored observations Mp return the nominal level assumed. It is worth mentioning that, the results of this simulation study were similar for different choices of θ. The maxLik package available [12] in R was considered to find the maximization of the log-likelihood function [10]. This estimation procedure is well-behaved as we have not faced numerical problems, such as evidence of failure of convergence or end on multiple maxima. The programs can be obtained, upon request. Tables 1-4 display the MREs, MSEs, and the coverage probability with a 95% confidence level (C95%) of the estimates obtained through the MLE. From Tables 1-4, we observed that the estimates of λ, φ and π are asymptotically unbiased, i.e., the MREs tend to one when n increases and the MSEs decrease to zero for n large. Additionally, the coverage probabilities tend to 0.95,i.e., the MLEs has good coverage properties for the parameter estimators. Therefore, this estimation procedure can be used in practical applications as will be shown in the next section.


Cancer Data Application
In this section, we considered the data set presented by Ghitany & Al-Awadhi [13]. The data describes the leukemia free-survival times (in months) for the 50 allogeneic transplant patients. Table 5 shows the full data set (+ indicates censored observations).

The main authors considered the Burr XII distribution to fit the data under random censoring scheme. Although the maximum likelihood estimators were presented success-fully, the data clearly indicates the presence of a not susceptible group to the event of interest. Therefore, long-term survival distributions are more suitable to describe the proposed data set. Having discovered that, we considered the proposed LWL distribution to fit the data. However, firstly we would like to verify the behavior of the empirical hazard function. This can be achieved considering the TTT-plot (total time on test) proposed by Barlow and Campo [3]. The TTT-plot is obtained through the consecutive plot of the values [r/n, G(r/n)] where
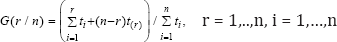
and ti is the order statistics. In case of the curve is concave (convex), the hazard function is increasing (decreasing), on the other hand if it's starts convex and then concave (concave and then convex) the hazard function has bathtub (inverse bathtub) shape.
Figure 3 presents the TTT-plot [14], the empirical survival function adjusted by the Kaplan-Meier estimator and the LWL survival distribution. Based on the TTT-plot there is an indication that the hazard function has bathtub failure rate. Comparing the empirical survival function with the adjusted by the LWL distribution we observed a goodness of the fit for our proposed model. The MLEs were obtained using the same procedure described in Section 5. Table 6 displays the MLEs, the standard error (SE) and the confidence intervals under 95% confidence level for φ, λ. Therefore, through our proposed methodology the data related to the leukemia free- survival times (in months) for the 50 allogeneic transplant patients can be described by the LWL distribution.


Discussion
In this paper, we have proposed a new long-term survival distribution, the so called long term weighted Lindley distribution and its mathematical properties were studied. The maximum likelihood estimators of the parameters and their asymptotic properties were discussed. The simulation study showed that the MLEs present efficient estimators for three unknown parameters even for small sample sizes. The practical importance of the LWL distribution was reported using an important data set related to the leukemia free- survival times (in months) for the 50 allogeneic transplant patients. Many extensions of the present work can be considered for instance, the inclusion of covariates x in the long-term survival term using the logistic link function given by π(x)= exp(x0β)/[1+exp(x0β)], where β is the vector of parameters related to the covariates. Other approach that can be considered is the presence of covariates under the assumption of Cox model, i.e., the proportional hazards. Finally, our analysis can be considered using the Bayesian approach.
Acknowledgement
The authors are thankful to the Editorial Board and to the reviewers for their valuable comments and suggestions. The research was partially supported by CNPq, FAPESP and CAPES of Brazil.
References
- Zakerzadeh H, Dolati A (2009) Generalized lindley distribution. Journal of Mathematical extension 3: 13-25.
- Bakouch HS, Al-Zahrani BM, Al-Shomrani AA, Marchi VA, Louzada F (2012) An extended lindley distribution. Journal of the Korean Statistical Society 41: 75-85.
- Barreto-Souza W, Bakouch HS (2013) A new lifetime model with decreasing failure rate. Statistics 47(2): 465-476.
- Ghitany M, Al-Mutairi D, Balakrishnan N, Al-Enezi L (2013) Power lindley distribution and associated inference, Computational Statistics & Data Analysis 64: 20-33.
- Ghitany M, Alqallaf F, Al-Mutairi D, Husain H (2011) A two-parameter weighted lindley distribution and its applications to survival dat. Mathematics and Computers in Simu-lation 81: 1190-1201.
- Mazucheli J, Louzada F, Ghitany M (2013) Comparison of estimation methods for the parameters of the weighted lindley distribution. Applied Mathematics and Computation 220: 463-471.
- Wang M, Wang W (2017) Bias-corrected maximum likelihood estimation of the parameters of the weighted lindley distribution. Communications in Statistics - Simulation and Computation 46(1): 530-545.
- Ali S (2015) On the bayesian estimation of the weighted lindley distribution. Journal of Statistical Computation and Simulation 85(5): 855-880.
- Ramos PL, Louzada F (2016) The generalized weighted lindley distribution: Properties, estimation and applications. Cogent Mathematics 3(1): 1256022.
- Maller RA, Zhou S (1995) Testing for the presence of immune or cured individuals in censored survival data. Biometrics pp. 51(4): 11971205.
- Perdona GC, Louzada-Neto F (2011) A general hazard model for lifetime data in the presence of cure rate. Journal of Applied Statistics 38(7): 1395-1405.
- Henningsen A, Toomet O (2011) maxlik: A package for maximum likelihood estimation in r. Computational Statistics 26(3): 443-458.
- Ghitany M, Al-Awadhi S (2002) Maximum likelihood estimation of burr xii distribution parameters under random cens-oring. Journal of Applied Statistics 29(7): 955-965.
- Barlow RE, Campo RA (1975) Total time on test processes and applications to failure data analysis. Tech Rep DTIC Document.


