


Zero Inflated Poisson and Zero Inflated Negative Binomial Models with Application to Number of Falls in the Elderly
Yusuf OB 1*, Bello T 2 and Gureje O2
1Department of Epidemiology and Medical Statistics, University of Ibadan, Nigeria
2Department of Psychiatry, University of Ibadan, Nigeria
Submission: March 15, 2017; Published: May 08, 2017
*Corresponding author: Yusuf OB, Department of Epidemiology and Medical Statistics, University of Ibadan, Nigeria, Email: bidemiyusufl@gmail.com
How to cite this article: Yusuf O, Bello T, Gureje O. Zero Inflated Poisson and Zero Inflated Negative Binomial Models with Application to Number of Falls in the Elderly. Biostat Biometrics Open Acc J. 2017;1(4): 555566. DOI: 10.19080/BBOAJ.2017.01.555566
Abstract
The presence of excess zeros and the problem of over-dispersion often occur with count data. Few methods have been developed to deal with extra zeros that occur in response count variables. Such methods include zero inflated Poisson (ZIP) and zero inflated negative binomial (ZINB) regression models. This analysis determined the best fitting model when the response variable is a count variable: number of falls in the elderly.
The data set consists of variables on number of falls as well as other covariates collected in a longitudinal study of the Ibadan study of ageing; a community-based survey, conducted in eight states in the south-western and north-central regions in Nigeria. Descriptive statistics were conducted to check for the presence of over-dispersion. Incidence rate ratios (IRR), and 95% CI were determined. Zero inflated Poisson and zero inflated negative binomial regression models were fitted. The best model was selected based on the values of Vuong z-statistic, -2logLL, AIC and BIC selection criteria. The Vuong z-statistic of the ZIP and ZINB models were 7.14 and 0 respectively. The results showed that the ZINB model gave the best fit with AIC of 3281.569 and -2LogLL of 3237.57. The ZINB identified chronic pain has a factor associated with number of falls. This study suggests the Zero inflated negative binomial regression as the best model for predicting number of falls in the presence of excess zeros and over-dispersion.
Keywords: Zero inflated Poisson regression; Zero inflated negative binomial regression; Falls in the elderly; Chronic pain
Background
Generalized linear models (GLMs) are powerful tools for analyzing count data. The starting point for count data is a GLM with Poisson-distributed errors, but not all count data meet the assumptions of the Poisson distribution. Therefore it is important to test if the variance > mean or if the number of zeros is greater than expected.
Usually when zeros occur in data sets, researchers or analysts deal with it as missing data, delete or impute data. At times these zeros have meanings and are important and should be dealt with as such. It may mean that that the subject or respondent did not experience the outcome and such data should not be considered as missing. Generally data should not be transformed to fit a linear model and, particularly, count data should not be log- transformed. Another approach commonly used is to make the variable a categorical one by considering the zeros as "outcome absent" and the observations as "outcome present". This is not a very good option either has the variable has been transformed and interest is no more in the number of occurrences.
A standard Poisson model would not distinguish between the two processes causing an excessive number of zeroes, but a zero- inflated model allows for and accommodates this complication. When analyzing a dataset with an excessive number of outcome zeros and two possible processes that arrive at a zero outcome, a zero-inflated model should be considered. A histogram of the response variable is drawn to see if the number of zeros is excessive. If two processes generated the zeroes in the response variable but there is not an excessive number of zeroes, a zero- inflated model may or may not be used.
In dealing with dependent variables with excess zeros, the generalized linear model (GLM) with Poisson distribution can be considered. However, the GLM with Poisson distribution does not deal with over dispersion particularly when it is due to excessive zeros [1]. However, the zero inflated model with Poisson distribution (ZIP) deals with excessive zero responses in count data. Theory suggests that the excess zeros can be modeled independently. The ZIP model has two parts: a poison count model and the logit model for predicting excess zeros. The zero inflated negative binomial regression is also for modeling count data with excessive zeros and it is usually for over dispersed count outcome variables. Again theory also suggests that the excess zeros are generated by a separate process from the count values and that the excess zeros can be modeled independently [2].
In this analysis, we considered the number of falls; a count variable with zero responses. If the respondent didn't experience a fall, the only possible outcome is zero. If the respondent experienced a fall, then it is a count process. Previous studies on falls have examined falls as a categorical variable by examining factors associated with its presence or absence [3-5]. Number of falls is usually a count variable and should be treated as such.
We determined the best fitting model between the zero inflated Poisson and the zero inflated negative binomial regression models in identifying the factors associated with number of falls in the elderly using data from the Ibadan Study for Ageing.
Methods
The Zero Inflated Poisson (ZIP) Regression Model
In Zero Inflated Poisson regression, the response Y = (Y1, Y2,...,Yn) is independent. The assumption of this model is that with probability p the only possible observation is 0, and with probability (1-p), a Poisson (λ) random variable is observed in Y. Therefore the occurrence of Yi follows this distribution:
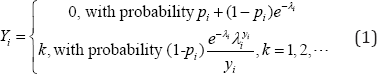
The mean and variance of ZIP distribution are respectively:
The Zero Inflated Negative Binomial (ZINB) Regression Model
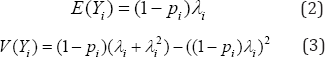
The Zero-Inflated Negative Binomial (ZINB) regression model assumes that there are two distinct data generation processes. The result of a Bernoulli trial is used to determine which of the two processes is used. For observation i, with probability πi the only possible response of the first process is zero counts, and with probability of 1-πi, the response of the second process is governed by a negative binomial with mean λi. The zero counts are generated from the first and second processes, where a probability is estimated for whether zero counts are from the first or the second process. The overall probability of zero counts is the combined probability of zeros from the two processes. Following Greene and Yau et al., a ZINB model for the response Yi is written as:
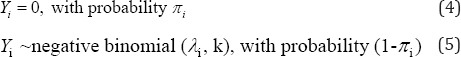
so that
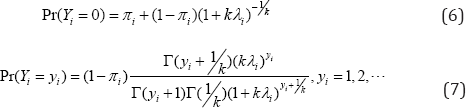
Where the mean and variance of the Yi are:
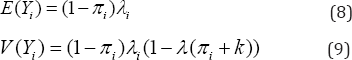
Where λi the mean of the underlying negative binomial distribution and k is the over-dispersion parameter.
Application: Number of falls in the elderly
Data Description and Exploratory data Analysis: The data set consists of variables on number of falls as well as other covariates collected in a longitudinal study of the Ibadan study of ageing, a community-based longitudinal survey, conducted in eight states in the south-western and north-central regions in Nigeria (Lagos, Ogun, Osun, Oyo, Ondo, Ekiti, Kogi and Kwara) over a four year period (2003/2004, 2007-2009). Respondents were elderly people aged 65 years or above who resided in the selected states. A multistage cluster sampling of households within enumeration areas (geographical units demarcated by the National Population Commission) within each state was employed. Only one respondent, who had provided consent, mostly verbal due to illiteracy or by choice, was selected per household. Information was collected using a questionnaire that contained socio-demographic, social engagement and health characteristics as well as questions on falls. At baseline in 2003/2004, 2149 respondents completed the study. Respondents were subsequently followed up yearly from 2007 to 2009. Only the baseline data were used for this analysis. The data were weighted to account for the clustering.
The outcome variable was number of falls in the last 12 months, while independent variables were socio demographic characteristics: age, sex, years of education, wealth index developed using principal component analysis to create 5 wealth quintiles: poorest, poorer, middle, richer, richest. The wealth index was constructed using the asset approach whereby all household possessions are included as much as possible. Items used for the wealth index include: wall clock, bucket, radio, cell phone, motor bike, fan, gas or electric stove, video cassette, bicycle, television, air conditioner, livestock, personal computer, clothes iron, deep freezer, refrigerator, and motor vehicle. The reliability, precision and accuracy of the wealth index increases when many items are used for its computation [6]. Other explanatory variables considered were presence of chronic medical conditions such as arthritis, insominia, and presence of chronic pain. A total of 2118 respondents answered the question: how many times have you fallen in the last 12 months? Of these, 475 had fallen 1 time, 91 had fallen 2 times, 63 had fallen 3 times, etc., We checked for the number of zeros {zeros =1643 (77.57%)}, and then examined the means (mean=0.4759, variance =1.304) and confirmed that variable (number of falls) was over dispersed. Features of data suggest the use of zero inflated models. Figure 1 shows the number of falls. The ZIP and ZINB models were fitted. Model selection and comparison were done using the Akaike information criteria (AIC), Bayesian Information criteria (BIC), -2log LL as well as the Voung test.

Results
A total of 475 (22.4%) respondents reported having 1 or more fall while 1643 had zero falls. About a third (30.6%) were above 80years, slightly above half (53.4%) were females, 25.8% lived in the urban areas and about half (50.3%) were married. Majority (70.8%) had no medical condition, 79.1% had chronic pain and 25.6% were visually impaired. Table 1 shows the characteristics of the respondents.

Results from the ZIP model
The number of falls was approximately lower by 23.2% among female respondents compared to male respondents (IRR = 0.768, 95% CI: 0.594, 0.991). Number of falls among respondents from rural areas was higher by 34.0% (IRR = 1.340, 95% CI: 1.025, 1.751) compared to respondents from urban areas. Respondents who had a chronic medical condition had a 19.1% decrease in number of falls (IRR = 0.809, 95% CI: 0.668, 0.981) compared to respondents who had no medical condition. The risk of experiencing a fall increased by 28.8% among respondents who were visually impaired (IRR = 1.288, 95% CI: 1.076, 1.541) compared to respondents who were not visually impaired, however, this was not significant.
For the absolute zero group, the risk of being in the absolute zero group among female respondents decreased by 44.3% (IRR = 0.557, 95% CI: 0.379, 0.818) compared to male respondents. In addition, the risk of being in the absolute zero group among respondents with chronic pain decreased by 39.2% (0.608, 95% CI: 0.421, 0.877) compared to respondents with no chronic pain. The risk of being in the absolute zero group for respondents in semi-urban areas decreased by 21.5% (0.785, 95% CI: 0.544, 1.134) compared to respondents in urban areas. However the risk of being in the absolute zero group for respondents in rural areas increased by 5.2% (1.052, 95% CI: 0.710, 1.558) compared to respondents in urban areas. Location was found to be non-significant. The risk of being in the absolute zero group for respondents that were visually impaired increased by 59.7% (1.597, 95% CI: 0.786, 1.398) compared to respondents who were not visually impaired, but this result was not significant. Table 2 shows the parameter estimates from the zero inflated Poisson regression.

*reference category, Voung test of ZIP vs. Standard Poisson z =7.14
Results from the ZINB model
Respondents who had chronic pain had a 67.0% increase in number of falls (IRR = 1.670, 95% CI: 1.217, 2.292) compared to respondents who had no pain. Respondents who were visually impaired had a 36.4% increase in number of falls (IRR = 1.364, 95% CI: 1.042, 1.786) compared to respondents that were not visually impaired. Number of falls was approximately higher by 35.4% among female respondents compared to male respondents (IRR = 1.354, 95% CI: 0.961, 1.907). Number of falls among respondents from semi-urban and rural areas were higher by 26.7% (IRR = 1.267, 95% CI: 0.931, 1.725) and 29.4% (IRR = 1.294, 95% CI: 0.917, 1.825) respectively compared to respondents from urban areas. Respondents who had elementary occupation had an 18.1% increase in number of falls (IRR = 1.181, 95% CI: 0.775, 1.800) compared to respondents who had skilled/higher level occupation. However, respondents who were traders had a 21.1% decrease in number of falls (IRR = 0.789, 95% CI: 0.506, 1.231) compared to respondents who had skilled/higher level occupation. Sex, location, marital status and occupation were not significantly associated with number of falls. Table 3 shows the parameter estimates from the zero inflated negative binomial regression.

Model Comparison and Selection
We used the AIC, BIC, -2log LL and Voung statistic for model comparison and selection. For the ZIP model, AIC was 3466.944 while for the ZINB, AIC was 3281.569. In addition, the -2logLL was 3386.994 and 3237.57 for the ZIP and ZINB models respectively (Table 4).

Discussion
In this study we identified and quantified the relationships between frequency of falls in the elderly and selected variables in the presence of over dispersion by using zero inflated regression models. The number of falls was over dispersed and the zero inflated negative binomial models were the preferred model in identifying the factors associated with falls. Mixed probability distributions were used to model the zero and non zero counts. The estimated results are efficient and non - biased. Our results showed that the standard errors from the zero inflated Poisson model were smaller than those of the zero inflated negative binomial model which could have led to some insignificant regression parameters. These large standard errors in the ZINB model suggest that in the presence of over dispersion, the ZIP model overstates the significance of the regression parameters and the significance of the evaluation factors. This is compatible with findings from other studies [7-10]. The ZINB was the best model selected based on the values of the model selection test/ criteria utilized.
About a quarter of the respondents reported experiencing 1 or more fall. This low rate of fall had been discussed extensively by Bekibele and Gureje [3]. In addition, this rate is comparable with reports from Japan [11], China [12], but low when compared to Australia [13], Spain [14], Italy [15], Brazil and Iran [16-19]. The ZIP model showed that female sex, being separated, or widowed, having chronic medical condition, fourth wealth quintile were significantly associated with number of falls. However, the ZINB identified chronic medical pain as the only predictor of falls in the elderly. Previous studies in which fall in the elderly was treated as a categorical variable have identified regular medication, depression, sufficient exercise, wearing slippery shoes, as significant factors of falls in the elderly [5]. However, in another analysis where falls had been used as a categorical variable, chronic pain was the only significant factor associated with falls using the binary logistic regression [3]. Similarly, our findings using the ZINB model also identified presence of chronic pain as the only significant factor associated with number of falls in the elderly. We however note that in carrying out the ZINB model, we used the option "constant" for the inflate part in the analysis procedures in stata; and we reported the modeling of the non zero counts. We didn't include the covariates in the inflation part of the ZINB model because it disrupted the model from converging; hence the option was deleted.
This study demonstrated that the ZINB model is the best model to determine the factors that predict the frequency of falls in the elderly when there is an indication of the presence of excess zeros and over dispersion. It is recommended that objective criteria should be used to select appropriate statistical models for analysing count data in the presence of over dispersion.
References
- Hinde J, Demetrio C (1998) Overdispersion models and estimation. Computational Statistics and Data Analysis 27(2): 151-170.
- Lambert D (1992) Zero-Inflated Poisson Regression, with application to defects in manufacturing. Technometrics 34(1): 1-14.
- Bekibele CO, Gureje O (2010) Fall Incidence in a Population of Elderly Persons in Nigeria. Gerontology 56(3): 278-283.
- Takahiro, Kondo K, Suzuki K, Yamada M, Matsumoto D (2014) Factors Associated with Falls in Community-Dwelling Older People with Focus on Participation in Sport Organizations: The Japan Gerontological Evaluation Study Project. Bio Med Research International 2014 (2014): 1-10.
- Piyathida K, Prasert P, Bangonsri J (2013) Factors related to falls among community Dwelling elderly. South east Asian J Trop Med Public Health 44(5): 906-915.
- Rutstein SO, Staveteig S (2013) Making the Demographic and Health Surveys Wealth Index Comparable. In: IUSSP Int Popul Conf 26-31 BEXCO, Busan, Korea, p. 1-59.
- Piza BEL (2013) Using Poisson and Negative Binomial Regression Models to Measure the Influence of Risk on Crime Incident Counts 2012.
- Ismail N, Jemain AA, (2007) Handling overdispersion with negative binomial and generalized poisson regression models. Casualty Actuarial Society Forum Winter pp. 103-158.?
- Sadia F (2013) Performance of generalized Poisson regression model and negative binomial regression model in case of over-dispersion count data. IASIR pp. 558-563.
- Islam MM, Alam M, Tariquzaman M, Kabir MA, Pervin R, et al. (2013) Predictors of the number of under-five malnourished children in Bangladesh: application of the generalized poisson regression model. BMC Public Health 13: 11.
- Yoshida H, Kim H (2006) Frequency of falls and their prevention. Clin Calcium 16(9): 1444-1450.
- Chu LW, Chiu AY, Chi I (2008) Falls and subsequent health service utilization in community-dwelling Chinese older adults. Arch Gerontol Geriatr 46(2): 125-135.
- Gill T, Taylor AW, Pengelly A (2005) A population-based survey of factors relating to the prevalence of falls in older people. Gerontology 51(5): 340-345.
- Varas-Fabra F, Castro Martin E, Perula de Torres LA, Fernandez Fernandez MJ, Ruiz Moral R, et al. (2006) Falls in the elderly in the community: prevalence, consequences, and associated factors. Aten Primaria 38(8): 450-455.
- Mancini C, Williamson D, Binkin N, Michieletto F, DeGiacomi GV, et al.(2005) Epidemiology of falls among the elderly. Ig Sanita Pubbl 61(2): 117-132.
- Perracini MR, Ramos LR (2002) Fall related factors in a cohort of elderly community residents. Rev Saude Publica 36(6): 709-716.
- Siqueira FV, Facchini LA, Piccini RX, Tomasi E, Thume E, et al. (2007) Prevalence of falls and associated factors in the elderly. Rev Saude Publica 41(5): 749-756.
- Abolhassani F, Moayyeri A, Naghavi M, Soltani A, Larijani B, et al. (2006) Incidence and characteristics of falls leading to hip fracture in Iranian population. Bone 39(2): 408-413.
- Piza BEL (2012) Using Poisson and Negative Binomial Regression Models to Measure the Influence of Risk on Crime Incident Counts. 2012.


