




 ARR Home



Abstract
The quality of irrigation water available to farmers has a significant impact on crops as well as yields. Therefore, there is a need to better understand irrigation water quality. The present study mainly focuses on the assessment of the suitability of groundwater in the Tormabum agricultural basin in Sierra Leone. Groundwater samples from different locations in and around Tormabum were collected and then tested in the laboratory for various physical as well as chemical parameters such as electrical conductivity (EC), total dissolved solids (TDS), pH, some major cations (Ca²⁺, Mg²⁺, Na⁺, Fe²⁺) and some anions (NO₃⁻, HCO₃⁻, Cl⁻). Water quality indices, namely sodium adsorption ratio, Kelly's ratio and permeability index were also determined. The evaluation of Sodium Adsorption Ratio (SAR < 0.113) and Kelly's Ratio (KR < 0.123) consistently confirms negligible sodium hazards, indicating excellent overall groundwater suitability for irrigation. The Permeability Index (PI) exhibited strong seasonal improvement, rising from 49.7% in the dry period to 94.8% during peak rains. Seasonal rainfall enhanced water quality through dilution, while boreholes provided more chemically stable profiles than hand-dug wells, yet the combined indices affirm that most groundwater sources are safe for sustainable irrigated agriculture with site-specific soil amendments for high-magnesium outliers.
Keywords: Sodium Adsorption Ratio; Kelly’s Ratio; Irrigation; Groundwater
Abbreviations: EC: Electrical Conductivity; TDS: Total Dissolved Solids; SAR: Sodium Adsorption Ratio; KR: Kelly's Ratio; PI: Permeability Index; PS: Potential Salinity; MH: Magnesium Hazard; FAO: Food and Agriculture Organization; ANOVA: Analysis of Variance; USSL: United States Salinity Laboratory; RSC: Residual Sodium Carbonate
Introduction
Agriculture plays a crucial role in Sierra Leone’s economy, employing a significant portion of the population and contributing to food security. The country’s agricultural sector is largely rain-fed, making it vulnerable to climate variability and inconsistent rainfall patterns. Irrigation is critical in improving agricultural productivity and ensuring year-round farming. However, irrigation development in Sierra Leone remains limited, primarily due to inadequate water infrastructure, limited technical expertise, and financial constraints.
Groundwater has been a critical resource for agricultural production, particularly in areas and periods in which surface water has been limited [1-3]. Poor groundwater quality affects the chemical and physical properties of soils, negatively impacting crop yields [3,4]. The increasing unpredictability of rainfall due to climate change, coupled with the growing demand for food production, has made it imperative to explore groundwater as an alternative water source for irrigation [5]. Groundwater availability depends on hydrogeological conditions, aquifer recharge rates, and extraction potential. Additionally, groundwater quality influences its suitability for irrigation. Groundwater in any region possesses a distinct chemical signature, which is primarily shaped by factors such as rock–water interaction, temperature, mineral dissolution, soil–water interaction, the duration of contact, and various human activities [6,7].
A key methodology for monitoring groundwater quality entails comparing in-situ parameter concentrations with established national or international benchmarks [8]. Concurrently, the application of indices, including the IWQI and the SAR, has been widely adopted in research to appraise the fitness of groundwater for irrigation use [9,10]. While drinking water quality is typically judged by the concentrations of major cations (Na⁺, Ca²⁺, Mg²⁺, K⁺), anions (Cl⁻, SO₄²⁻, HCO₃⁻, CO₃²⁻, NO₃⁻), and heavy metals, irrigation water quality relies more heavily on a suite of derived indices. These include the sodium adsorption ratio (SAR), sodium percentage (SSP), Kelly's ratio (KR), permeability index (PI), potential salinity (PS), magnesium hazard (MH) and total dissolved solids (TDS) [11,12]. These specific metrics measure the water's total salt content and its potential to cause sodium-induced soil crusting, both of which severely restrict agricultural crop yields.
Irrigation and groundwater resources are intrinsically linked. In this context, the present paper characterizes groundwater quality for agricultural use through selected indices (SAR, %Na, PI, MH, and TDS), which are computed from baseline parameters such as K⁺, Ca²⁺, Cl⁻, Na⁺, Mg²⁺, NO₃⁻, SO₄²⁻, and HCO₃⁻.This study can further assist in the development of a sustainable management of the groundwater for various agricultural practices for the local farmers as well as policy makers. The study would provide data-driven insights for optimizing groundwater use in agriculture while ensuring environmental sustainability.
Methodology
Study site
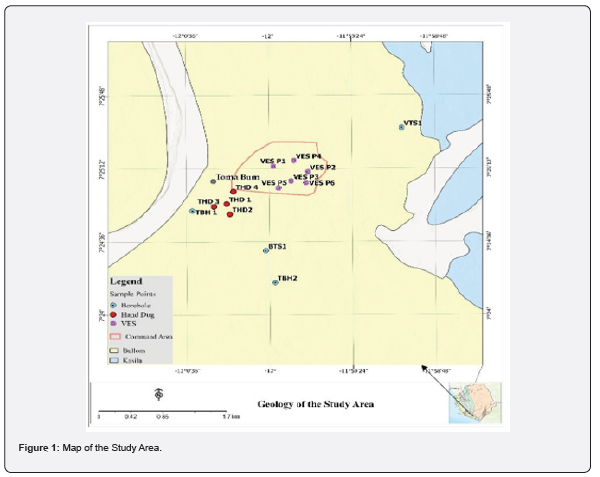
Tormabum is located at a latitude of 7° 24' 54" N and a longitude of 12° 0' 22" W, in the southern region of Sierra Leone (Figure 1), within the floodplain of the Sewa River. The area is predominantly underlain by alluvial sand and silt deposits of fluvial origin, with minor clay intercalations. These unconsolidated sediments have been deposited over time through riverine processes and form extensive shallow aquifers that are typically unconfined. The region experiences a tropical climate characterized by a distinct wet season (May to October) and dry season (November to April), which significantly influences groundwater recharge. Agricultural activities are widespread, and there is increasing interest in harnessing groundwater resources for irrigation during the dry season when surface water is scarce. Understanding the geological framework and aquifer behavior is essential for optimizing water use and ensuring sustainability.
Groundwater sampling and analyses
In this study, Eight (8) representative sampling shallow wells and boreholes were selected in such a way that they represented different geological formations and anthropogenic activities at varying topography of the study area. Groundwater samples were collected during peak dry (March 2024), start of rain (May)and peaky rainy (July 2024) seasons from shallow wells and boreholes drilled for rural water supply using standard sampling procedures [13].
To evaluate whether groundwater was suitable for irrigation, water samples were collected from a representative selection of boreholes and hand-dug wells. The sampling process followed standard procedures to avoid contamination. Samples were gathered in clean polyethylene containers, kept cool, and transported to an accredited laboratory for analysis. Parameters measured included pH, electrical conductivity (EC), total dissolved solids (TDS), sodium (Na⁺), chloride (Cl⁻), nitrate (NO₃⁻), and salinity levels that can significantly impact soil health and crop yields. Since shallow alluvial aquifers are vulnerable to surface contamination, special attention was given to detecting high nitrate levels and salinity buildup. The results were compared with international irrigation water quality standards, especially those established by the Food and Agriculture Organization (FAO). Analysis of Variance (ANOVA) was applied to test for significant differences in water quality parameters across sampling locations and time intervals.
Irrigation Quality Indices: Analytical Standards and SAR/KR Calculation
The primary physico-chemical determinants selected for assessment included electrical conductivity (EC) and total dissolved solids (TDS) as proxies for overall salinity hazard; pH and bicarbonate (HCO₃⁻) to characterize the water's acid-base equilibrium and buffering capacity; and the major cations: sodium (Na⁺), calcium (Ca²⁺), and magnesium (Mg²⁺), alongside chloride (Cl⁻), nitrate (NO₃⁻), and iron (Fe) to evaluate specific toxicities and operational constraints. The suitability thresholds and hazard classifications applied in this study were benchmarked against the internationally recognized FAO irrigation water quality guidelines [14] and the United States Salinity Laboratory (USSL) diagram, which collectively provide categorical designations for salinity (C1–C4) and sodicity (S1–S4) hazards [15].
To quantitatively assess the risk of sodium-induced soil dispersion, permeability reduction, and surface crusting, two complementary sodicity indices were computed: the Sodium Adsorption Ratio (SAR) and the Kelly Ratio (KR). For both calculations, all ionic concentrations, originally reported in milligrams per liter (mg/L), were first stoichiometrically converted to milliequivalents per liter (meq/L) using the respective equivalent weights [16].
The SAR was thereafter derived using the standard empirical relationship:
accounts for the disproportionate effect of sodium on soil cation exchange sites relative to the square root of the divalent cation sum.
Concurrently, the Kelly Ratio was computed as the linear quotient
Under this analytical protocol, water is classified as non-sodic and structurally safe when SAR values fall below 10 and KR remains beneath 1.0, thereby indicating that sodium concentrations are adequately balanced by calcium and magnesium to preserve soil aggregate stability and sustained infiltration rates over prolonged irrigation cycles.
The permeability index (PI) is an indicator to study the suitability water for irrigation purpose. Water movement capability in soil (permeability) is influenced by the long-term use of irrigation water (with a high concentration of salt) as it is affected by Na+, Ca2+, Mg2+ and HCO3- ions of the soil. PI formula has been developed by [17], to assess water movement capability in the soil as the suitability of any kind of source of water for irrigation, and it is formulated as Eq. (3):
Results and Discussion
General water quality characteristics
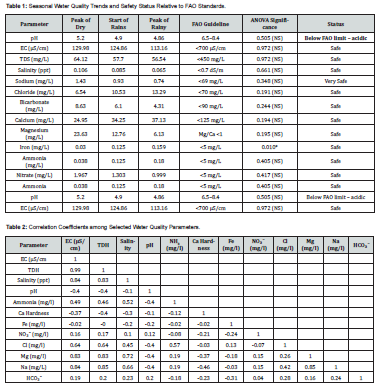
A general dilution effect was observed during the rainy season. Mean electrical conductivity (EC) declined from approximately 130.0 to 113.2 µS/cm, total dissolved solids (TDS) from 64.1 to 44.7 mg/L, and salinity from 0.11 to 0.07 ppt across the March (peak of dries) –July (peak of rains) transect (Table 1). Similarly, magnesium and bicarbonate exhibited notable reductions, with mean concentrations falling from 23.6 to 6.1 mg/L and from 8.6 to 4.3 mg/L, respectively, following the onset and peak of rains. Conversely, calcium and chloride displayed slight increasing trends, with mean values rising from 25.0 to 37.1 mg/L and from 6.5 to 13.3 mg/L, respectively.
Despite these seasonal oscillations, analysis of variance (ANOVA) in Table 1 indicated that the observed fluctuations were not statistically significant (p> 0.05) for most parameters, except for iron (Fe). Iron concentrations exhibited a marked and statistically significant increase, rising from a mean of 0.03 mg/L during the March period to 0.16 mg/L at the peak of the rains in July (p = 0.010). Nevertheless, the maximum recorded concentrations of iron (0.33 mg/L), sodium (4.01 mg/L), calcium (67.00 mg/L), magnesium (90.00 mg/L), chloride (26.00 mg/L), bicarbonate (21.00 mg/L), and ammonia (0.51 mg/L) all remained substantially below their respective FAO maximum admissible concentrations. Overall, the groundwater in the study area is chemically suitable for irrigation and domestic purposes with respect to dissolved salts and metals. However, the persistently acidic pH values present a significant exception that warrants careful management consideration, particularly regarding potential soil acidification and crop health.
Correlational analysis of water quality parameters
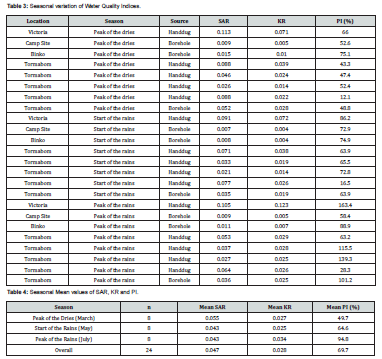
A correlational analysis was conducted to assess the degree of association between key water quality parameters. This helps identify potential sources of water chemistry variations and interrelationships that influence overall groundwater quality. The near-perfect correlation between EC and TDH (r = 0.99) indicates that TDH effectively mirrors total dissolved ionic concentration, making these two parameters functionally interchangeable in this dataset (Table 2). The strong positive associations of EC and TDH with salinity (r = 0.84), magnesium (r = 0.83), and sodium (r = 0.85) clearly identify these cations as the principal drivers of electrical conductivity. The moderate yet significant correlation of chloride with EC (0.64) and ammonia (0.57) further supports the influence of saline water intrusion, while also suggesting that ammonia may be introduced alongside chloride-rich sources rather than through independent pollution pathways. A consistent negative correlation between pH and most major ions including EC, TDH, salinity, chloride, magnesium, and sodium (r ≈ -0.4) implies that increasing ionic strength is systematically accompanied by a shift toward more acidic water conditions.
Ammonia shows positive correlations with salinity (0.52) and EC (0.49), and a negative correlation with pH (-0.4). Calcium hardness exhibits negative correlations with sodium (-0.46), magnesium (-0.37), and EC/TDH (-0.4). Iron, nitrate, and bicarbonate display near-zero or weak correlations with most parameters (e.g., Fe with EC = -0.02; NO₃ with pH = 0.12). Bicarbonate has marginal correlations with chloride (0.28) and sodium (0.24), and a negligible correlation with EC (0.19). Nitrate has near-zero correlations with ammonia (-0.08) and pH (0.12), and a trivial correlation with salinity (0.10).
Seasonal variation of irrigation water quality indices
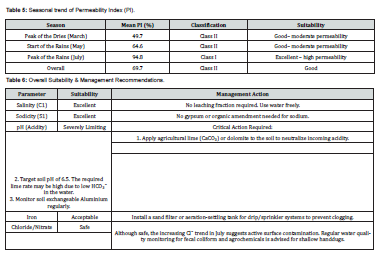
The suitability of groundwater for irrigation was evaluated using four key indices: Sodium Adsorption Ratio (SAR), Kelly's Ratio (KR), Permeability Index (PI), and Residual Sodium Carbonate (RSC). These indices were calculated for 24 water samples collected from hand-dug wells and boreholes across three seasonal phases: Peak of the Dries (March, n=8), Start of the Rains (May, n=8), and Peak of the Rains (July, n=8). The results are summarized in Table 3 and seasonal mean values are presented in (Table 4).
Seasonal variation of sodium adsorption ratio (SAR)
The Sodium Adsorption Ratio (SAR) is a critical parameter for assessing the sodium hazard in irrigation water, as it indicates the risk of soil dispersion and structural degradation due to sodium accumulation on soil exchange sites. According to the Richards (1954) classification, SAR values below 10 are classified as S1 (Low Sodium Hazard), indicating suitability for irrigation on all soil types. The SAR values across all samples ranged from 0.007 to 0.113, with a seasonal mean of 0.047. This extremely low range places all samples firmly within the S1 category, indicating no sodium-related soil dispersion risk throughout the study period.
A slight decreasing trend was observed from the Peak of the Dries (mean SAR = 0.055) to the Start of the Rains (mean SAR = 0.043), with values stabilizing at the Peak of the Rains (mean SAR = 0.043). This subtle decline is attributed to rainwater dilution, where low-sodium rainwater recharges the aquifers and flushes out soluble sodium salts. The consistent stability between May and July suggests that the aquifer system reaches a new equilibrium following the initial recharge pulse.
Source-Based comparison and implications for irrgation
Hand-dug wells consistently exhibited slightly higher SAR values (mean = 0.064) compared to boreholes (mean = 0.020). This is expected, as shallow hand-dug wells are more susceptible to surface influences, including sodium inputs from soil leaching and anthropogenic activities. Boreholes, being deeper and more confined, receive water that has undergone longer residence times and greater filtration, resulting in lower sodium concentrations. The uniformly low SAR values across all seasons and sources confirm that sodium hazard is not a limiting factor for irrigation in this study area. Soil structural integrity is unlikely to be compromised by sodium-induced dispersion, and crops grown with this water face negligible risk of sodium toxicity. This finding is further supported by the very low absolute sodium concentrations (0.12 – 4.01 mg/L) observed in the raw water quality data.
Seasonal Variation of Kelly's Ratio (KR) and implication for irrigation
Kelly's Ratio (KR), defined as the ratio of sodium to calcium and magnesium
, provides a simple indicator of sodium suitability for irrigation. According to Kelly (1963), values below 1.0 indicate safe water for irrigation, while values exceeding 1.0 suggest unsuitability due to sodium hazard. KR values ranged from 0.004 to 0.123, with a seasonal mean of 0.028. All values were well below the threshold of 1.0, confirming that all water sources are safe for irrigation with respect to sodium. Seasonally, KR exhibited remarkable stability, with mean values of 0.027 (March), 0.025 (May), and 0.034 (July). The slight increase in July is primarily attributed to the significant reduction in magnesium concentrations during the peak rainy season (from 23.6 mg/L in March to 3.3 mg/L in July), which effectively increases the Na/(Ca+Mg) ratio despite sodium concentrations declining simultaneously. This observation underscores the importance of considering magnesium dynamics when interpreting KR, as magnesium depletion can artificially elevate the ratio even when sodium levels are low.
Hand-dug wells showed marginally higher KR values (mean = 0.043) compared to boreholes (mean = 0.010), mirroring the pattern observed for SAR. This reflects the higher sodium and magnesium concentrations typically found in shallow wells due to surface-soil interactions. The universally low KR values indicate that sodium is not a concern for irrigation in this region. Farmers can safely use groundwater from both hand-dug wells and boreholes without risk of sodium-induced soil permeability problems. The KR results corroborate the SAR findings, providing strong evidence for the overall low sodium hazard of these water sources.
Seasonal variation of permeability index (PI)
The Permeability Index (PI), developed by Doneen (1964), assesses the long-term effect of irrigation water on soil permeability. It is particularly sensitive to the relative proportions of calcium, magnesium, sodium, and bicarbonate. According to Doneen's classification:
a) Class I (> 75%): Excellent permeability – suitable for all soils
b) Class II (25 – 75%): Good permeability – suitable for most soils with moderate management
c) Class III (< 25%): Poor permeability – unsuitable or requiring soil amendments
The PI exhibited the most pronounced seasonal variation (Table 5) of all indices, with mean values increasing dramatically from 49.7% (March) to 64.6% (May) and surging to 94.8% (July). This remarkable increase may be driven by two key geochemical processes:
i. Declining Magnesium: Magnesium concentrations dropped sharply from 23.6 mg/L (March) to 3.3 mg/L (July). Since magnesium appears in the denominator of the PI formula , its reduction causes the denominator to shrink, inflating the PI value. This is particularly evident in samples where magnesium approached zero (e.g., T HD 01 July with Mg = 0.00 mg/L, PI = 115.5%).
ii. Increasing Calcium: Calcium hardness increased from 24.9 mg/L (March) to 39.9 mg/L (July). The term in the numerator contributes positively to PI, further amplifying the index during the wet season when enhanced weathering releases more calcium into the groundwater (Table 6).
Conclusion
Overall, the data shows that EC and TDH are good markers of salt content (mostly sodium, magnesium, and chloride), with pH falling as salts rise, while calcium hardness decreases as it gets swapped out by other ions. But since iron, nitrate, and bicarbonate do not follow this pattern, it shows that other natural processes beyond simple salinization are at play, meaning we must consider these separately for good water quality management and source identification. The seasonal dynamics of SAR, KR and PI, indicate that groundwater in the study area is of good to excellent quality for irrigation, with no sodium, alkalinity, or carbonate hazards. The rainy season improves water quality through dilution, while hand-dug wells show greater variability than boreholes. Only localized anomalies (T HD 03) present significant permeability constraints. With appropriate management, the groundwater resources of the study area are suitable for sustained irrigated agriculture.
References
- Wederni K, Haddaji B, Hamed Y, Bouri S, Colombani N (2024) Controversial insights into irrigation water quality in arid and semi-arid regions using AI driven predictions: Case of southern Gabès. Groundwater for Sustainable Development 27: 101381.
- Madhusudhan MS, Rajendra HJ, Surendra HJ, Anusha M (2024) Groundwater quality evaluation using Water Quality Index (WQI) under GIS framework for Mandya City, Karnataka. Sustainable Water Resources Management 10: 21.
- Boukich O, Ben-tahar R, Brahmi M, Alzain MN, Noman O, et al. (2025) Assessment of groundwater quality for irrigation using a new customized irrigation water quality index. Journal of Hydrology: Regional Studies 59: 102346.
- Ez-zaouy Y, Bouchaou L, Hssaisoune M, Aangri A, Busico G, et al. (2025) Groundwater vulnerability and, risk assessment of seawater intrusion for the development of a strategy plan towards sustainability: Case of the Souss-Massa coastal area, Morocco. J Hydrol Reg Stud 57: 102128.
- FAO (2016) AQUASTAT Main Database. Food and Agriculture Organization of the United Nations.
- Subba Rao N (2002) Geochemistry of groundwater in parts of Guntur District, Andhra Pradesh, India. Environ Geol 41: 552-562.
- Bera A, Das S (2021) Water resource management in semi-arid Purulia District of West Bengal, in the context of sustainable development goals. In: Shit PK, Bhunia GS, Adhikary PP, Dash CJ (eds) Groundwater and society. Springer, Cham.
- Gad M, Gaagai A, Agrama AA, El-Fiqy WF, Eid MH, et al. (2024) Comprehensive evaluation and prediction of groundwater quality and risk indices using quantitative approaches, multivariate analysis, and machine learning models: An exploratory study. Heliyon 10(17): e36606.
- Gaagai A, Aouissi HA, Bencedira S, Hinge G, Athamena A, et al. (2023) Application of water quality indices, machine learning approaches, and GIS to identify groundwater quality for irrigation purposes: A case study of Sahara Aquifer, Doucen Plain, Algeria. Water 15(2): 289.
- Singaraja C (2017) Relevance of water quality index for groundwater quality evaluation: Thoothukudi District, Tamil Nadu, India. Applied water science 7(5): 2157-2173.
- Singh SK, Srivastava PK, Singh D, Han D, Gautam SK, et al. (2015) Modeling groundwater quality over a humid subtropical region using numerical indices, earth observation datasets, and X-ray diffraction technique: A case study of Allahabad district, India. Environmental Geochemistry and Health 37(1): 157-180.
- Gautam SK, Maharana C, Sharma D, Singh AK, Tripathi JK, et al. (2015) Evaluation of groundwater quality in the Chotanagpur Plateau region of the Subarnarekha River Basin, Jharkhand State, India. Sustain Water Qual Ecol 6: 57-74.
- APHA (1998) Standard methods for the examination of water and wastewater, 20th American Public Health Association, Washington.
- Ayers RS, Westcot DW (1985) Water quality for agriculture (Rev.1) FAO Irrigation and Drainage Paper 29. Food and Agriculture Organization of the United Nations.
- Richards LA (Ed.) (1954) Diagnosis and improvement of saline and alkali soils (Agriculture Handbook No. 60) U.S. Department of Agriculture.
- Wallender WW, Tanji KK (2012) Agricultural Salinity Assessment and Management. American Society of Civil Engineers (ASCE).
- Doneen LD (1964) Notes on water quality in agriculture (Water Science and Engineering Paper No. 4001). Department of Water Science and Engineering, University of California.

























