




 ARR Home



Abstract
This paper focuses on the issue how to obtain the precise mixing matrix that is an essential procedure in the framework of blind source separation technology. The sparsity of the signal is an important property that can result into the mixing matrix. To enhance the signal sparsity, we propose a novel method that can detect the single source points effectively. Differ from the previous studies need to deal with the two-dimensional time-frequency data, our proposed method only utilizes the time-series data, that is more efficiency. Compared with the original data, the data processed by our method shows obvious clustering features, that can be used to estimate more precise mixing matrix.
Keywords:BSS: Blind Source Separation; TF: Time-Frequency; HT: Hilbert Transform
Introduction
In practical engineering, signals recorded by sensors, such as vibration, sound, and pressure, are typically superpositions of contributions from multiple components or devices and are transmitted through unknown propagation paths [1,2]. In many cases, neither the source waveforms nor the propagation characteristics are available a priori. Separating individual excitation sources from the measured mixtures and estimating the corresponding system transfer characteristics are therefore fundamental for source localization and equipment condition monitoring [3]. This class of problems is commonly formulated within the blind source separation (BSS) framework in signal processing and applied mathematics [4–7]. For an instantaneous mixing model, it is mathematically expressed as:

Where  are the mixed observations
recorded by sensors, A is the mixing matrix of order m× n with
aij as the (i, j) element and
are the mixed observations
recorded by sensors, A is the mixing matrix of order m× n with
aij as the (i, j) element and  are the original
sources. The BSS technology is designed to first estimate the
mixing matrix and then separate the sources only relying on the
observations. In which, how to obtain the precise mixing matrix is the
most essential procedure that is related to whether the BSS can be
applied successfully or not.
are the original
sources. The BSS technology is designed to first estimate the
mixing matrix and then separate the sources only relying on the
observations. In which, how to obtain the precise mixing matrix is the
most essential procedure that is related to whether the BSS can be
applied successfully or not.
In recent studies, the sparsity of the signal has become an important property that is often utilized to estimate the mixing matrix [8,9]. For the sparsity-well signals, the plotted scatter of the observations can show clustering features that are corresponding to the column vectors of the mixing matrix. It is obvious that much sparser scatter can result into the more precise estimation. Some recent studies focus on how to detect the single source point to enhance the sparsity of the signal [10-12]. However, these methods need to transform the one-dimensional time-series data into timefrequency (TF) domain [13], then propose their own methods based on the two-dimensional TF data to achieve the much sparser scatter. It is known that two-dimensional spatiotemporal representations significantly exceed one-dimensional timedomain data in both the number of sampling points and feature dimensions, with data scale growing synchronously with both temporal duration and analytical dimensions. This results in substantially increased computational complexity, particularly under sliding window processing or high-resolution settings, where substantial computational burdens can easily arise. In this paper, we explore a single source point detection method that can use the time-series data directly, that is more efficiency than the methods need to deal with the data in TF domain.
Fundamentals
To characterize the influence of different source activity states on the hybrid structure within the observed signal, it is necessary to distinguish the source occupancy status of sampling points in the temporal dimension. Based on the active state of source signals in the instantaneous hybrid model, sampling points in the observed data can be categorized into distinct types to facilitate further analysis of their geometric distribution characteristics.
The single source point is defined as the point that only one source is active. Otherwise, the point is defined as the multiple source point. For simplify, we consider a simple model that consists of two sources mixing into two observations by a rank-full matrix,

Assuming that in the time t1 only source  , such that we can have

In the same theory, in the time t2 only source  , such that we can have

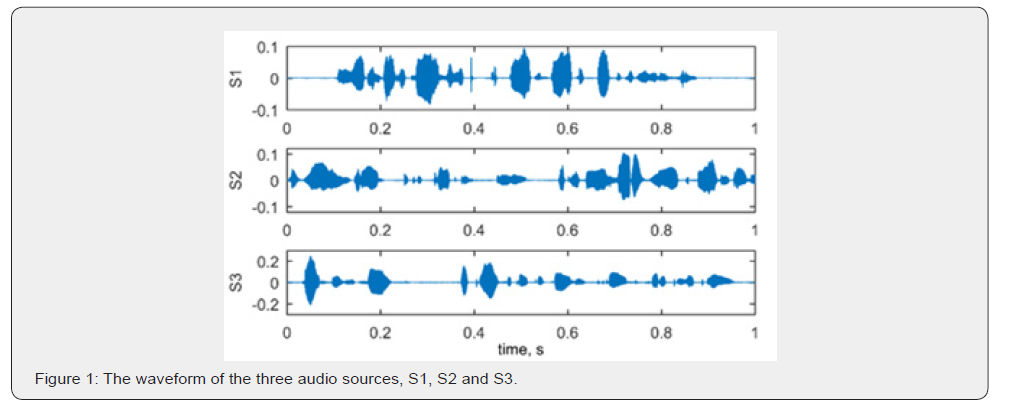
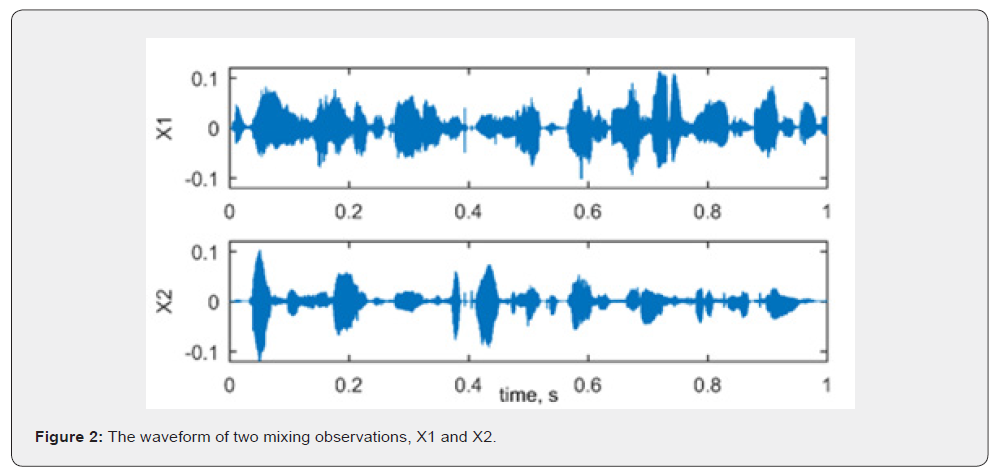
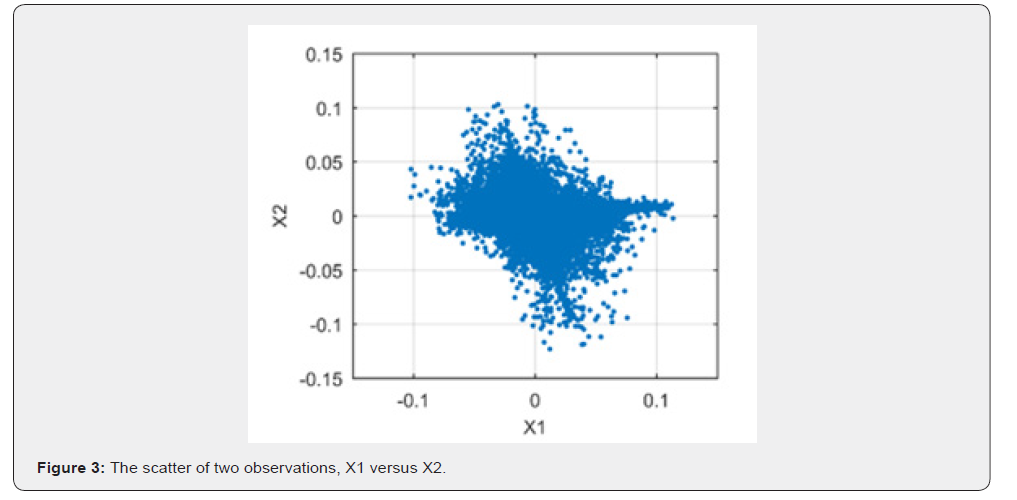
According to (3) and (4), if we plot the two observations in two-dimensional axis, the scatter of the observations occupied by the single source will cluster into the straight lines that can result into the column vectors of the mixing matrix one by one. However, as the number of sound sources increases, simultaneous activity from multiple sources becomes more common, while single-source events grow relatively rare. Observed scatter points are increasingly formed by the superposition of multiple sources, no longer concentrated along a single direction but instead exhibiting a dispersed, interwoven distribution. Under the influence of factors such as noise and propagation coupling, the original linear structure tends to weaken, resulting in unclear clustering features that make it difficult to reliably extract directional information corresponding to the mixing matrix. In Figure 3, we plot the scatter of two observations (see Figure 2) being mixed with three audio sources (see Figure 1). It can be observed that due to the frequent overlapping activities of multiple sound sources along the time axis, the observed scatter points are primarily composed of multi-source superposition components. Their distribution in the planar space exhibits distinct characteristics of randomness and dispersion, failing to form clear linear clustering structures along fixed directions. Under these circumstances, the geometric distribution of the scatter points struggles to reflect the directional information corresponding to each source during the mixing process. This makes it challenging to directly extract effective features related to the mixing matrix from the raw observed scatter points (Figure 1-3).
To detect the single source points and remove the multiple source points, we first apply the Hilbert transform (HT) [14] to the observations of expression (2). It is known that the HT possesses strictly linear properties, preserving the same weighting relationships when applied to weighted signal superpositions, such that we can have

where H [⋅] denotes the HT operator. According to the same theory with expressions (3) and (4), for the points with only one source occupying, we can have


According to (3), (4), (5) and (6), we can deduce the following expressions

The expressions (8) and (9) denotes that, for the single source points t1 and t2 , the direction of the observation vector is equal to the direction of the HT of the observation vector. Therefore, inspired by these two expressions, a hypothesis is proposed that the single source points can be detected, if the condition (10) is satisfied.

To verify this hypothesis, we build the following expression (11) and assume that in the time t , both of source S1 (t ) and source S2(t ) are active simultaneously, i.e.  .
.

where  , since the mixing matrix has been assumed to be rank-full. The only chance that makes the expression
(11) being equal to zero is that the condition (12) needs to be satisfied.
, since the mixing matrix has been assumed to be rank-full. The only chance that makes the expression
(11) being equal to zero is that the condition (12) needs to be satisfied.

It is known that the HT is to provide the imaginary part of the analytic representation for a real signal [15]. The phase of the analytic signal can be calculated by the ratio of the real part with respect to the imaginary part. Therefore, it can be concluded that, the condition (10) can detect all single source points and remove most multiple source points except for the sources with the same phase.
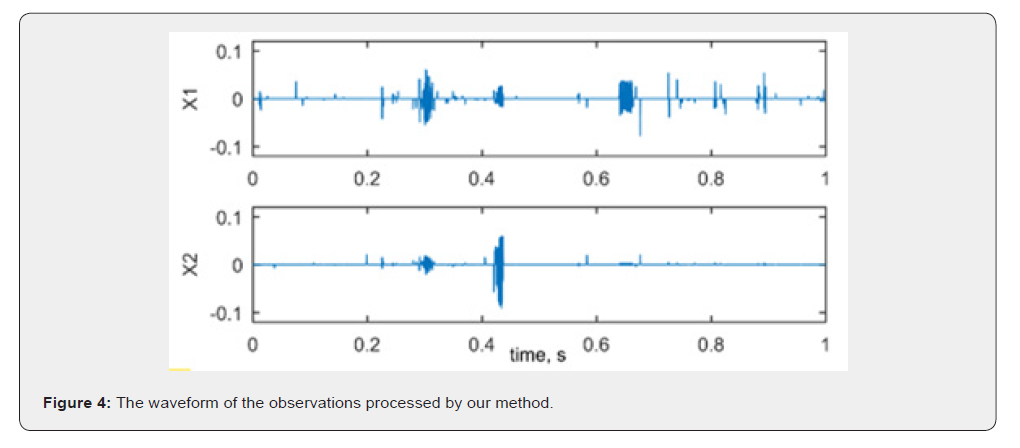
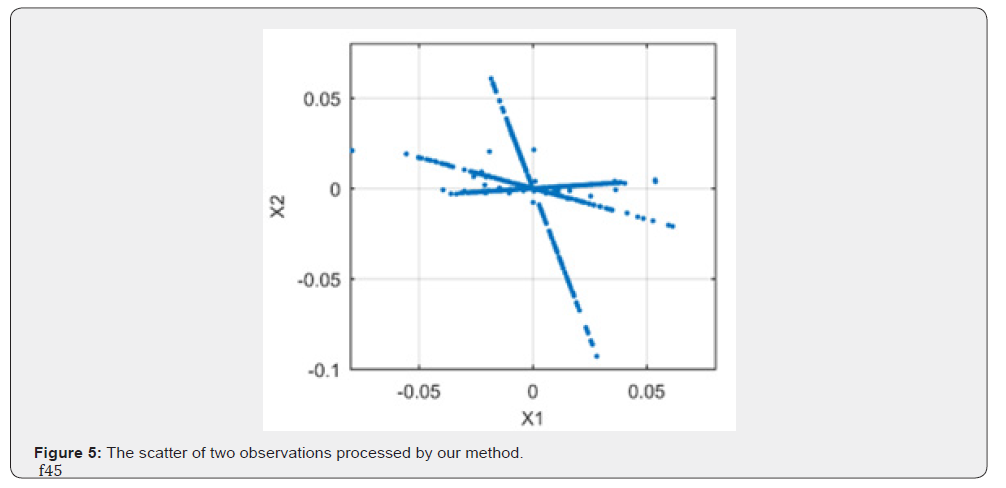
Under actual operating conditions, the initial phase of the source signal, propagation delay, and channel phase response are often uncontrollable and subject to fluctuations due to environmental and operational states. Consequently, phase characteristics typically exhibit randomness and uncertainty. As a result, the probability of multiple sources simultaneously satisfying phase consistency at the same instant is low, making scenarios involving multiple active sources with identical phases relatively uncommon. After being filtered by condition (10), it is enough to provide a more obvious clustering scatter than the original scatter. In Figure 4, the time-series data processed by the proposed method is displayed, that is much sparser than the original data. In Figure 5, the scatter reflects three obvious clustering straight lines, that are corresponding to the three column vectors of the mixing matrix. Compared to the original scattering, the processed scattering distribution is sparser and structurally clearer, with more pronounced linear clustering features, thereby facilitating more stable estimation of the subsequent mixing matrix.
For more general mixing model (1), the single source points can be detected, if the condition (13) is satisfied,

where the ∠(⋅) is to calculate the angle of two vectors and is a small value to control the calculation accuracy (Figure 4 & Figure 5). f5
This single-source discrimination criterion originates from the directional relationship between the observed vector and its HT under the instantaneous mixture model, grounded in the linear properties of the Hilbert transform. The discrimination process does not rely on signal amplitude distribution or time-frequency representations, instead utilizing only the geometric consistency of observation data in vector space for filtering. By retaining sampling points that satisfy the discrimination criteria, the distribution structure of observation data in scatter plot space is reconstructed, yielding a clearer correspondence between its directional characteristics and the column vectors of the mixing matrix.
Conclusion
We are intended to propose a novel method that can benefit to the mixing matrix estimation in the framework of blind source separation. To improve the sparsity of the signal and enhance the clustering features of the scatter, we explore the relationship of the original time-series data and its HT, then propose a procedure that can detect the single source points using the time-series data. Compared with the original scatter, the scatter processed by our proposed method can reveal much sparser clustering features and be more suitable for estimating the mixing matrix.
References
- Yang Y, Xie R, Li M, Cheng W (2024) A review on the application of blind source separation in vibration analysis of mechanical systems. Measurement 227: 114241.
- Yang Y, Xie R, Li M, Cheng W (2025) Equivalent reconstruction of local distributed dynamic load based on block sparse Bayesian learning. Measurement 241: 115665.
- Pu H (2021) Towards robust multiple blind source localization using source separation and beamforming. Sensors 21(2): 532.
- Ma B, Zhang T (2020) Single-channel blind source separation for vibration signals based on TVF-EMD and improved SCA. IET Signal Process 14(4): 259–268.
- Li Y (2023) Statistically Dependent Blind Signal Separation Under Relaxed Sparsity. in IEEE Signal Processing Letters 30: 598-602.
- Zhu Z (2023) Underdetermined blind source separation method based on a two-stage single-source point screening. Electronics 12(10): 2185.
- Hassan N, Ramli DA (2023) Sparse component analysis (SCA) based on adaptive time-frequency thresholding for underdetermined blind source separation (UBSS). Sensors 23(4): 2060.
- Nguyen AHT (2020) Directional sparse filtering for blind estimation of under-determined complex-valued mixing matrices. IEEE Trans. Signal Process 68: 1990–2003.
- Ma B, Zhang T, An Z, Song T, Zhao H (2021) A blind source separation method for time-delayed mixtures in underdetermined case and its application in modal identification. Digital Signal Process 112: 103007.
- Cholnam O (2018) Blind signal separation method and relationship between source separation and source localisation in the TF plane. IET Signal Process 12(9): 1115–1122.
- Jin H (2022) Underdetermined blind source separation of radar signals based on genetic annealing algorithm. J Eng 2022: 261–273.
- Bai P, Yang Y, Xue F, Yang R, Shu Q (2022) Underdetermined mixing matrix estimation based on time-frequency single source points detection and eigenvalue decomposition. SIViP 16(3): 1061–1069.
- Yu G, Yu M, Xu C (2017) Synchroextracting transform. IEEE Trans. Ind. Electron 64(10): 8042–8054.
- Yang K, Yu K, Li Q (2013) Modal parameter extraction based on Hilbert transform and complex independent component analysis with reference. Mech. Syst. Signal Process 40(1): 257–268.
- Zabin M, Choi HJ, Uddin J (2023) Hybrid deep transfer learning architecture for industrial fault diagnosis using Hilbert transform and DCNN–LSTM. J Supercomput 79(4): 5181–5200.

























