


Assessment of Lipid Profile in Sickle Cell Subjects of Different ABO Blood Groups
Airhomwanbor KO1, Omolumen LE1, Ebaluegbeifoh LO2, Usiobeigbe OS1, Omisakin IA3, Akomolafe BK4,5,6, Abayomi SA7, Obohwemu KO8, Ugege C9, Oikerhe EG10, Oboh MM10 and Aigberaodion OA1
1Department of Chemical Pathology, Faculty of Medical Laboratory Science, Ambrose Alli University, Ekpoma, Edo State, Nigeria
2Center of Excellence and Reproductive Health in Innovation, University of Benin, Benin City, Edo State, Nigeria
3Department of Medical Laboratory Science, Faculty of Basic Medical Sciences, McPherson University, Ogun State, Nigeria
4Department of Medical Laboratory Sciences, Ajayi Crowther University, Oyo town, Oyo State, Nigeria
5Department of Medical Laboratory Services, Oyo State Primary Healthcare Board, Ibadan, Oyo State, Nigeria
6Department of Biological Sciences, Lead City University, Ibadan, Oyo State, Nigeria
7Maitama District Hospital, Federal Capital Territory (FCT), Abuja, Nigeria
8Department of Health, Wellbeing & Social Care, Global Banking School, London, United Kingdom
9Department of Medical Laboratory Science, Edo University, Uzairue, Edo State, Nigeria
10Department of Haematology and Blood Transfusion Science, Faculty of Medical Laboratory Science, Ambrose Alli University, Ekpoma, Edo State, Nigeria
Submission: June 01, 2024; Published: June 10, 2024
*Corresponding author: Iyevhobu Kenneth Oshiokhayamhe, CEPI/ISTH Lassa Fever Epidemiology Study, Irrua Specialist teaching Hospital (ISTH), Irrua, Edo State, Nigeria
How to cite this article: Airhomwanbor KO, Omolumen LE, Ebaluegbeifoh LO, Usiobeigbe OS, Omisakin IA, et al. Assessment of Lipid Profile in Sickle Cell Subjects of Different ABO Blood Groups. Ann Rev Resear. 2024; 11(2): 555809. DOI: 10.19080/ARR.2024.11.555809
Abstract
Sickle cell disease is a disease of red blood cell that is passed from a parent to a child. This study was carried out to determine the lipid profile of sickle cell patients of different ABO blood group in Benin City, Edo State. A total of 60 samples were used in this study comprising blood group A (11), B (12), AB (3) and O (34) respectively. Lipid profile estimation was done using standard laboratory procedure. ABO blood grouping was carried out by standard tile technique. The results were presented using tables as mean ± standard deviation. Statistical analysis was done using one-way analysis of variance (ANOVA) and the student’s t-test. Significant difference was accepted at p<0.05. The results obtained were as follows; T.CHOL in blood group A (204.00±24.59 mg/dl), B (199.00±9.49), AB (194.66±38.68) and O (174.88±18.58); TG in blood group A (143.72±30.00), B (134.00±22.55), AB (106.00±17.32) and O (133.18±17.59); HDL in blood group A (52.91±6.49), B (48.50±3.97), AB (42.67±4.62) and O (46.53±6.44); and LDL in blood group A (122.18±20.45), B (124.08±11.26), AB (132.33±33.65) and O (101.59±15.55) respectively. The study concludes that total cholesterol was highest in sickle cell patients with blood group A and least in patients with blood group O, TG and HDL were highest in blood group A and least in blood group AB, while LDL was highest in blood group AB and least in O. There was significant difference (p<0.05) in lipid profile of subjects with different ABO blood groups. LDL was significantly higher (p<0.05) in male subjects compared with female subjects, however, there was no significant difference (p>0.05) in the T-CHOL, TG and HDL in male subjects compared with female subjects and with respect to age.
Keywords: Lipid Profile; Sickle Cell; ABO; Blood Groups; TG; HDL; LDL
Abbreviations: ANOVA: Analysis of Variance; SCD: Sickle Cell Disease; HbS: hemoglobin S; SCA: Sickle Cell Anemia; RBCs: Red Blood Cells; VOC: Vaso-Occlusive Crisis; ACS: Acute Chest Syndrome; OTN: Osteonecrosis; TG: Triglycerides; TC: Total Cholesterol; HDL: High Density Lipoprotein; LDL: Low-Density Lipoprotein; LDL-C: Low Density Lipoprotein-Cholesterol; HDL-C: High Density Lipoprotein-Cholesterol; apo A: apolipoprotein A; apo B: apolipoprotein B; VLDL: Very Low-Density Lipoprotein
Introduction
Sickle cell disease (SCD) is a monogenetic disorder resulting from a point mutation in the β-globin gene leading to the synthesis of abnormal hemoglobin S (HbS) [1]. Sickle cell anemia (SCA), i.e. the homozygous state of the βS allele, is the most frequently encountered genotype worldwide, far beyond sickle cell SC disease, i.e. the heterozygous composite state of the βS and βC alleles (SCC). The sickling of red blood cells (RBCs), due to polymerization of HbS when deoxygenated, is the main pathophysiological mechanism at the origin of several vaso-occlusive-like events resulting from the entrapment of poorly deformable and fragile sickle red blood cells in small vessels [1].
SCD is characterized by chronic hemolysis, inflammation, exacerbated oxidative stress, frequent vaso-occlusive complications, multiple organ damage and reduced patient survival [1]. There are large variations in the nature and incidence of complications affecting SCA and SCC patients, and the clinical severity of SCC is often considered to be milder than that of SCA [2]. By contrast, it has been recently shown that SCC patients may also frequently experience similar vaso-occlusive-like events than SCA patients, i.e. vaso-occlusive crisis (VOC), acute chest syndrome (ACS) and osteonecrosis (OTN) and may also develop more frequently specific complications such as retinopathy and otologic disorders [3,4]. The exact pathophysiological mechanisms, which lie at the origin of the heterogeneous clinical severity in SCC and SCA patients, have yet to be fully elucidated.
Blood groups are groups of antigens that are located on the red cell membranes and are coded by alleles at different loci on a chromosome [5]. Although, about 400 blood grouping antigens have been reported, ABO and Rhesus which were the 1st and 4th to be discovered respectively, are the most important [6]. The ABO system derives its importance from the fact that A and B are strongly antigenic and anti-A and anti-B occur naturally in the serum of persons lacking the corresponding antigen, these antibodies being capable of producing hemolysis in vivo. Individuals are divided into four major blood groups: A, B, AB and O, depending on the antigens present on RBC [7]. An individual of type A blood group raises anti-B antibodies against B-blood group RBCs if transfused with blood from B group, with resultant lysis of the RBCs. This is due to the presence of isoantibodies against non-self-blood group antigen. The same happens for B and O blood groups. AB does not have an anti-A and anti-B isoantibodies because A and B antigens are present on the RBC and are both self-antigens [8].
A lipid profile is a measurement of various lipids that are found in the blood. Lipids (sterols, phospholipids and triacylglycerol’s or triglycerides) are oils (hydrophobic) they are transported in plasma in protein wrapped vehicles called lipoproteins. This kind of blood test is often used to assess risk of heart disease. A lipid profile contains information about several different kinds of lipid that normally circulate in the blood. Lipids generally included in a blood lipid profile are Triglycerides (TG), Total Cholesterol (TC), High Density Lipoprotein (HDL), and Low-Density Lipoprotein (LDL) [9].
Triglyceride is the most common type of lipid formed in animals. Fat tissue is primarily for the storage of this form of lipid. Triglyceride levels vary quite a bit over short time period. Cholesterol is a component of cell membranes, and is a building block of bile, estrogen and testosterone. The cholesterol necessary for normal metabolism is manufactured by the liver [10]. Cholesterol is a component of cell membranes, and is a building block of bile, estrogen and testosterone. Cholesterol is a lipid and is insoluble in water. It is transported through the blood encased in a soluble protein [11]. Low Density Lipoprotein (LDL) Cholesterol is sometimes referred to as the “bad cholesterol”. This form contains the highest amount of cholesterol. High Density Lipoprotein (HDL) Cholesterol is sometimes called “good cholesterol.” HDL cholesterol is cholesterol that is packaged for delivery to the liver, where the cholesterol is removed from the body [9]. After the discovery of ABO blood groups [12], several studies have reported that the occurrence of some diseases can be correlated with blood group types e.g. carcinoma of stomach [13], cardiometabolic diseases [14], peptic ulcer [15], and upper urinary tract cancer [16]. Several reports have also suggested an association of the ABO blood groups with the risk of developing severe manifestation of atherosclerosis [17].
Lipids have been very recently hypothesized to play a role in the pathophysiological mechanisms of Sickle Cell Anaemia (SCA). SCA patients have unique plasma lipid profile characterized both in adults and children, by decreased levels of total cholesterol (TC), high density lipoprotein-cholesterol (HDL-C), low density lipoprotein-cholesterol (LDL-C), apolipoprotein A (apoA), and apolipoprotein B (apoB), compared to controls or to the general population [18-21]. Contrasting results have been reported regarding the level of triglycerides (TG) in SCA compared to controls [22]. This dyslipidemia has been associated with the severity of haemolysis and would be involved in vascular dysfunction [20,23,24]. In addition, it has been also shown that patients with the highest TG levels would be prone to develop complications like pulmonary hypertension [20,23,24] and acute chest syndrome [25]. Despite the numerous studies carried out on the lipid profile of sickle cell patients, only few studies have correlated such findings in relation to ABO blood group. Hence, this study was carried to evaluate the lipid profile sickle cell patients of various ABO blood groups in Benin City, Edo State.
Materials and Methods
This study was carried out in Benin City, Edo State. Benin City is the capital of Edo state in southern Nigeria. It is situated approximately 40 km north of the Benin River and 320km by road east of Lagos. The area proper lies between latitude 60 20 North of Equator and longitudes 50 37 and 50 20’ East of the Greenwich Meridian. Benin City has a total area of 1,204 km2 and a population of 1,495,800. Majority of people in this area are civil servants, traders, business men and women, transporters, farmers, teachers/lecturers and students by occupation. Benin City is the home to Nigeria’s institutions of higher learning such as University of Benin.
Ethical Approval and Informed Consent
Ethical approval for the collection of samples was obtained from the Ethics and Review Committee, Ambrose Alli University, Ekpoma, Edo State. Informed consent was also obtained from each subject who participated in the study before the collection of blood sample.
Study Population
The population of this study comprised of fifty (50) sickle cell patients with different ABO blood group (A, B, AB and O) in Benin City, Edo State, Nigeria.
Sickle Cell patients of various ABO blood groups in Benin City, Edo State who gave their consent were included in this study. Individuals with normal haemoglobin genotype (Hb AA), those with sickle cell traits (Hb AS and Hb AC) and sickle cell patients who did not give their consent were excluded from the study.
Sample Size
The sample size shall be calculated using the Cochrane formula for sample size determination:

n = minimum sample size
z = standard normal deviation (1.96)
p = 3% = 0.03 [26]
q = 1 – p = 0.97
d = degree of precision at the confidence level of 95% = 0.05
Substituting into the formula above
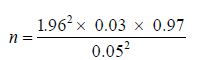
n = 44.72 ≈ 45
To make up for the sampling error, sixty (60) samples were collected and used for this research.
Sample Collection
Five milli liters (5.0 mls) of blood sample was collected from fasting subjects via venipuncture and divided into two parts. One part was dispensed into a plain container without any additive for the determination of serum lipid profile. The sample was allowed to stand for one hour to clot. It was then centrifuged at 3000 g for 10 min in order to separate blood cells and suspended particles from serum. The serum was aliquoted and stored at 4 °C until required for analysis. The whole blood sample was dispensed into EDTA containers used for hemoglobin genotype and ABO blood group determination.
Sample Analysis
Determination of Total Cholesterol: Enzymatic Endpoint Method (CHOD-PAP).
Principle: Cholesterol esterase hydrolyses esterified cholesterol to free cholesterol. The free cholesterol is oxidized in the presence of cholesterol oxidase to form hydrogen peroxide which further reacts with phenol and 4-aminoantipyrine by the catalytic action of peroxidase to form a red quinoneimine dye complex. The intensity of color formed is proportional to the amount of cholesterol present in the sample.
Procedure: Ten microlitres of distilled water, standard and samples were dispensed into tubes labelled blank, standard and sample respectively. One millilitre of cholesterol reagent was added into the respective test tubes, and the contents were mixed and incubated at 37oC for five minutes. The absorbance of standard and samples were measured against blank at a wavelength of 500nm using spectrophotometer.
Determination of Triglycerides: Colorimetric Method
Principle: Lipoprotein lipase hydrolyses triglycerides to glycerol and free fatty acids. The glycerol formed with ATP in the presence of glycerol kinase forms glycerol-3-phosphate which is oxidized by the enzyme glycerol oxidase to form hydrogen peroxide. The hydrogen peroxide further reacts with phenolic compound and 4-aminoantipyrine by the catalytic action of peroxidase to form a red colored quinoneime dye complex. Intensity of the color formed is directly proportional to the number of triglycerides present in the sample.
Procedure: Ten micro liters of distilled water, standard and samples were dispensed into tubes labelled blank, standard and sample respectively. One milli liter of triglyceride reagent was added into the respective test tubes, and the contents were mixed and incubated at 37oC for five minutes. The absorbance of standard and samples were measured against blank at a wavelength of 500nm using spectrophotometer.
Estimation of high-density lipoprotein: Precipitation method
Principle: Low density lipoprotein (LDL), very low-density lipoprotein (VLDL) and chylomicrons of cholesterol are precipitated quantitatively by the addition of phosphotungstic acid in the presence of magnesium ions. After centrifugation, the cholesterol in the HDL fraction, which remains in the supernatant was the determined using the same method for the cholesterol assay.
Procedure
i. Stage I: Two hundred micro liters of standard/sample was dispensed into test tube labelled standard/sample. Five hundred micro liters of precipitant was added into the test tubes and mixed well, the contents were allowed to stand for ten minutes at room temperature and then centrifuged for ten minutes at 4000rpm. The supernatant was separated and the cholesterol content was estimated using CHOD-PAP method.
ii. Stage II: One hundred micro liters of distilled water, standard supernatant and sample supernatant was added into test tubes labelled blank, standard and sample respectively. One millilitre of cholesterol reagent was added into the respective test tubes; the contents were mixed and incubated at 37°C for five minutes in the water bath. The absorbance of standard and sample were measured against blank at the wavelength of 500nm using spectrophotometer.
Estimation of low-density lipoprotein: Friedewald formular
LDL-cholesterol (mmol/l) = Total cholesterol - (TG/2.2 - HDL-cholesterol)
ABO Blood Grouping [27]
Principle: ABO blood group testing depends upon testing the red cells with known anti-A and anti-B sera, the presence or absence of agglutination indicates the group of each sample. Thus, if agglutination occurs with neither serum, red cell contains neither A or B agglutinogen and blood group is O. Agglutination with only ant-A indicates A agglutinogen on red cell. Agglutination with only anti-B indicates B agglutinogen on red cell. Agglutination with anti-A and anti-B indicates A and B agglutinogen on red cell.
Procedure (Tile Method): A drop of the anti-sera (A, B, AB and D) was placed on the white tile. A drop of blood was placed beside the anti-sera on the tile. It was mixed and rocked gently for 5 minutes. The control (known red cells) was treated same way as the test samples. It was then observed macroscopically for agglutination and result recorded.
Interpretation of Result
i. Blood group A: Agglutination with only Anti-A.
ii. Blood group B: Agglutination with only Anti-B.
iii. Blood group AB: Agglutination with both Anti-A and Ant-B.
iv. Blood group O: Agglutination with neither Anti-A nor Anti-B.
Haemoglobin Genotype Determination [28]
Principle: Different types of haemoglobin (Hb) have different migration rate because haemoglobins are proteins. They can be made to run to either anode or cathode depending on the charge carried by the haemoglobin. The buffer used determines the charge carried by the Haemoglobin (Hb). Here alkaline cellulose acetate is used in an alkaline buffer at pH 8.4, this tends to make the haemoglobin to migrate to the anode where there is negative charge.
Procedure (Haemoglobin Electrophoresis)
i. Step 1: Preparation of Haemolysate: The anticoagulated blood was centrifuged at 2500rpm for five minutes. The supernatant plasma was discarded and packed cell was washed with large volume of saline three times. After the final washing the red cell was lysed by one quarter (1/4) volume of toluene and one drop of 3% potassium cyanide. It was mixed properly.
ii. Step 2: Electrophoresis: The buffer was poured into the electrophoresis chamber. Two wicks were soaked in the buffer and positioned such that they made contact with the buffer. The cellulose acetate paper was re-soaked in the buffer and left to soak for 20minutes. Excess buffer was removed by keeping the plate between absorbent papers. Using an applicator stick 0.5ml of the haemolysate samples test and control was applied approximately 3cm away from the cathode. The cellulose acetate membrane plate was immediately placed in the electrophoretic chamber (tank). The chamber was connected to the power supply and the plate was electrophoresed for 20 minutes at approximately 350. After 20 minutes, the power supply was disconnected and the result was read.
Interpretation of Results: Following migration to the anode, haemoglobin genotype AA produces one band and travels faster than other haemoglobin genotypes. Haemoglobin AS and AC produces two bands but the Hb AS travels faster than Hb SC.
Data Analysis
The results were presented using tables. Data was presented as mean ± S.D (standard deviation). Comparison was made between subjects and control groups using one-way analysis of variance (ANOVA) and the student’s t-test. Significant difference was accepted at p<0.05.
Result
Lipid Profile of Sickle Cell Patients with Different ABO Blood Groups
Table 1 showed the Lipid profile of sickle cell patients with different ABO blood groups. The results obtained showed that T-CHOL in sickle cell patients with blood group A was 204.00±24.59 mg/dl, blood group B was 199.00±9.49 mg/dl, blood group AB was 194.66±38.68 mg/dl and blood group O was 174.88±18.58 mg/dl respectively. Similarly, the TG of the subjects with blood group A was 143.72±30.00 mg/dl, blood group B was 134.00±22.55 mg/dl, blood group AB was 106.00±17.32 mg/dl and blood group O was 133.18±17.59 mg/dl respectively. The HDL of the subjects with blood group A was 52.91±6.49 mg/dl, blood group B was 48.50±3.97 mg/dl, blood group AB was 42.67±4.62 mg/dl and blood group O was 46.53±6.44 mg/dl respectively. Finally, the LDL of the subjects with blood group A was 122.18±20.45 mg/dl, blood group B was 124.08±11.26 mg/dl, blood group AB was 132.33±33.65 mg/dl and blood group O was 101.59±15.55 mg/dl respectively. There was significant difference (p<0.05) in lipid profile of subjects with different ABO blood groups.
Post-Hoc Test for table 1 Showing ANOVA Statistics for Lipid Profile of Sickle Cell Patients of Different ABO Blood Groups
The Post-Hoc analysis in table 2 showed that there was significant difference (p<0.05) in the T-CHOL in subjects with blood group A vs O, and AB vs O. There was no significant difference (p>0.05) in blood group A vs B, A vs AB and AB vs B respectively. Furthermore, there was significant difference (p<0.05) in TG of subjects with blood group A vs AB, B vs AB and O vs AB respectively. There was no significant difference (p>0.05) in HDL of subjects with blood group B vs AB, B vs O, and AB vs O, but there was significant difference in A vs B, A vs AB and A vs O respectively. Finally, there was significant difference (p>0.05) in LDL of subjects with blood group A vs O and AB vs O, but there was no significant difference (p>0.05) in blood group A vs B, A vs AB, B vs AB, and B vs O respectively.

*Values in a row with different superscript are significant at p<0.05.
Keys: T-CHOL = Total cholesterol; TG = Triglycerides; HDL = High density lipoprotein; LDL = Low density lipoprotein; N = Sample size

Keys: T-CHOL = Total cholesterol; TG = Triglycerides; HDL = High density lipoprotein; LDL = Low density lipoprotein; N = Sample size; ‘S’ = The mean difference is significant at the 0.05 level; ‘NS’ = mean difference is insignificant; A = Blood Group A, B = Blood group B, AB = Blood Group AB; O = Blood Group O
Lipid Profile of Sickle Cell Patients with Different ABO Blood Groups in Relation to Age
Table 3 showed the Lipid profile of sickle cell subjects with different ABO blood groups in relation to age. The results obtained showed that there was no significant difference (p>0.05) in T-CHOL, TG and LDL of the subjects with respect to age, but there was significant difference (p<0.05) in HDL of the subjects with respect to age. The T-CHOL of the subjects in age group 5-15 years was 181.00±22.32 mg/dl, age group 16-30 years was 195.26±21.92 mg/dl and age group 31-45 years was 176.67±23.07 mg/dl respectively. Similarly, the TG of the subjects in age group 5-15 years was 129.90±18.79 mg/dl, age group 16-30 years was 138.61±24.76 mg/dl and age group 31-45 years was 136.67±27.16 mg/dl respectively. The HDL of the subjects in age group 5-15 years was 46.74±5.91 mg/dl, age group 16-30 years was 50.39±6.27 mg/dl and age group 31-45 years was 44.33±7.20 mg/dl respectively. Finally, the LDL of the subjects in age group 5-15 years was 107.55±21.02 mg/dl, age group 16-30 years was 117.43±19.88 mg/dl and age group 31-45 years was 107.67±7.87 mg/dl respectively.

*Values in a row with different superscript are significant at p<0.05.
Lipid Profile of Sickle Cell Patients with Difference ABO Blood Groups in Relation to Gender
Table 4 showed the lipid profile of sickle cell patients of different ABO blood groups in relation to gender. The results obtained showed LDL was significantly higher (p<0.05) in male subjects (106.27±19.51 mg/dl) compared with female subjects (116.89±20.05 mg/dl), however, there was no significant difference (p>0.05) in the T-CHOL, TG and HDL in male subjects compared with female subjects. The T-CHOL of male and female subjects was 181.89±21.68 mg/dl and 189.62±23.57 mg/dl, TG was 133.34±21.19 mg/dl and 133.62±23.83 mg/dl, while HDL was 48.68±7.19 mg/dl and 47.72±5.03 mg/ml respectively.

*Values are significant at p<0.05.
Relationship Between Lipid Profile of Sickle Cell Subjects with Different ABO Blood Group using Pearson Correlation
Table 5 showed the relationship between Lipid profile of sickle cell subjects with different ABO blood group using Pearson correlation. The results obtained showed that T-CHOL had a significant positive correlation with TG, HDL and LDL (p=0.000) respectively. TG had a significant positive correlation with T-CHOL (p=0.000) and HDL (p=0.04) respectively. HDL had positive non- significant correlation with LDL (p=0.299), while LDL had positive non- significant correlation with TG (p=0.138).

**Correlation is significant at the 0.01 level (2-tailed).
Discussion
Sickle cell disease is disease of red blood cell that is passed from a parent to a child. Individuals with sickle cell disease have red blood cells with haemoglobin which is different from normal haemoglobin [29]. When a red blood cell containing sickle haemoglobin gives up its oxygen to the tissues it changes from its usual doughnut shape to sickle shape and becomes stiff rather than soft and flexible like normal red blood cells. The abnormal viscoelastic properties of oxygenated sickle cell erythrocytes and formation of irreversibly sickled erythrocytes are related to abnormal properties of their membrane which affect the plasma lipid profile [30]. This study was carried out to determine the lipid profile of sickle cell patients of different ABO blood group in Benin City, Edo State.
In this study, it was observed that serum total cholesterol in sickle cell disease was significantly decreased when compared with the Hb AA control used in other studies. In relation to blood group, the total cholesterol was significantly higher in blood group A (204 mg/dl) compared with blood group O (174.88 mg/dl). This is consistent with the work of Ugonabo et al. (2007) in which plasma cholesterol was lower in sickle cell anaemia. Hashmi and Nishat (2012) have earlier observed low cholesterol in sickle cell anaemia. The decrease in plasma cholesterol could be that the “sickled cell” gets stuck in the tiny blood vessels blocking the flow of blood and causing pain. This condition probably could reduce the circulating cholesterol and hence low cholesterol level especially in blood group O subjects.
There are several documented hypotheses explaining the hypocholesterolaemia seen in sickle cell disease. One of such hypothesis suggests that the low cholesterol level is due to utilization of cholesterol during increased erythropoiesis. In their study, Shalev et al. [31] showed that the hypocholesterolaemia seen in sickle cell disease as well as in other haemolytic anaemias was absent in non-haemolytic anaemia. Increase in the exchange rate between plasma cholesterol and red blood cell membrane cholesterol may also be a causative factor in the low cholesterol levels seen in Hb SS patients. It may also be that the hypocholesterolaemia in SCD may be induced by the HbS gene [32,33].
There are varying reports about triglyceride levels in SCD patients. While some researchers have reported elevated triglyceride levels in SCD with higher levels during crises when compared with steady state [34,35], others have reported normal levels (Shores et al., 2003). In our study, the mean serum Triglyceride level of subjects with blood group A (143.72 mg/dl) was significantly higher (p<0.05) compared with blood group O subjects (106 mg/dl). Factors that may contribute to the discrepancies in results from different researchers may include differences in age of the study population, sex and weight. In addition, when compared to other dietary lipids, serum triglyceride level in an individual strongly depends on whether that individual is fasting or not. In a non-fasting individual, triglyceride levels will be strongly affected by the time interval between ingestion of dietary fats, as well as the type and quantity of fats consumed. Various reports have shown an association between lipid levels and disease severity in patients with sickle cell anaemia [20,36].
Our study recorded mean HDL of 52.91 mg/l in subjects with blood group A, followed by blood group B (48.50 mg/dl), blood group O (46.53 mg/dl) and AB (42.67 mg/dl) respectively. Nnodim et al. [30] reported that serum high density lipoprotein cholesterol was depleted in sickle cell disease when compared with the control. However, not all studies have documented low HDL-C levels in SCD and possible reasons for this may include differences in age, diet, sex, weight and sample size between the studies. In their study, Emokpae and Kuliya-Gwarzo [36] found that SCD patients with decreased levels of HDL-C had more severe anaemia than those with normal HDL-C levels and thus concluded that the low HDL-C marker may assist in the prediction of adverse clinical events in these patients [36]. The low HDL-C level seen in sickle cell patients with blood group AB would be expected to predispose them to increase risk of coronary heart disease. HDL cholesterol is inversely related to the risk of developing coronary artery disease. The higher the HDL-C the less chance of developing coronary heart disease. This mean that sickle cell patients with blood group A are less likely to develop coronary artery diseases, while sickle cell subjects with blood group AB are more likely to develop coronary artery disease.
The mean LDL of sickle cell subjects with blood group AB (132.33 mg/dl) was significantly higher when compared with blood group O subjects (101.59 mg/dl), blood group B (124.08 mg/dl), blood group A (122.18 mg/dl) respectively. Akinlade et al. [34] reported that LDL levels decreased progressively from controls, to sickle cell patients in steady state to sickle cell patients in vaso-occlusive crisis. Their study confirmed the widely reported defective lipid homeostasis in adults with sickle cell anaemia. They also showed that the alteration in lipid metabolism was more pronounced amongst patients in VOC compared with those in steady state [34]. The low level of LDL-cholesterol is highly desirable to the body. The low plasma lipid profile observed in blood group O subjects in this study could probably be due to the fact that sickle cells get stuck in the blood vessels and cannot re-circulate through the body so that the number of circulating blood cells reduces and individual becomes anaemic and hence low plasma lipid profile.
In this study, LDL was significantly higher (p<0.05) in male subjects (106.27 mg/dl) compared with female subjects (116.89 mg/dl), however, there was no significant difference (p>0.05) in the Total cholesterol, Triglycerides and HDL in male subjects compared with female subjects in all the blood groups studied. On the other hand, there was no significant difference (p>0.05) in Total cholesterol, Triglycerides and LDL of the subjects with respect to age, except for HDL which showed significant difference (p<0.05). It is possible to speculate that the high levels of phospholipids and cholesterol found in the sickle cell patients might have important physiological roles to play in erythrocyte membrane stabilization, as the red blood cells of sicklers are continuously under stress [37]. On the other hand it is equally possible to implicate the lipids especially cholesterol in many atherogenic cases reported in sicklers, especially stroke [35,38]. A possible explanation is that the high levels of cholesterol may aggravate the viscous nature of the sickle cell blood, and hence severity of crisis and possibly blocking of the arteries, hence vaso-occlusion reported in many patients [38,39]. The variation reported in this work as regards differences in lipid levels in different sexes is not clearly understood, however the levels of circulating lipoproteins may be a plausible explanation [35,40].
Conclusion
The study concludes that total cholesterol was highest in sickle cell patients with blood group A and least in patients with blood group O, TG and HDL were highest in blood group A and least in blood group AB, while LDL was highest in blood group AB and least in O. There was significant difference (p<0.05) in lipid profile of subjects with different ABO blood groups. There was significant positive correlation between total cholesterol with TG, HDL and LDL (p=0.000) respectively. LDL was significantly higher (p<0.05) in male subjects compared with female subjects, however, there was no significant difference (p>0.05) in the T-CHOL, TG and HDL in male subjects compared with female subjects. There was no significant difference (p>0.05) in T-CHOL, TG and LDL of the subjects with respect to age, but there was significant difference (p<0.05) in HDL of the subjects with respect to age.
Because the prevalence of CVD is on the increase in worldwide and in Nigeria, it is our opinion that diagnosis, management and treatment of CVD in Nigeria should take into consideration the blood group status of the subjects. Furthermore, a more elaborate study across Edo State, Nigeria should be conducted to confirm the findings made in this study against the backdrop that variation in demographic characteristics may affect the association of lipoprotein parameters with different blood groups even among sickle cell patients.
References
- Rees DC, Williams TN, Gladwin MT (2010) Sickle-cell disease. Lancet 376(9757): 2018-2031.
- Schnog JB, Duits AJ, Muskiet FAJ, Cate H, Rojer RA, et al. (2004) Sickle cell disease; a general overview. Neth J Med 62(10): 364-374.
- Lionnet F, Hammoudi N, Stojanovic KS, Avellino V, Grateau G, et al. (2012) Haemoglobin sickle cell disease complications: a clinical study of 179 cases. Haematologica 97(8): 1136-1141.
- Lemonne N, Lamarre Y, Romana M, Hardy-Dessources MD, Lionnet F, et al. (2014) Impaired blood rheology plays a role in the chronic disorders associated with sickle cell-hemoglobin C disease. Haematologica 99(5): 74-75.
- Knowles S, Poole G (2002) Human Blood Group Systems. In: Practical Transfusion Medicine (1st), Blackwell Science, London, UK p: 24-31.
- Pramanik T, Pramanik S (2000) Distribution of ABO and Rhesus blood groups in Nepalese medical students: A report. East Mediterranean Health J 6(1): 156-158.
- Conteras M, Lubenko A (2001) Immunohaematology: Introduction. In: Postgraduate Haematology, Hoffbrand AV, Lewis SM and Tuddenham EGD (Eds.) (4th ), Arnold Publishers, London, UK pp: 165-181.
- Akhigbe RE, Ige SF, Afolabi AO, Azeez OM, Adegunlola JM, et al. (2009) Prevalence of Haemoglobin Variants, ABO and Rhesus Blood Groups in Ladoke Akintola University of Technology, Ogbomoso, Nigeria. Trends Med Res 4(2): 24-29.
- Karthikeyan G, Giggs L, Akintal M, Morrison S (2009) Lipid profile, plasma apoli¬poproteins, and risk of a first myocardial infarction among Asians: an analysis from the INTERHEART Study. J Am Coll Cardiol 53(3): 244-253.
- Smith L (2012) Another cholesterol hypothesis: cholesterol as antioxidant. Free Radicals Biol & Med 11(1): 47-61.
- Brunzell J (2008) Lipoprotein management in patients with cardiometabolic risk: consensus statement from the American Diabetes Association and the American College of Cardiology Foundation. Diabetic Care 31(4): 811-822.
- Landsteiner K (1900) Zur kenntnis der antifermentativen, lytischen und agglutinierenden wirkungendes des blutserums und der lymphe. Zentralbl Bakteriol 27(1): 357-363.
- Aird I, Bentall HH, Roberts JAF (1953) A relationship between cancer of stomach and the ABO blood groups. Br Med J 1(4814): 799-801.
- Edgren G, Hjalgrim H, Rostgaard K, Norda R, Wikman A, et al. (2010) Risk of gastric cancer and peptic ulcers in relation to ABO blood type: a cohort study. Am J Epidemiol 172(11): 1280-1285.
- Risch HA, Lu L, Wang J, Zhang W, Ni Q, et al. (2013) ABO Blood Group and Risk of Pancreatic Cancer: A Study in Shanghai and Meta-Analysis. Am J Epidemiol 177(12): 1326-1337.
- Gates MA, Wolpin BM, Cramer DW, Hankinson SE, Tworoger SS (2011) ABO blood group and incidence of epithelial ovarian cancer. Int J Cancer 128(2): 482-486.
- Meade TW, Cooper JA, Stirling Y, Howarth DJ (1994) Factor VIII, ABO blood group and the Incidence of ischemic heart diseases. Br J Haematol 88(3): 601-607.
- Sasaki J, Waterman MR, Cottam GL (1986) Decreased apolipoprotein A-I and B content in plasma of individuals with sickle cell anemia. Clin Chem 32(1): 226-227.
- Rahimi Z, Merat A, Haghshenass M, Madani H, Rezaei M, et al. (2006) Plasma lipids in Iranians with sickle cell disease: hypocholesterolemia in sickle cell anemia and increase of HDL-cholesterol in sickle cell trait. Clin Chem 365(1-2): 217-220.
- Zorca S, Freeman L, Hildesheim M, Allen D, Remaley AT, et al. (2010) Lipid levels in sickle-cell disease associated with haemolytic severity, vascular dysfunction and pulmonary hypertension. Br J Haematol 149(3): 436-445.
- Seixas MO, Rocha LC, Carvalho MB, Menezes JF, Lyra IM, et al. (2010) Levels of high-density lipoprotein cholesterol (HDL-C) among children with steady-state sickle cell disease. Lipids Health Dis 9: 91.
- Buchowski MS, Swift LL, Akohoue SA, Shankar SM, Flakoll PJ, et al. (2007) Defects in postabsorptive plasma homeostasis of fatty acids in sickle cell disease. J Parenteral Enterael Nutr 31(4): 263-268.
- Yuditskaya S, Tumblin A, Hoehn GT, Wang G, Drake SK, et al. (2009) Proteomic identification of altered apolipoprotein patterns in pulmonary hypertension and vasculopathy of sickle cell disease. Blood 113(5): 1122-1128.
- Aleluia MM, Guarda CC, Santiago RP, Fonseca TC, Neves FI, et al. (2017) Association of classical markers and establishment of the dyslipidemic sub-phenotype of sickle cell anemia. Lipids Health Dis 16(1): 74.
- Lamarre Y, Lalanne-MML, Romana M, Lemonne N, Mougenel D, et al. (2013) Male gender, increased blood viscosity, body mass index and triglyceride levels are independently associated with systemic relative hypertension in sickle cell anemia. PLoS One 8(6): e66004.
- Emechebe GO, Nnamdi BO, Orji M, Achigbu KI (2017) Sickle Cell Disease in Nigeria: A review. Int J Dental Med Sci 16(1): 87-94.
- Turgeon ML (2012) Clinical Haematology: Theory & Procedures (5th ). Wolters Kluwer: Lippincott Williams & Wilkins pp. 120.
- Weatherall DJ (2011) Genetic Disorders of Haemoglobin. In: Post-Graduate Haematology (4th ), Hoffbrand AV, Lewis SM and Tuddenham EGD (Eds.). Arnold Publishers, London, UK, pp. 91-119.
- Luzzato L (2011) Sickle cell anaemia in tropical Africa. Clin Haematol 3(1): 575-577.
- Nnodim JK, Opara AU, Nwanjo HU, Ibeaja OA (2012) Plasma Lipid Profile in Sickle Cell Disease Patients in Owerri, Nigeria. Pak J Nutr 11(1): 64-65.
- Shalev H, Kapelushnik J, Moser A, Knobler H, Tamary H (2007) Hypocholesterolemia in Chronic Anaemia with Increased Erythropoietic Activity. Am J Homeost 82(3): 199-202.
- Oforofuo IAO, Adedeji MO (1994) Effect of sickle cell gene expression on plasma cholesterol in a Nigerian population. Clin Biochem 27(6): 505-508.
- Zailaie MZ, Marzouki ZM, Khoja SM (2013) Plasma and red blood cells membrane lipid concentration of sickle cell disease patients. Saudi Med J 24(4): 376-379.
- Akinlade KS, Adewale CO, Rahamon SK, Fasola FA, Olaniyi JA, et al. (2014) Defective lipid metabolism in sickle cell anaemia subjects in vaso-occlusive crisis. J Niger Med Assoc 55(5): 428-431.
- Uche E, Olowoselu O, Augustine B, Ismail A, Akinbami A, et al. (2018) Lipid profile and disease severity in Sickle Cell Disease patients in Lagos state, Nigeria. Sierra Leone J Biomed Res 10(1): 24-31.
- Emokpae AM, Kuliya-GA (2014) The influence of decreased levels of high-density lipoprotein cholesterol on haematological indices in sickle cell disease patients. Ann Med Health Sci Res 4(2): 157-161.
- Eluwa E, Obidoa O, Onwubiko HA (2006) Variations in the relative activities of erythrocyte membrane with changes in severities of sickle cell anaemia. J Med Biochem 38(4): 142-148.
- Russell MO, Goldberg HI, Friedman AL (2014) Improvement of cerebral vascular disease in sickle cell anemia. Pediatr Res 8(2): 134-137.
- Hebbell RP, Yamada O, Moldow CF, Jacob SH (2010) Abnormal adherence of sickle erythrocyte to cultured vascular endothelium. J Clin Investment 98(10): 154-160.
- Ononogbu IC (1979) Studies on the late pre-B lipoprotein of human serum. Plasma 35(9): 1156-1157.


