


Impact of Asymmetric Information on the Variability of Stock Returns in Nigeria
Oluwaseyi Fanibuyan and Oluseun Paseda*
Department of Banking and Finance, University of Ibadan, Nigeria
Submission: January 10, 2024; Published: January 26, 2024
*Corresponding author: Oluseun Paseda, Department of Banking and Finance, University of Ibadan, Nigeria
How to cite this article: Oluwaseyi Fanibuyan and Oluseun Paseda*. Impact of Asymmetric Information on the Variability of Stock Returns in Nigeria. Ann Rev Resear. 2024; 10(4): 555791. DOI: 10.19080/ARR.2024.10.555791
Abstract
Purpose: Stock returns and asymmetry of information are of common interest because they can uncover dependencies that may be utilized to design trading strategies, the success of which generates implications for market efficiency. This study analyzes the impact of asymmetric information measured by the conditional variance of stock returns on stock returns variability on the Nigerian Stock Market.
Design/Methodology/ Approach: Daily market prices of 35 common stocks listed on the Nigerian Stock Exchange (NSE) for the year 2012-2020 were collected and analyzed utilizing exponential generalized auto-regressive conditional heteroscedasticity (EGARCH) model.
Findings: This study finds that stock returns on Nigerian capital markets are sensitive to both positive and negatives shocks or information. For this reason, there is some scope for active portfolio management which may manifest via financial analysts and consultants developing buy-and-sell recommendations to their clients based on captured trends. Moreover, in terms of capital raising, there is scope for market timing of security issues. In other words, corporate financial managers of growth firms especially can time equity issues to periods of equity market price run-up to exploit slow correction of pricing errors.
Originality/Value: The study is of immense methodological and empirical value as it offers fresh perspective on empirical work exploring why the historical stock price volatility outpaces the volatility of corporate dividend streams with implications on efficient market hypothesis, time-varying discount rates and econometric properties of stock returns.
Keywords: Asymmetric Information; EGARCH; Market efficiency; Stock returns; Capital market
Abbreviations: ARCH: Autoregressive Conditional Heteroscedasticity; EGARCH: Exponential General Autoregressive Conditional Heteroscedasticity; EMH: Efficient Market Hypothesis; GARCH: Generalized Autoregressive Conditional Heteroskedasticity; VCV: Volume Coefficient of Variation; MIA: Multimarket Information Asymmetry; NSE: Nigeria Stock Exchange; ADF: Augmented Dickey Fuller
JEL: B26, C20, D53, D82, E44, G12, G14, G15
Introduction
One of the most important questions in financial economics is how security prices are determined. This is especially true for the stock market, which is one of the largest financial markets in Nigeria. Since it’s a market that involves both buyers and sellers, every player seeks concrete information to maximize their investment returns and minimize their risks in the market. In real life markets, information tends not to be passed across to the players at same time and some don’t have information at all. This is the information asymmetry problem in markets with implications for stock price volatility amongst others. Asymmetric information is a key concept in finance and economics literature. Within the capital markets theoretical context, asymmetric information affects assets prices, liquidity, investment and financing decisions. Since asymmetric information is not a directly observable variable, numerous researchers have proposed empirical proxies in empirical literature. Classic papers utilize the bid-ask spread or other illiquidity measures to proxy asymmetric information [1,2] even though bid-ask spread is also indicative of other illiquidity determinants such as risk, inventory cost and transaction cost. Lof and van Bommel [3] challenge the intuition behind the use of the bid-ask spread and Amihud [4] illiquidity as proxies for asymmetric information when they find that such measures predict return reversals which are a consequence of uninformed rather than informed order flow. Jurkatis [5] also questions the reliability of trade classification algorithms that identify liquidity demander in financial market transactions and proposes a full-information algorithm that actively searches for quotes that match a trade.
Moreover, Easley, Lopez de Prado, and O’Hara, [6] proposed another measure - the probability of informed trading, the well-known PIN measure, which is estimated from transaction-level data and requires stock trades to be classified as either buyer-or seller-initiated - as asymmetric information proxy. Ayadi and Paseda [7] utilized a unique measure labelled the coefficient of elasticity of trading to investigate the impact of liquidity on stock market return. Similar studies are reported in Yang, et al [8] and Wang [9]. The working of the capital market affects liquidity, acquisition of information about firms, risk diversification, savings mobilization and corporate control (Anyanwu, 1998) [10]. Therefore, by changing the quality of these services, it can affect the rate at which the economy grows. Okereke- Onyiuke [11] postulated that the cheap source of funds from the capital market remains a critical element in sustaining development of the economy. Okereke- Onyiuke [11] summarized the advantages of capital market financing to include no short repayment period as funds are held for medium- and long-term period or in perpetuity, funds to state and local government without pressures and ample time to repay loans.
Further, Information is an important tool as driver of stock returns and variability in the equity market. This information can be distinctive and macroeconomic in the form of crosssectional and time series. Generally, information comes to the market on scheduled (before the day and time of the release) or unanticipated (without notice). Information also enters the market symmetrically (linearly) or asymmetrically (non-linearly). It is interesting to know that the information can also be negative (bad) and positive (good) news with serious implications for the variability of stock returns. The result of stock prices to information is used in this study as metrics to measure whether a stock market is symmetric or asymmetric. If the expectation of the equity price is to show a full level of information without any way of price misrepresentation, where all investors are rational and have homogenous expectation of the distribution of the stock returns, and also have the full disclosure of information at the same time in the market, where market prices of the share are equivalent to their intrinsic value and all investors have full knowledge of the opportunities that are available to them and nobody is privilege to have more information than other to make abnormal profit from it at the expenses of others in the market, then it is said that the market is efficient or information symmetric. In the same vein, the market is said to be information asymmetrical when there is a wide gap between the market value and that of the financial instrument and when the expectations of the investor are heterogenous that is, they have different expectations of return due to information differences in the market. It is a situation where one party to a transaction is privileged to explore information unknown to the other party as an opportunity to profit at the expense of the under-informed investors [12]. The purpose of this study is to investigate the impact of information asymmetry, measured by the conditional variance of stock returns, on the variability of stock returns in Nigeria. As far as is known, there are not many studies beside Anifowose [13] that have utilized this measure to gauge the impact of asymmetric information on stock returns variability. This study intends to provide fresh perspectives on an already burgeoning interest in finance literature amidst conflicting evidence on the usefulness of some of the popular measures of information asymmetry.
The current trend to solve such engineering problems more accurately is to use deterministic modular structured cell kinetic models (MSDKM), or hybrid structured modular dynamic (kinetic) models (HSMDM) with continuous variables, and based on cellular metabolic reaction mechanisms, that consider, with a degree of detail suitable to the each approached case study, the cellular metabolic reactions and the cell key-species dynamics. In the HSMDM, the cell-scale model part (including nano-level state variables) is linked to the biological reactor macro-scale state variables for improving both model prediction quality and its validity range. As proved ny Maria [1-5], and Yang et al. [10], the modular structured kinetic models can reproduce the dynamics of complex metabolic syntheses inside living cells. This is why the modular GRC dynamic models, of an adequate mathematical representation, seem to be the most comprehensive mean for a rational design of the regulatory GRC with desired behaviour [11]. These structured dynamic math models (MSDKM, or HSMDM) can satisfactorily represent the key steps of the central carbon metabolism (CCM) at a cell scale, by also including reaction modules responsible for the synthesis of cellular metabolites of interest for the industrial biosynthesis. The same MSDKM can satisfactorily simulate, on a deterministic basis, the self-regulation of cell metabolism for its rapid adaptation to the changing bioreactor reaction environment, by means of complex “genetic regulatory circuits” (GRC-s), which include chains of individual „gene expression regulatory modules” (GERM-s).
In this way, more accurate predictions are obtained both for the dynamics of the biological process at the cellular level, and for the dynamics of the operating parameters of the analyzed industrial bioreactor. The immediate applications of these MSDKM and HSMDM refer to (i) the more precise determination of the optimal operating policy of an industrial bioreactor, and (ii) facilitates, by means of an in-silico (math-model based) numerical analysis, determination of GMO-s with a cell metabolism of desired characteristics [12-16]. In this context, this 2nd part of the work shortly review the essential CBE and NSCT principles and rules used to elaborate MSDKM, but also the so-called „Hybrid structured modular dynamic (kinetic) models” (HSMDM) with continuous variables [12,13,15] that combine the characteristics of the cellular metabolic process involving species participating to the essential reaction modules of CCM (Figure 1 & Figure 2) at a nano-scopic level, with the macro-scopic processes involving the state variables of the industrial bioreactor. Special attention is paid to the conceptual and numerical rules used to build-up modular CCM kinetic models, in direct connection to various individual GERM-s kinetic models, but also to various GRC-s (e.g. toggle-switch, amplitude filters, operons expression, etc.) modular kinetic models by linking a couple of GERM-s. To do such a complex modelling work in a consistent way, this 2nd part of the work will briefly reviews the novel „Whole cell variable cell volume” (WCVV) modelling framework introduced and promoted by the author in previous works, such as [1,2,4-6,8,9,17], as an essential modelling instrument to develop more realistic and precise MSDKM-s and HSMDM-s. Besides presenting the WCVV deterministic model hypotheses, this paper points-out its advantages when simulating GERM-s, and GRC-s dynamics in living cells, in a holistic approach, by contrast to the classical (default) WCCV (whole-cell constantvolume modelling framework). Even worst, as proved by [1,2,4- 6,8,9], such global CCM models, or the whole-cell (WC) math kinetic models of GERM-s, or for the GRC-s constructed in a WC constant cell volume (WCCV) modelling framework, may lead to biased and distorted conclusions about the GERM’s performances, thus making difficult the modular constructions of GRC-s by linking individual GERM-s.
The novel WCVV has been proved to be more realistic and robust [1,2,4-6,8,9], by explicitly including in the MSDKM mathmodel relationships linking the cell-volume growth with the species dynamic mass balances, with also preserving the cellosmotic pressure (that is the cell membrane integrity). The added isotonicity constraints were proved to be essential for more adequately predicting the performance regulatory indices (P.I.) of GERM-s and GRC-s. More specifically, this part briefly reviews the WCVV deterministic model hypotheses, and its advantages when simulating GERM-s, and GRC-s dynamics in living cells, by contrast to the classical (default) WCCV ; regulatory performances indices (P.I.-s) of GERM-s; rules to link GERM-s when modelling various GRC-s (e.g. toggle-switch, amplitude filters, modified operons, etc.), and other related theoretical aspects. As is proved in the Parts 3 and 4 of this work, the in-silico (math/kinetic modelbased) numerical analysis of biochemical or biological processes by using MSDKM or HSMDM models are proved to be not only an essential but also an extremely beneficial tool for engineering evaluations aiming (i) to determine with a higher accuracy the optimal operating policies of complex multi-enzymatic reactors, [18-23], or of bioreactors including the biomass adaptation to the variable bioreactor environment over hundreds of cell cycles [12- 14, 24-27], or even (ii) to easier and quickly simulate and analyze the performances/ characteristics of various GMO-s alternatives, by using the “metabolic flux analysis” (MFA) [27-31], together with the gene-knock-out technique, or the cell cloning procedure [4,5,12-15,31,32].
Literature review
Theoretical Framework
Theoretically, research on volatility in stock returns is often based on Fama’s [14] efficient market hypothesis (EMH). The EMH explains why stock prices fluctuate erratically. According to Fama [14], a market is efficient if security prices reflect all available information. According to the EMH, the future discounted value of the cash flow for investors must be used to assess the intrinsic value of shares and other financial assets [15]. When the stock market is functioning, all available information should be reflected in the stock price. This is vital to assess a company’s future success, so a share’s intrinsic and market value should be identical [16,17]. As a result, any information that could affect the company’s profitability in the future should be reflected immediately in the share price. If the fact that information can be utilized to predict or forecast profitability is not reflected in the delay in the transmission of information to pricing [18,19]. As a result, in an efficient market, share price movements are supposed to be unanticipated as random information enters. The random walk model is given as follows:
Where:
Py+1 = share price at time t + 1
Py = share price at time t
εy+1 = random error with zero mean and finite
Equation 1 shows that, above and above a specific value that is dependent on the introduction of unexpected new data between and between the two, the share price is equal to its price at any given moment. To put it another way, it is unaffected by previous price adjustments. There are three types of efficient markets, the weakest of which has past prices as its information content [14]. The weak form of efficiency suggests that current equity prices reflect all the information from previous prices, and investors cannot utilize any kind of technical analysis to make investment decisions (for determining cheap or overpriced companies). The semi-strong form, on the other hand, is based on the idea that investors cannot use either fundamental or technical analysis to boost market profits because all publicly available information is used in calibrating stock values, and only information not publicly available (private knowledge) can help investors outperform the public.
Empirical Review
The literature on asymmetric information and stock returns in the capital market is examined below. Starting with studies that focus on information asymmetry with respect to volatility that happens in the market, Othman, Alhabshi and Haron [20] did a study on the effect of symmetric and asymmetric information on volatility structure of crypto currency markets with case study on bitcoin currency in Malaysia. The study finds that bitcoin market return or volatility is symmetric informative. Likewise, Onyele and Nwadike [21] did a study on modelling of stock returns volatility and asymmetric news effect with a global perspective the scope of the study covers the S&P 1200 represents a freefloat weighted stock market index of global equities covering seven [7] regional stock market. The data analysis was carried out with generalized autoregressive conditional heteroskedasticity (GARCH) techniques. The findings from the GARCH-M AND TGARCH models revealed explosive volatility persistence and strong asymmetric news effect in the global stock market, respectively. Similarly, Peter, Mondria, and Wu [22] made a study on Asymmetric Attention and Stock Returns, the finding of the study shows that there are stronger stocks with a greater degree of information friction. The new measure of asymmetric attention allows one to infer the arrival of unobservable private information by observing investors’ attention allocation behavior which is in agreement with Onyele & Nwadike [21], Anifowose [13], Nelson (1991), Olowe, [23], Othman, Alhabshi and Haron [20] where the volatility of returns of equities in the market points directly to the information that comes into the market.
Lof and van Bommel [3] propose the volume coefficient of variation (VCV), defined as the ratio of the standard deviation to the mean of trading volume, as a measure of information asymmetry. The authors, using a microstructure model, find that VCV is strictly increasing in informed trade. Easley, et al [6], Duarte, et al [24], Dumitrescu and Zakriya [25] and Gassen, et al [26] concur. Specifically, to address endogeneity problem, Gassen, et al [26] apply fixed effects to control for nonlinear effects of illiquidity. Beaver, et al [27] investigate whether quarterly earnings announcements are informative using nonparametric approach and 1971-2011 sample period and affirm previous evidence on earlier sample periods that significantly more information is conveyed to investors in the three days around earnings announcements than in randomly chosen 3-day periods. Three key findings emerged from the Beaver et al [27] study. First, a dramatic rise in information content at earnings from 2001 onward. Second, asymmetric market reaction based on financial performance in the sense of greater market reaction to profit-making firms than to loss firms. Third, asymmetric market reaction based on size in which case there was significantly higher reaction to larger firms. Revisiting the subject of a long-standing controversy between ownership breadth and future stock returns, the finance literature has been inundated with two opposing hypotheses namely: the short-run constraints hypothesis and the investor recognition hypothesis. Cao and Wu [28] find that the mixed empirical evidence in prior literature comes from opposite effects of positive and negative breadth changes on returns. According to Cao and Wu [28], the breadth-future stock returns relationship is positive when breadth decreases whereas the relationship is negative when breadth increases. Their results imply the domination of the investor recognition hypothesis (shortsale constraints hypothesis) when breadth increases (decreases). Johnson and So [29] develop a simple multimarket information asymmetry (MIA) measure based on the relative trading volume in options and stocks. Their intuition is that informed traders are more prone to generating abnormal volume in stock and option markets. They generate the following empirical properties for MIA viz: positive correlation with spreads, price impact and absolute order imbalances. Within the context of corporate finance interaction with asset pricing, Ali and Hegazy [30] invoke the theories of dividend policy and asset pricing to investigate the impact of dividend changes on stock price risk, stock returns, and the cross-sectional risk-return trade-off using Indian firms’ data for 1999-2018. They find that favourable dividend changes trigger higher stock returns because they convey new information about firms’ future profitability as postulated by the dividend signalling theory.
Methodology
Design
This study focuses on an aspect of asymmetric information and stock returns variability. Based on a careful review of the literature and an earlier empirical works conducted by [23], (Aliyu, 2010, Adewale, Olufemi, and Oseko 2016 and Nwachukwu and Okpara, 2010), where the volatility of stock return in respect to information that comes into the market were evaluated. This study builds on the above listed works. This research sorts the stock prices of equities in the capital market from the different sectors of the market size, then calculates their stock return respectively for all the equities sampled in this study.
Data and Sample
This study will be using Exponential Generalized Auto Regressive Conditional Heteroscedasticity (EGARCH 1,1) model which will require to have series of stock prices for different company and different years. The population of study comprises all listed 108 first-tier equity securities on the floor of NSE as of December 2020. 35 listed equity securities on floor of Nigerian stock exchange were purposive randomly stratified as sample size, which are:
1. Livestock Feeds Plc
2. Okomu Oil Palm Plc
3. Presco Plc
4. Julius Berger Nig. Plc
5. Nestle Nigeria Plc.
6. Unilever Nigeria Plc
7. Cadbury Nigeria Plc.
8. Guinness
9. Dangote Sugar
10. Int. Breweries
11. Nahco
12. Access Bank Plc.
13. Fbn Holdings Plc
14. Guaranty Trust Holding Company Plc
15. Uba
16. Fidelity
17. Sterling Bank
18. Neimeth International Pharmaceuticals Plc
19. Glaxo Smithkline Consumer Nig. Plc
20. Dangote Cement Plc
21. Lafarge Africa Plc
22. Conoil Plc
23. Oando Plc
24. Total Nigeria Plc
25. UBN
26. Ikeja Hotel Plc
27. C & I Am leasing Plc.
28. UACN
29. UNIP
30. ACAD
31. LAF
32. VITAfoam
33. FLM
34. JOHN
35. Zenith bank
The data was gotten from the Nigeria stock exchange site and CSCS site for the period of 9 years that is 2012-2020, the companies were categorized into three level of capitalization which are, large capitalization, medium capitalization and small capitalization with the following criterial:
1M -999M Small Cap.
1B-199B Medium Cap.
200B-5T Large Cap.
The main purpose for this is to detect if asymmetry information aids the categories of capitalization in the capital market. The data was sampled based on all the sector in the Nigeria stock market.
Model Specification Nd Estimation Procedures
The bedrock of the popular Autoregressive Conditional Heteroscedasticity (ARCH) model is that financial time series are dependent on three basic factors: their own previous values (that is, autoregressive), past information (that is, conditional), and non-constant variance (that is, heteroscedasticity). As a result, the presence of these essential characteristics should be well reflected in the proposed volatility model(s) that will be used in this research [31]. The tool for solving this research problem is recent econometric techniques within the context of GARCH family models. According to previous literature, the EGARCH Model is one of the best models for testing the flow of information in the financial market, and it is on this model that this study is based.
Model 1: Asymmetry information has no significant impact on variability of stock return in the Nigeria capital market.
Exponential Generalized Auto Regressive Conditional Heteroscedasticity (EGARCH 1,1) model. The family of GARCH model consists of two distinct specifications. The first is the conditional mean equation and the second equation in a GARCH model is the conditional variance equation. The first equation is estimated as follows:
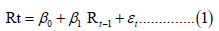
Where: β0 is the intercept.
Rt-1 is the daily return on equity,
where return is calculated as follows: 
where Pn is the new price and Po is the old price.
β1 is a coefficient of return.
ln is the natural log, 𝜀𝑡 is residual error term for the dayt.
The second equation in EGARCH model is conditional variance equation of
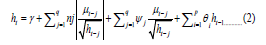
Where:
ht = log of conditional variance of the stock returns.
γ = constant
ηj = arch effects
ψj = asymmetric effects
θi = GARCH effects
ht is the log of the conditional variance. This means that
the leverage effect is exponential, rather than quadratic and
that forecasts of the conditional variance are guaranteed to be
nonnegative.  Measure the information asymmetry.
Ideally, it is expected to be negative implying that bad news has a
bigger impact on volatility than good news of the same magnitude. A significant ψj indicates that information asymmetry has impact
on the stock return variability, and this was used to test the
hypothesis of the study.
Measure the information asymmetry.
Ideally, it is expected to be negative implying that bad news has a
bigger impact on volatility than good news of the same magnitude. A significant ψj indicates that information asymmetry has impact
on the stock return variability, and this was used to test the
hypothesis of the study.
Empirical Results
This section presents the empirical analysis and results of the study. Again, the research aims to investigate the effect of the asymmetric information on the variability of stock returns in Nigeria capital market. The description of the variable begins from the summary statistics contained in Table 1. The ARCH family results are shown in Table 3.


Descriptive statistics

An investigation into stock return and asymmetric information provides significant information regarding the price discovery efficiency of the securities. Significant Jarque Bera statistics clearly rejects the hypothesis, which implies that pattern of all variables does not conform to normal distribution, which is the precondition for any market to be efficient in the weak form Fama, [32,33], Anifowose [13]. The returns, it can be deduced from Table 4.1 that average value of most of the sampled securities under the consideration was negative. (Academy press, cadbury, Conoil, Firstbank, Flour mill Glaxo, Gusiness, Julius Berge, laf, Johnholt, Nahco, Nigeria breweries, Nestle, Oando, Total, UACN, Unilever, University press. the mean returns over the period of (-0.00045, -0.00025, -0.00011, -0.00022, -0.00034, -0.00049, -0.00118, -0.00073, -0.00114, -0.00039, -0.00041, -0.00038, -0.00027, -0.00069, -1.09E-05, -0.00076, -0.00043, -0.00063) respectively. The standard deviation of the return showed a wide dispersion from normality as it evident the unequal nature of mean of the series employed in the study. Also, most of the skewness of the returns was also negative evident the series were skewed to the left and displayed non normality of the data. The excess kurtosis of the return enshrines the evidence of the nature of departure from normality. The Jarque-Bera figures for returns of sampled securities also evidenced most of the returns to be asymmetric and non-normal and it can also be verified from p value of Jarque- Bera test.
Pre-estimation Results
In this section, the series are subject to unit root test to ascertain that the series are stationary for a non-spurious result. Also, the Autoregressive Conditional Heteroscedasticity (ARCH) Effect is conducted on the series to ascertain if the series has timevarying variance.
Augmented Dickey-Fuller Test
From the Table 2 above, the stock returns series of major quoted companies on the Nigeria Stock Exchange (NSE) was subjected to a stationary test to detect if they are mean reverting or not. As shown in the results of the of the unit root using the Augmented Dickey Fuller (ADF), all the studied companies’ stock return series are stationary at levels. This is also in line with the study of Onyele KO & Nwadike EC [21] global research on modelling of stock returns in line with asymmetric news effect a case study of S&P returns. This implies that the null hypothesis of no stationary is rejected for the alternative hypothesis. That is, the individual stock returns series when estimated at levels will yield a non-spurious result.
The ARCH Effect Test
To carry out the asymmetry analysis of the individual stock series, a pre-estimation procedure necessary to show that the series have an unequal variance or heteroscedasticity is vital. The Autoregressive Conditional Heteroscedasticity (ARCH) diagnosis detects the presence of this heteroscedasticity. Hence, the null hypothesis is to accept that there is heteroscedasticity while the alternative hypothesis is to reject. Table 3 presented the ARCH effect results of the stock return series of the studied companies. It was discovered that all stock returns series considered in this study have time-varying variance. This implies that the null hypothesis of the presence of ARCH effect is not rejected. This result goes in line with the study of Bello (2020) Therefore, since the prerequisite to estimating the GARCH model is satisfied by the ARCH effect, this study estimates the EGARCH in line with the study objectives to check asymmetry of the stock return series.
Estimation Results
In this section, the Exponential General Autoregressive Conditional Heteroscedasticity (EGARCH) is used to ascertain the presence of asymmetry in the stock return series. Table 4 below presents the results.
General discussion
From the results presented in the table above, the mean equation shows that depending on each company stock, the average stock returns of NSE quoted companies are not the same. From the results, ACC, FBN, GTB, NES, IKJ, OAN, UBA, and ZEN have significant average positive stock returns over time, while the likes of CAD, DANS, and GUS show an insignificant positive stock returns on average over time. Conversely, many studied companies’ stocks show negative returns. Specifically, BRW, DANC, FLM, GLAXO, JBG, JOHN, LAF, NAHCO, and OKOMU shows that on average, there is significant negative stock returns on their stocks. More so, companies like PRES, TOT, UACN, UBN, ULV, UNIP, VITA, STER, CILEA, and ACAD have significant negative stock returns. However, although CONOIL, FID, LIVEST, and NEITH show a negative average stock return, it was visible that their stock returns are insignificant.
The variance equation results are also reported in Table 3 above. First, the GARCH coefficients of the stock returns of each company in this study are close to 1. This indicates that the model is stable. Also, it denotes that there is presence of time-varying conditional volatility in the individual stock returns, this means that higher market risk arising from the conditional variance (volatility) did not necessarily trigger higher returns in the global market this is In line with Ndei et al. [34]; Banumathy and Azhagaiah [35]. Lastly the significance of the GARCH coefficients indicates that for all the represented companies’ stock returns in this study, the effect of any shock will remain in the forecasts of variance for many periods in the future. Secondly, the EGARCH coefficients of the stock returns shows that majority of stocks quoted in NSE respond greatly to positive news and negative news. Studies such as Edem and Ogbonna [36]; Ndei et al. [34]; Tsuji [37]; Banumathy and Azhagaiah [35]; Jegageevan [38], Anifowose [13], Onyele et al [21], Olowo (2019) lend credence to the existence of volatility persistence and leverage effects in various stock markets. Particularly, stock returns of BRW, CAD, CONOIL, DANS, FID, FLM, GTB, GUS, IKJ, LIVEST, and NAHCO indicate that there is presence of asymmetry in the series, and that positive news has larger effect on their stock returns than negative news. Also, NB, NEITH, OAN, OKOMU, PRES, TOT, UACN, UBA, UBN, VITA, ZEN, STER, CILEA, and ACAD equally indicate that their stock returns are asymmetric; interestingly, good news has larger effect on their stock returns than bad news. but Adewale et al. (2016) found no significant leverage effect in the Nigerian stock market. Conversely, the stock returns of DANC, FBN, GLAXO, LAF, NES, ULV, and UNIP also show the presence of asymmetry, however, bad news or negative shocks have greater effect on their stock returns than good news or positive shocks [39,40]. On the other hand, it was discovered that there is no presence of asymmetry in some stock returns. Specifically, the results above show that ACC, JBG, and JOHN stock returns follow a symmetric order, indicating that the leverage effect of good news or bad news does not affect their stock returns differently. This result is in line with the results of Ndei et al. [34]; Banumathy and Azhagaiah [35], Onyele et al [21].
Discussion based on classification of capitalization.
The large cap stock returns all appear to have witnessed varying periods of relative calm and turbulence that are reinforcing. This suggests evidence of volatility clustering common to high frequency variables such as stock returns (Figure 1). Greater volatility clustering does seem to be associated with the banks’ stock returns among the large cap firms (i.e., First Bank, GT Bank, UBA, Access Bank, and Zenith Bank). However, Union Bank stock returns seem to have experienced relatively calm periods when compared to all other large cap firm stocks returns. A similar pattern of clustered periods of relative calm in stock returns followed by clustered periods of turbulent movements is characteristic of the medium cap firms (Figure 2). Again, stock returns for the bank (Sterling Bank and Union Bank) exhibit a tighter volatility clustering relative to the other medium cap firm stocks. Julius Berger, Oando, Presco, Okomu Oil and International Breweries stock returns exhibit relatively low variations in the periods as against other firms like Flour Mills, Guinness, total and Unilever. The graphical representation of small cap firms is presented in Figure 3. The stock returns of firms in this category also exhibit patterns of volatility clustering. More turbulence is in the stock returns of Ikeja Hotel, Nahco and University Press to the others. On the other hand, more tranquility can be seen in the stock returns of Glaxosmith, Neimeth and Cadbury, with some noticeable spikes that imply turbulent episodes. Academy press, Johnholt, Conoil, Cileasing and Livestock Feeds appear to have similar movement patterns in their stock returns among the small cap firms. In general, the large cap stocks demonstrate more volatility clustering than the medium cap firms. In the same way, there is more volatility clustering among the medium cap firms than among the small cap firms. This is not surprising because the degree of perturbations in the stock returns reflects the extent to which investors demand for or trade the underlying stocks. Investors tend to use market capitalization as a yardstick for measuring the relative attractiveness of stocks. As such, large cap firms are likely to be more traded and thus exhibit greater volatility clustering in their returns relative to medium or small cap firms. In the same vein, medium cap firms are usually traded more than small cap firms.


Implications of the Empirical Results
Theoretical Implications
The results of the study show that almost all of the equities have leverage effect/ asymmetric effect that is there is a trigger in the price of stock by an information both positive shock or negative shock (good and bad news) respectively. According to the main theory, which efficient market theory developed by [14] explains that efficient market is one which all available information is reflected in the stock price. EMH also says intrinsic value of shares is defined by the future discounted value of the cash flow accruing to the investor [15] with regards to the result of this study it implies that the result is not line with the theory of efficient market hypothesis which the investor will eventually be the affected party in the market because the firm are trying in all human sense to increase their wealth in any way they can do. Prior to this study and due to data challenges, it has been difficult to achieve triangulation in research on asymmetric information and stock return variability in Nigeria. This study breaks important new ground by uncovering the impact of the conditional variance of stock returns (as proxy for asymmetric information) on return variability. The study is of immense methodological and empirical value as it offers fresh perspective on empirical work exploring why the historical stock price volatility outpaces the volatility of corporate dividend streams with implications on efficient market hypothesis, time-varying discount rates and econometric properties of stock returns.
Practical Implications
Due to the fact that the market is not efficient seen from the result of the analysis (Table 4), the implication of this is that the assessment of firm’s performance in the future will not be true because their intrinsic value is not the same as their market value due to information that was not passed on time or eventually hoard, thus will later cause adverse selection and turn to moral hazard to the investors. Also, as it is known that any alter in the firm profitability in the future must be incorporate in the price immediately, in this instance where the market is not efficient, the information will be delay and the false price now will lead to irrationality among the investors because information can be used to predict their profit.
Summary and Conclusion
In summary, the empirical results significantly suggest that stock returns volatility in Nigeria capital market persist over a long period with no significance risk -return trade-off, and that positive shock or good news exerted greater effect on Nigeria capital market stock returns volatility than negative shock or bad news.
The study concluded that information exists asymmetrically within the market in line with the major findings in the study and the related deductive discussions, as most securities have important impact, as indicated by asymmetry effect test; this is a signal that investors don’t have enough information to play with in the market which can lead to adverse selection of asset and eventually lead to moral hazard. This finding is consistent with that of Onyele KO & Nwadike EC [21], Anifowose [13], Nelson (1991), Olowe [23], Othman, Alhabshi and Haron [20], Peter, Mondria, and Wu [22]. Sequels to the findings in this study, the following recommendations have been outlined for effective policy actions to the investor, cooperation and the regulators:
i) Financial analysts and consultants should examine previous trading activities to produce an efficient portfolio for the client when making purchasing and selling recommendations.
ii) The investor should study patiently with the trend of the market which will give them an edge in the predictability of the price which will eventually result in profit unto them.
iii) A good information dissemination platform (software) should be built to enable the accurate flow of information within the market.
iv) To avoid the manipulation of market information data, the Securities exchange commission should implement appropriate policies that can be significant for determining the dynamic of the market that can lead to macroeconomic stability of a country.
v) The regulatory body should pronounce a sanction on any company that is into the act of hoarding information from the players in the market.
Finally, this study therefore recommends that future study should focus on the other 123 equities listed on the stock exchange were excluded. For instance, the data used for this study, contain information from 35 equities in the Nigeria stock exchange market. Additional research that replicates this analysis in another context would be highly valuable for comparison within two or more equities.
References
- Roll R (1984) A simple implicit measure of the effective bid-ask spread in an efficient market. J Finance 39(4): 1127-1139.
- Amihud Y, Mendelson H (1986) Asset pricing and the bid-ask spread. J Financial Economics 17(2): 223-249.
- Lof M, Van Bommel J (2023) Asymmetric information and the distribution of trading volume. J Corporate Finance 82: 102464.
- Amihud Y (2002) Illiquidity and stock returns: cross-section and time-series effects. J Financial Markets 5(1): 31-56.
- Jurkatis S (2022) Inferring trade directions in fast markets. J Financ Market 58: 100635.
- Easley D, Lopez De Prado M, O’Hara M (2012) Flow toxicity and liquidity in a high frequency world. Review of Financial Studies 25: 1457-1493.
- Ayadi OF, Paseda OA (2023) The causal relationship between coefficient of elasticity of trading and market return in an African emerging market, Journal of Business and Socio-economic Development 3(2): 166-179.
- Yang YC, Zhang B, Zhang C (2020) Is information risk priced? Evidence from abnormal idiosyncratic volatility, J Financial Economics 135(2): 528-554.
- Wang Y (2021) How are institutions informed? Proactive trading, information flows and stock selection strategies. Contemporary Accounting Res 38(3): 1849-1887.
- Paseda OA (2006) Investment Performance of Common Stocks in Nigeria: Tests of Some Finance Theories, MSc Dissertation, University of Nigeria.
- Okereke Onyiuke N (2000) Stock Market Financing Options for Public Projects in Nigeria NSE factbook.
- Omokehinde J, Abata M, Somoye R, Migiro S (2017) Asymmetric Information and Volatility of Stock Returns in Nigeria. J Economic Behav Stud 9(3).
- Anifowose M (2013) Information Asymmetric Effect on the Stock Return Volatility in Nigerian Capital Market. Account Frontier 14(2): 47-64.
- Fama E (1970) Efficient capital markets: A review of theory and empirical work. J Finance 25(2): 383-417.
- Fauzel N, Fauzel S (2016) Testing weak form efficiency: An international market perspective. Int Rev Business Res Papers 12(1): 171-192.
- Dukes W, Bowlin O, MacDonald S (1987) The Performance of Beta in Forecasting Portfolio Returns in Bull and Bear Markets Using Alternative Market Proxies. Quarterly J Business Economics 26(2): 89-103.
- Lo AW, MacKinlay AC (1988) Stock market prices do not follow random walks: Evidence from a simple specification test. Rev Financ Stud1(1): 41-66.
- Bohl MT, Henke H (2003) Trading volume and stock market volatility: The Polish case. International Review of Financial Analysis 12(5): 513-525.
- Fama E (2021) Efficient Capital Markets II: In J. Cochrane & T. Moskowitz (Ed.), The Fama Portfolio: Selected Papers of Eugene F Fama, Chicago: University of Chicago Press pp. 122-173.
- Othman AHA, Alhabshi SM, Haron R (2019) The effect of symmetric and asymmetric information on volatility structure of crypto-currency markets: A case study of bitcoin currency. J Financial Economic Policy 11(3): 432-450.
- Onyele KO, Nwadike EC (2021) Modelling Stock Returns Volatility and Asymmetric News Effect: A Global Perspective, Finance Risk Manag Rev 7(1): 1-15.
- Peter C, Mondria J, Wu T (2020) Asymmetric attention and stock returns. Manag Sci 67(1): 48-71.
- Olowe RA (2009) Modelling Naira/Dollar Exchange Rate Volatility: Application of Garch and Asymmetric Models. Int Rev Business Res Papers 5(3): 377-398.
- Duarte J, Hu E, Young L (2020) A comparison of some structural models of private information arrival. J Financial Economics 135(3): 795-815.
- Dumitrescu A, Zakriya M (2022) Governance, information flow and stock returns. J Corporate Finance 72: 102168.
- Gassen J, Skaife HA, Veenman D (2020) Illiquidity and the measurement of stock price synchronicity, Contemporary Accounting Res 37(1): 419-456.
- Beaver WH, McNichols MF, Wang ZZ (2018) The information content of earnings announcements: new insights from intertemporal and cross-border behaviour. Rev Account Stud 23(1): 95-135.
- Cao Z, Wu W (2022) Ownership breadth: Investor recognition or short-sale constraints? Finance Research Letters 47: 102847.
- Johnson TL, So EC (2018) A simple multimarket measure of information asymmetry, Management Sci 64(3): 1055-1080.
- Ali H, Hegazy AY (2022) Dividend policy, risk and the cross-section of stock returns: Evidence from India. Int Rev Economics Finance 79: 169-192.
- Cont R (2005) Volatility clustering in financial markets: Empirical facts and agent–based models. Ecole Polytechnique: Center for Applied Mathematics p. 1-21.
- Fama E (1965a) The behavior of stock market prices. Journal of Business 38(1): 34-105.
- Fama E (1965b) Random walks in stock market prices. Financial Analysts J 21: 55-59.
- Ndei C, Muchina S, Wawure K (2019) Modeling stock market return volatility in the presence of structural breaks: Evidence from Nairobi securities exchange, Kenya. Int J Res Business Soc Sci 8(5): 156-171.
- Banumathy K, Azhagaiah R (2015) Modelling stock market volatility: Evidence from India. Managing Global Transitions 13(1): 27-42.
- Edem CA, Ogbonna UG (2020) Evaluation of volatility persistence and asymmetric effect in Nigerian capital market. IOSR J Economics and Finance 11(1): 19-26.
- Tsuji C (2018) Return transmission and asymmetric volatility spillovers between oil futures and oil equities: New DCC-MEGARCH analyses. Economic Modelling 74(2): 167-185.
- Jegageevan S (2015) Return volatility and asymmetric news effect in Sri Lankan stock market. Economic Research Department: Central Bank of Sri Lanka, Working Paper Series 166: 37-57.
- Cheng H, Huang D, Luo Y (2020) Corporate disclosure quality and institutional investors’ holdings during market downturns. J Corporate Finance 60: 101523.
- Shiller RJ (1981) Do stock prices move too much to be justified by subsequent changes in dividends? American Economic Review 71(3): 421-436.


